227
Power BI Gross Sales to Profit Dashboard
Power BI Gross Sales to Profit Dashboard
More Report pages
Report Author: Ugo Ndu
227
Share template with others
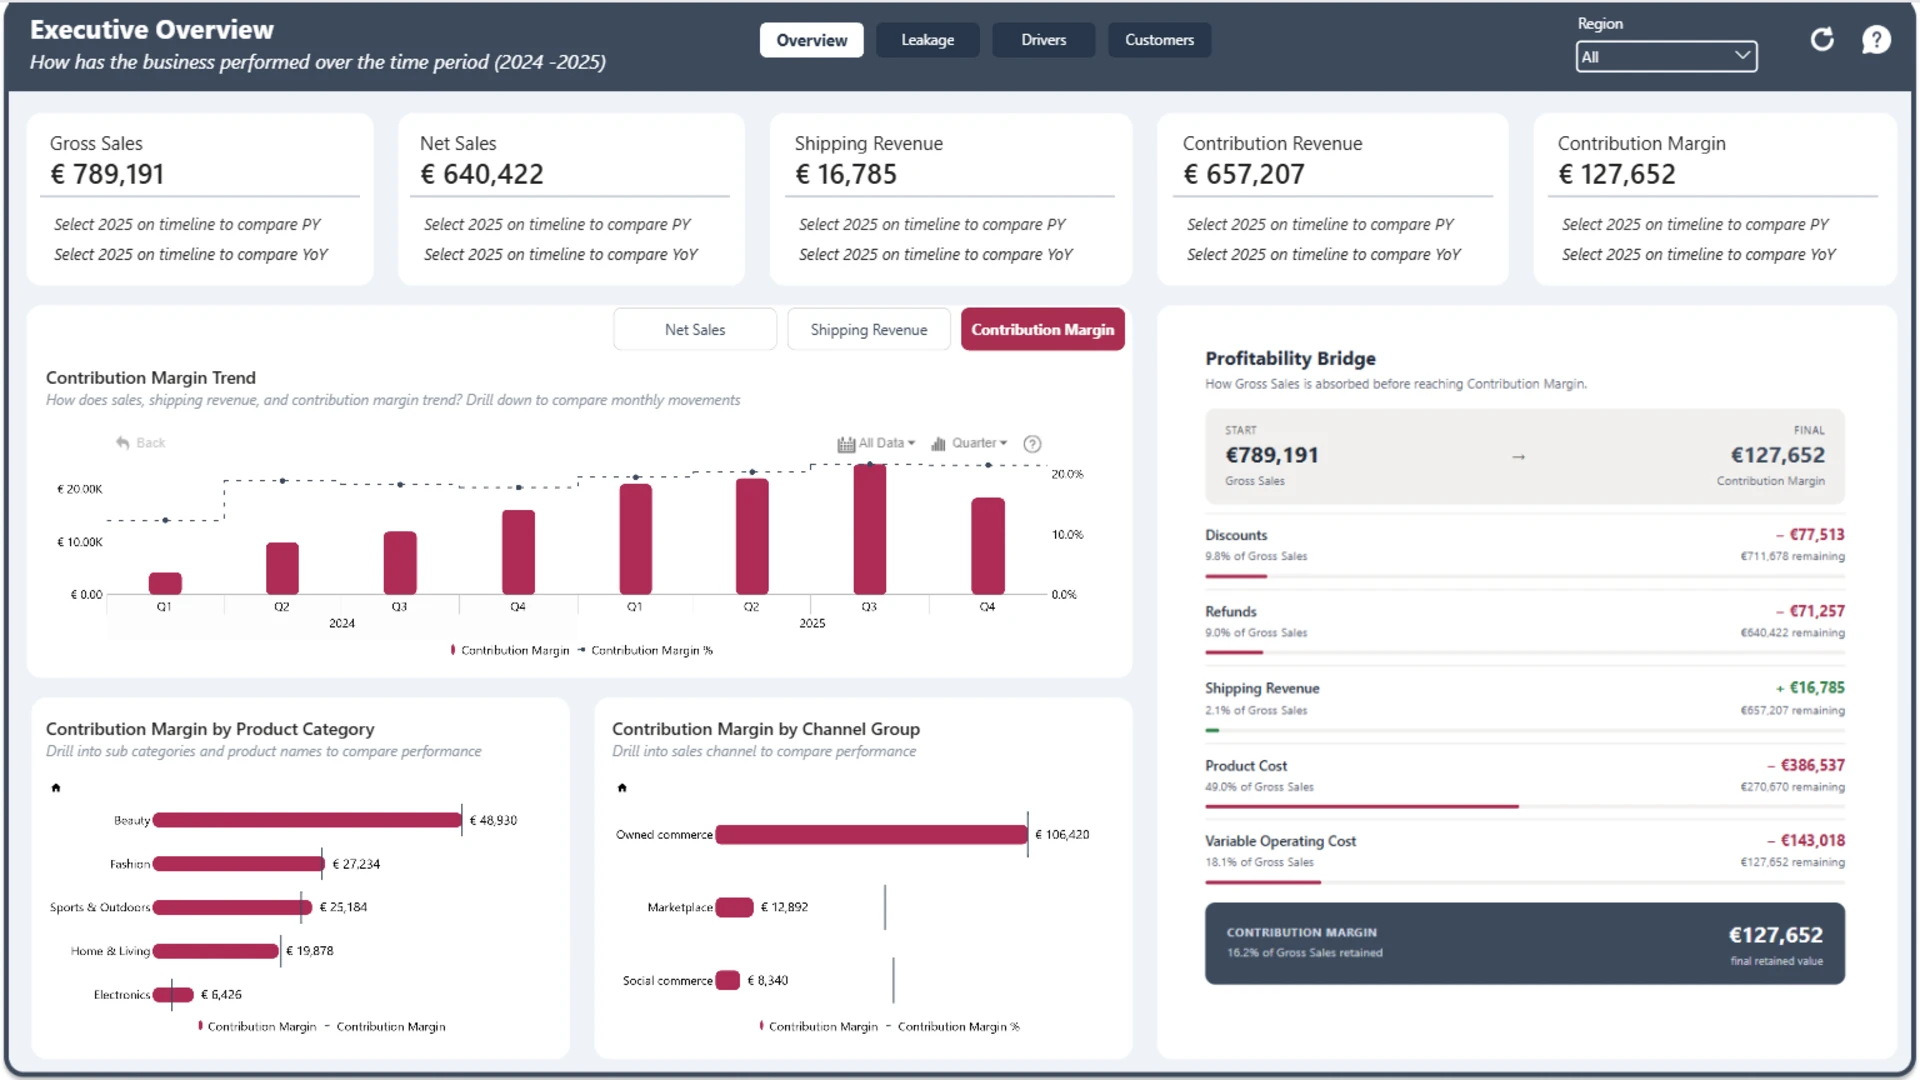
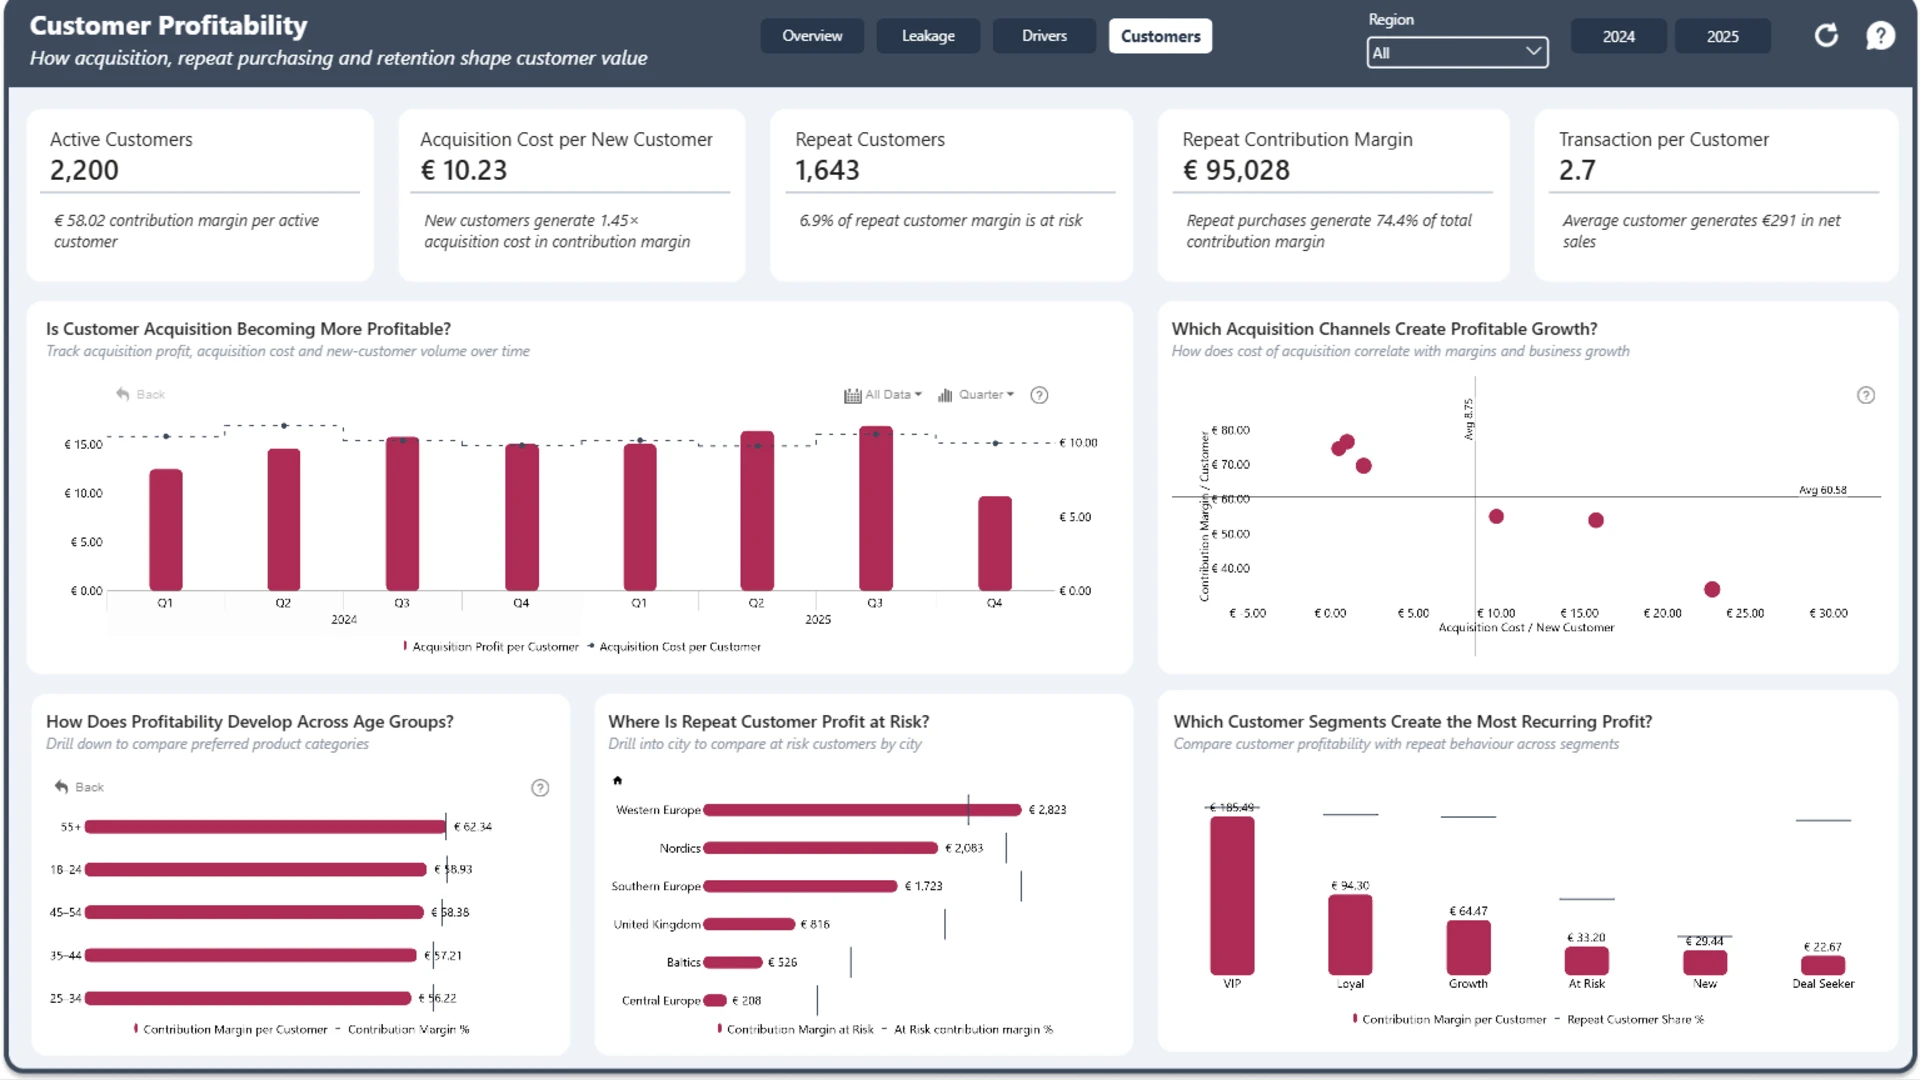
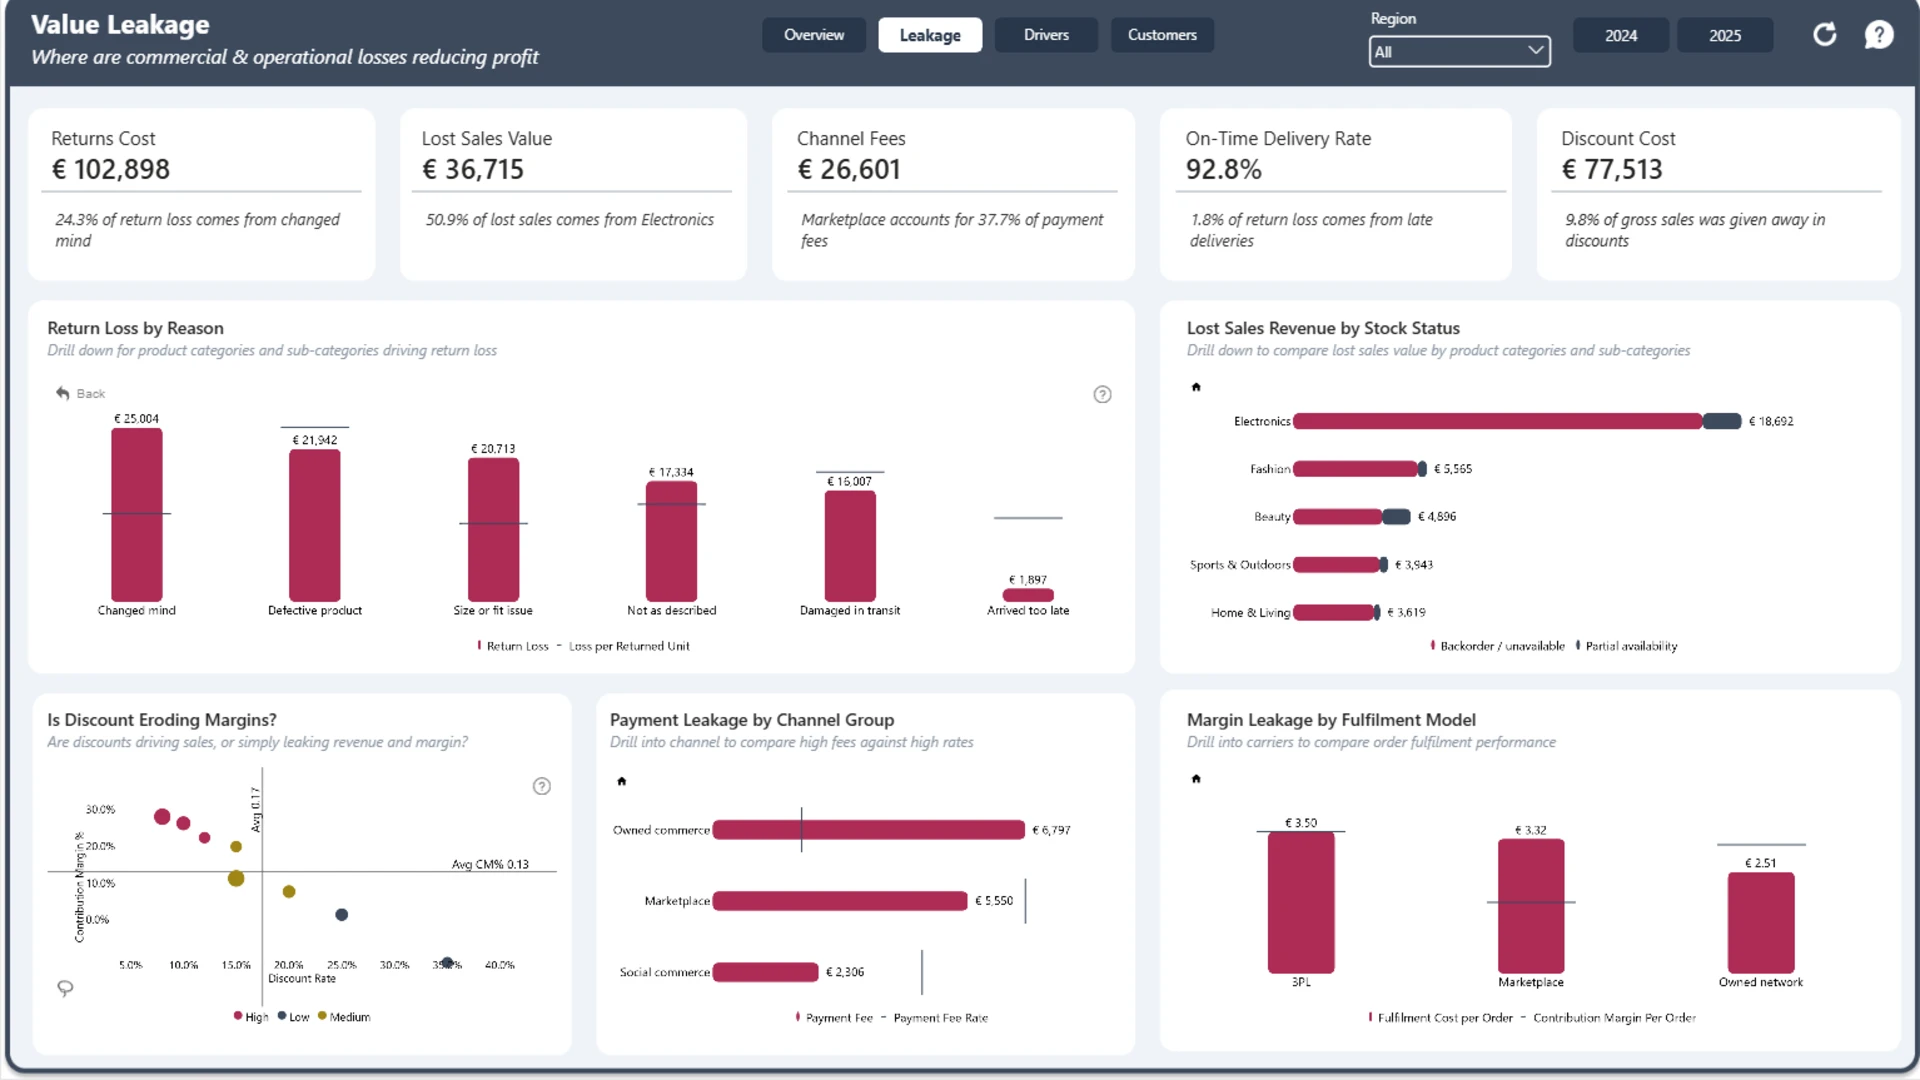
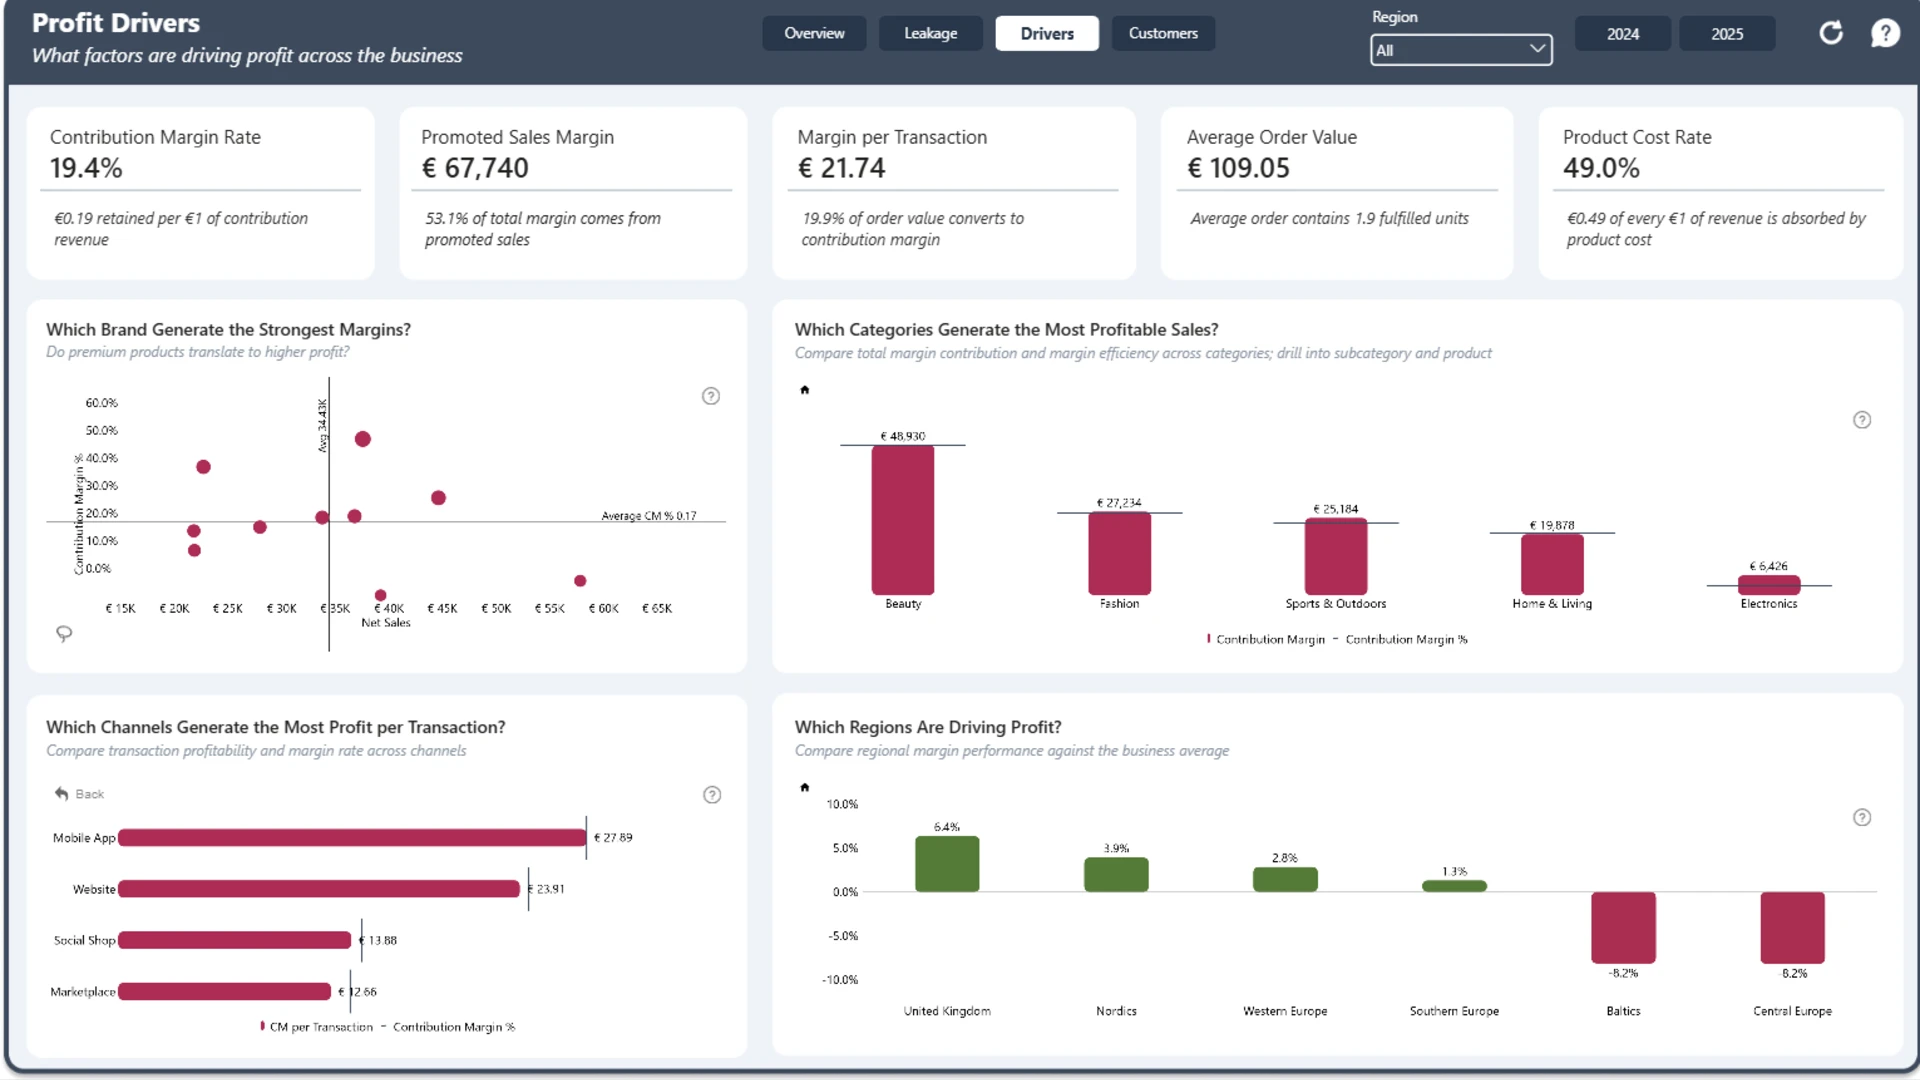
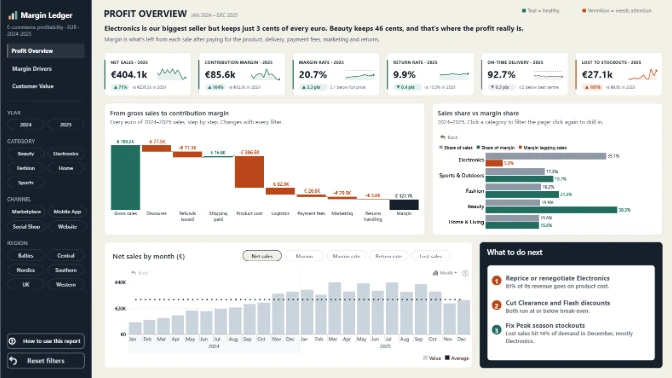
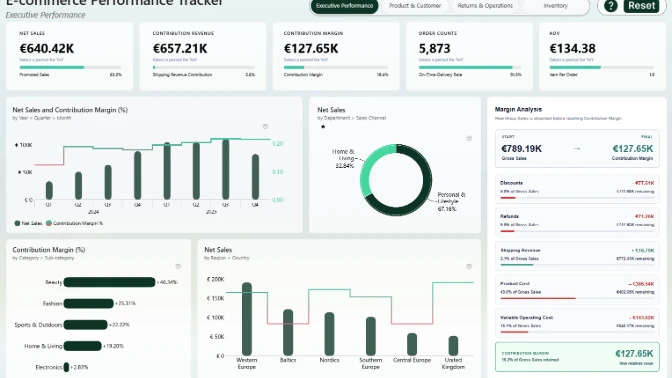
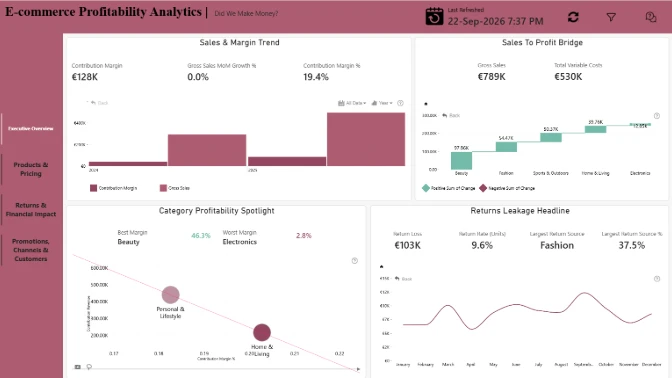
This Power BI e-commerce example focuses on gross sales to profit dashboard with European online retail data. It connects relevant sales, margin, customer, return, promotion, fulfillment, market, and inventory perspectives.
This analysis investigates why the business is not converting more of its sales into contribution margin. It starts by assessing overall profitability, then identifies where value is leaking through returns, discounts, fees, lost sales and fulfilment. It then examines the products, channels and markets driving stronger margins, before assessing whether customer acquisition, repeat behaviour and retention are supporting sustainable profitability.
ZoomCharts visuals used




4U Report Challenges
Participate in data challenges, build and submit reports to get free template downloads.
Join CommunityMobile view allows you to interact with the report. To Download the template please switch to desktop view.
How to use a PBIX template
Preview the interactive report, download the PBIX file, open it in Power BI Desktop, and replace the same data connection with your own dataset.
Preview and download
Explore the report online and download the PBIX template file.
Open in Power BI Desktop
Open the downloaded PBIX file in Power BI Desktop.
Connect your data
Replace the sample data source with your own dataset.
Refresh and adjust
Refresh the model and update fields or visual were needed.
Save and share
Save your report and publish it for your audience.


