407
Power BI Global B2B Sales Dashboard
Power BI Global B2B Sales Dashboard
More Report pages
Report Author: Patrycja Kojak
407
Share template with others
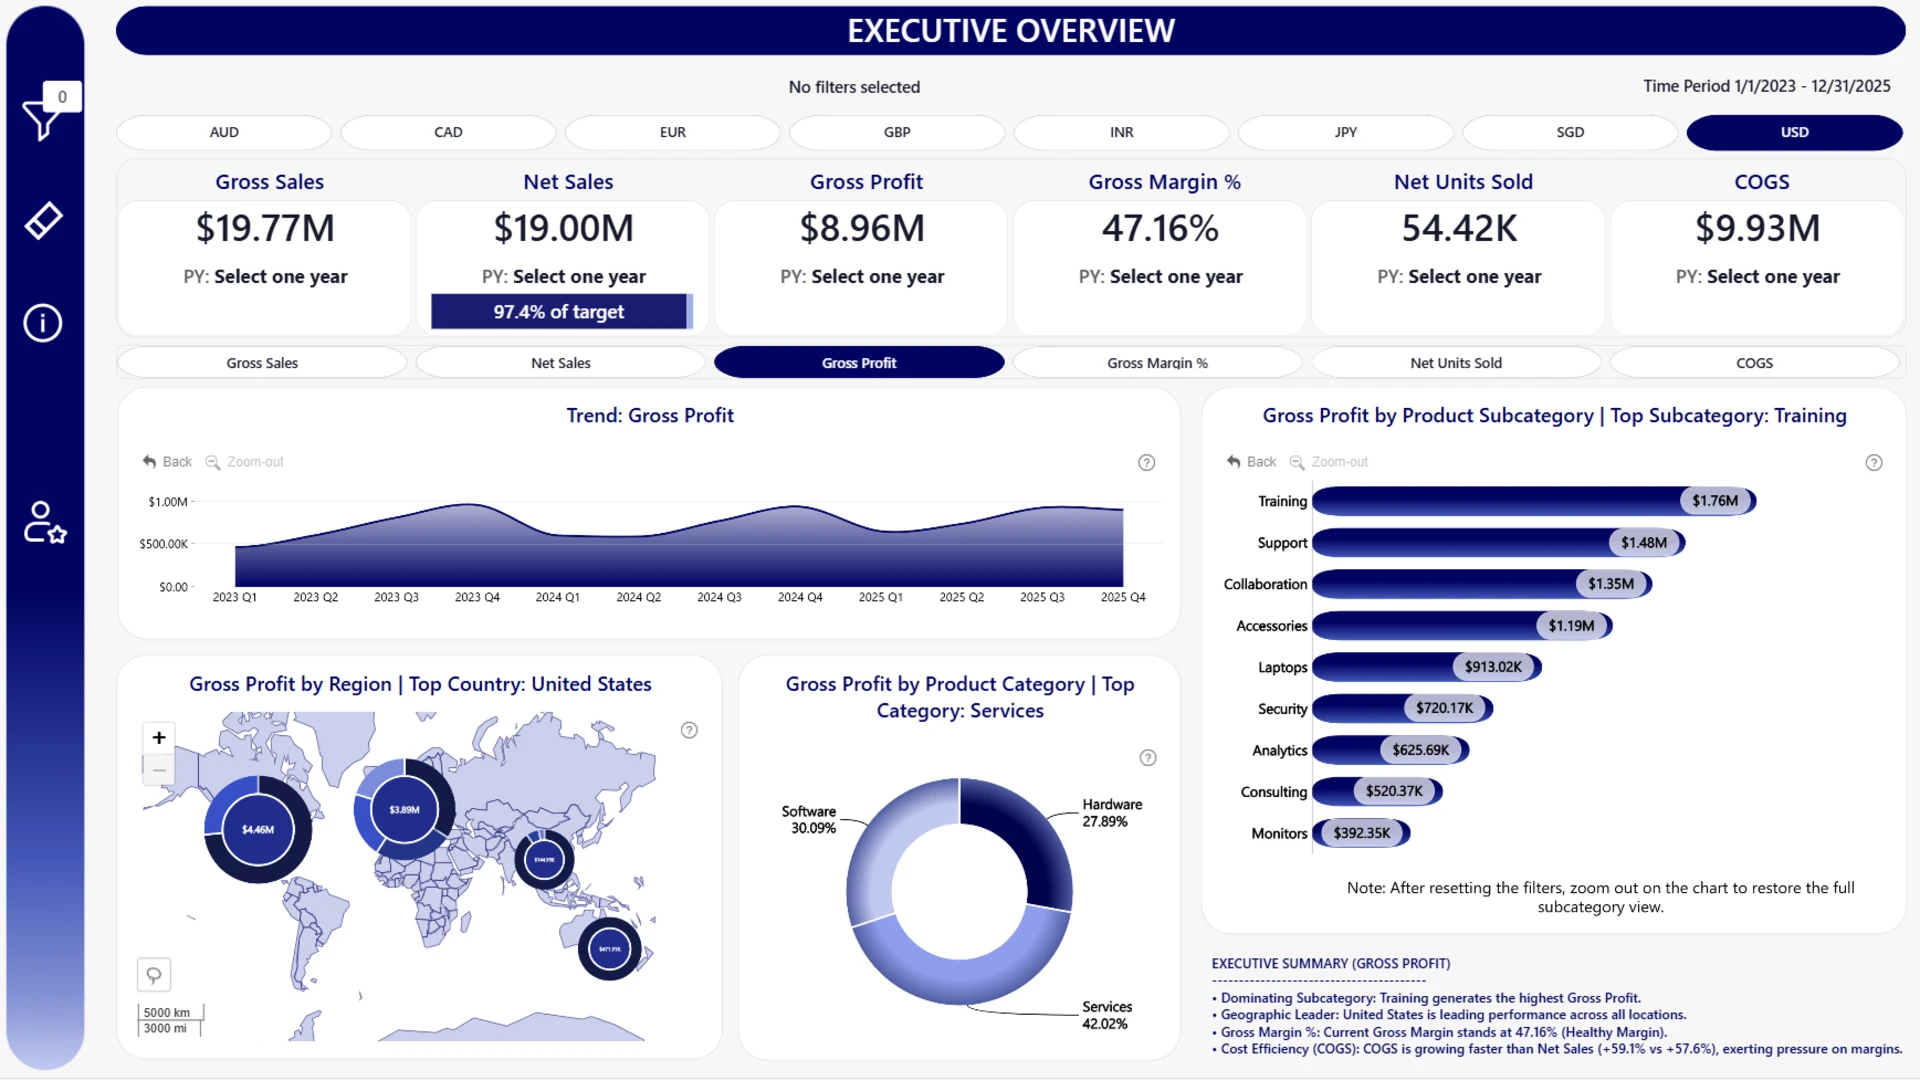
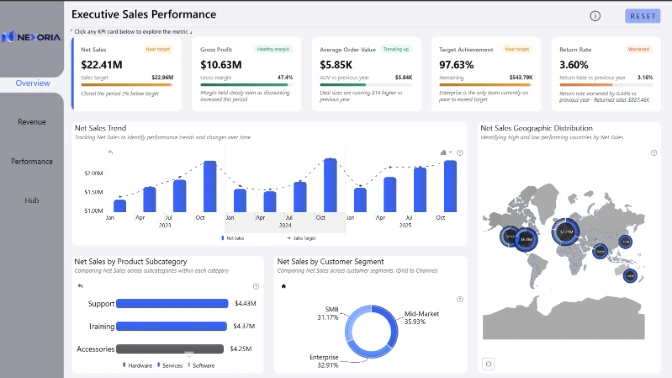
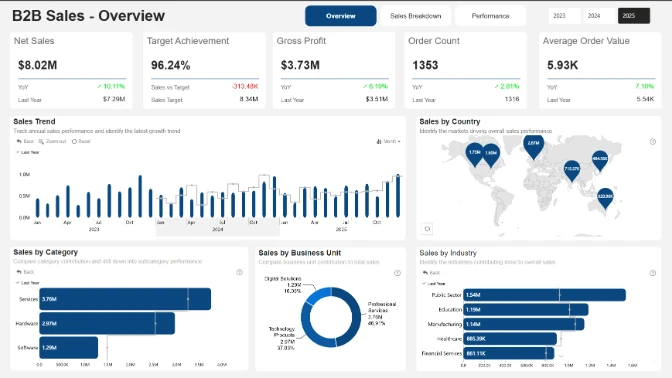
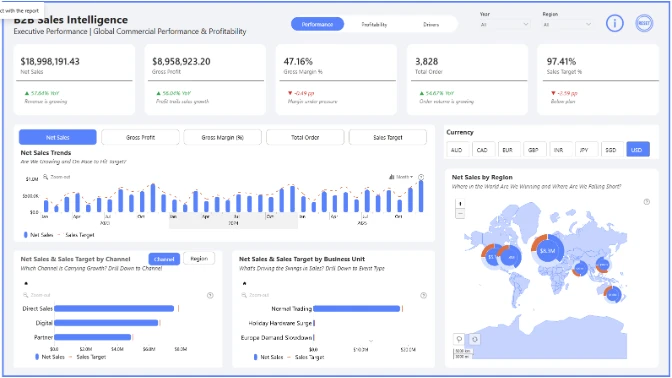
This interactive Power BI global B2B sales dashboard provides an overview of revenue, profitability, targets, customer and product performance, sales channels, teams, promotions, returns, and business events across three major regions.
Built for the ZoomCharts 4U Report Challenge August 2026, the report uses Power BI and ZoomCharts Drill Down visuals to analyze the global B2B sales dataset covering 2023-2025.
Author’s Description
The Power BI Global B2B Sales Dashboard is an interactive sales analytics report designed to provide a clear view of sales performance, profitability, target achievement, customer behavior, and returns. It combines financial and operational KPIs to identify the main drivers of sales performance and areas that require attention.
Key Areas of Analysis
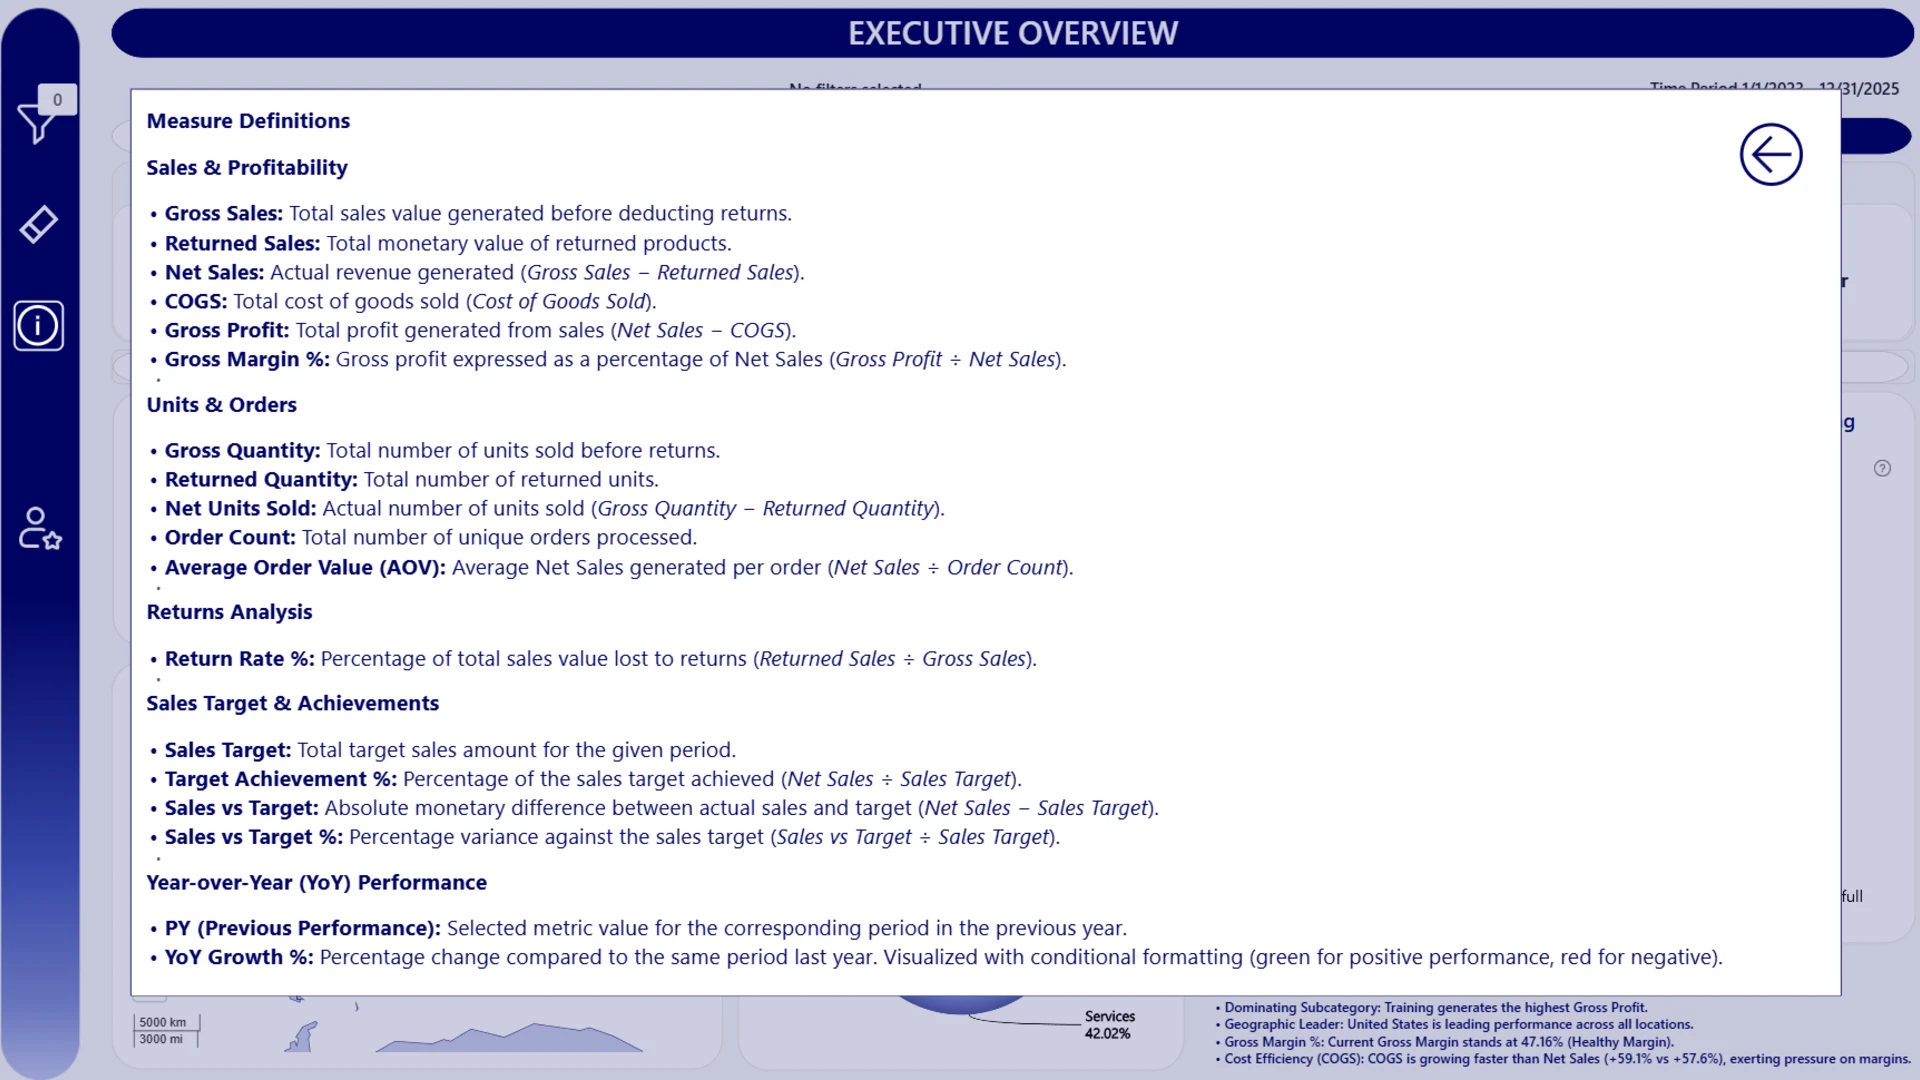
Sales & Profitability: Gross Sales, Net Sales, COGS, Gross Profit, and Gross Margin.
Target Performance: Sales achievement against targets and variance from target.
Sales Trends: Current performance compared with the previous year and YoY changes.
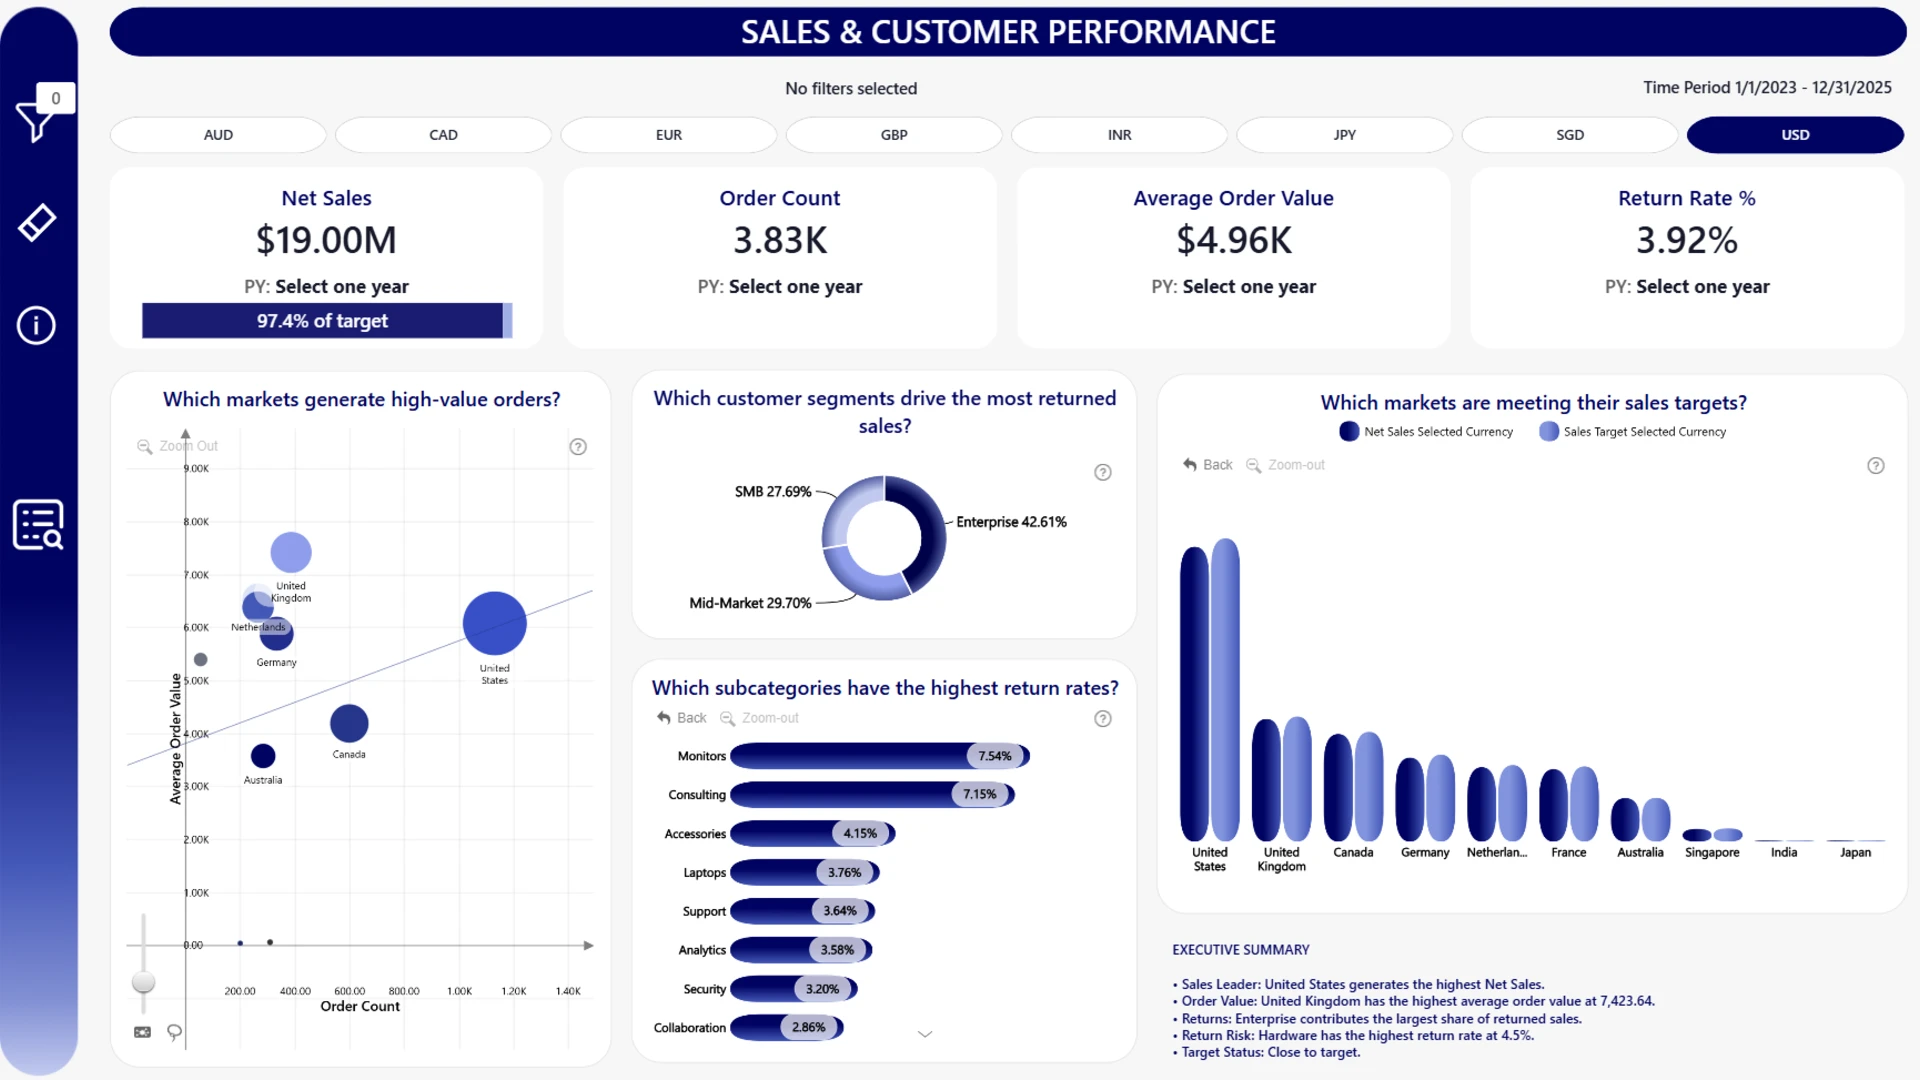
Customer & Order Performance: Order volume, Average Order Value (AOV), and Net Units Sold.
Returns Analysis: Returned sales and return rates across customer segments.
Geographic Performance: Sales performance across markets and regions.
Dashboard Structure
Page 1: Sales Performance
Provides an overview of sales and profitability, including KPI analysis, target achievement, and detailed performance breakdowns.
Page 2: Customer & Sales Performance
Explores sales through order volume and AOV, compares results against targets, and shows the impact of returns across customer segments.
Key Features
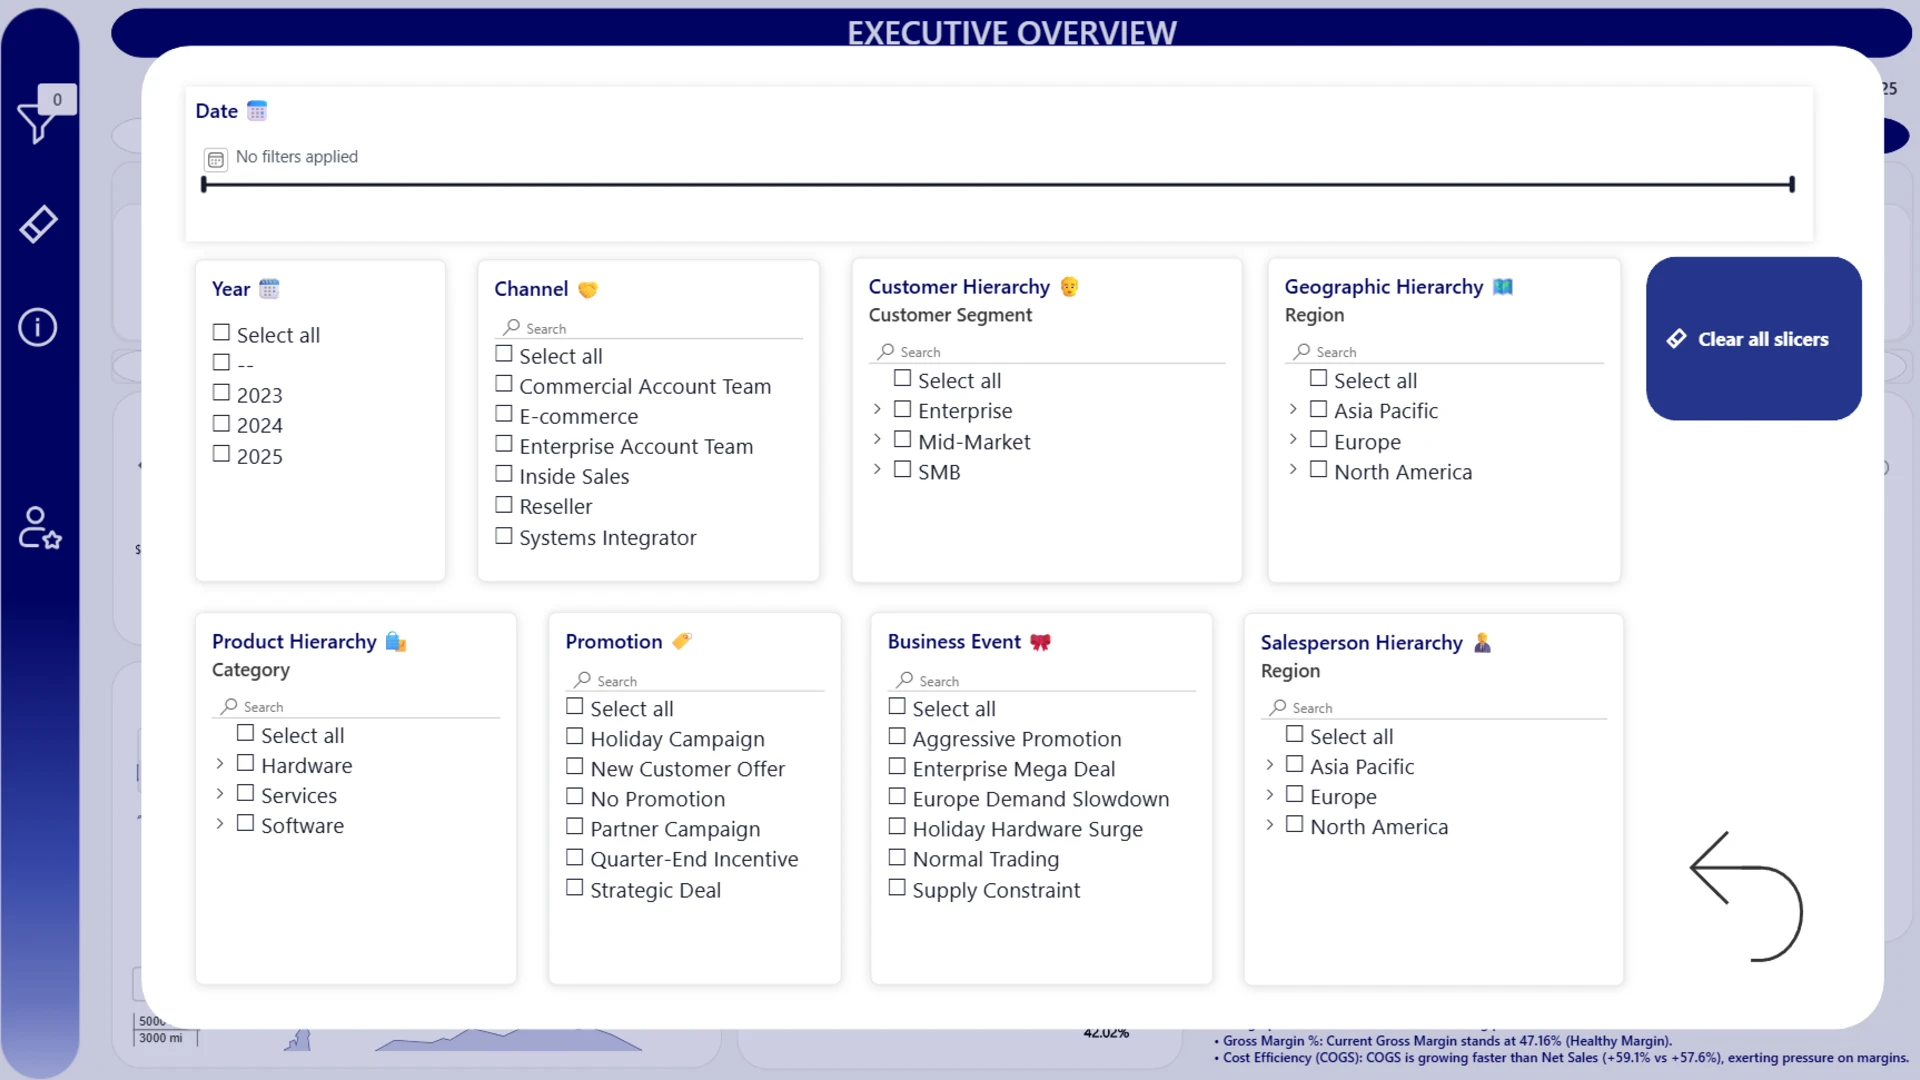
- Interactive metric selection
- Dynamic currency conversion
- Current vs. Previous Year comparison
- YoY and percentage-point analysis
- Target achievement tracking
- Interactive tooltips
- Executive insights with dynamically generated business conclusions
- Question-based visual titles to guide the analysis
The dashboard is designed to help users understand what is driving sales performance, where targets are being met or missed, how customers contribute to sales, and where returns have the greatest impact.
ZoomCharts visuals used




4U Report Challenges
Participate in data challenges, build and submit reports to get free template downloads.
Join CommunityMobile view allows you to interact with the report. To Download the template please switch to desktop view.
How to use a PBIX template
Preview the interactive report, download the PBIX file, open it in Power BI Desktop, and replace the same data connection with your own dataset.
Preview and download
Explore the report online and download the PBIX template file.
Open in Power BI Desktop
Open the downloaded PBIX file in Power BI Desktop.
Connect your data
Replace the sample data source with your own dataset.
Refresh and adjust
Refresh the model and update fields or visual were needed.
Save and share
Save your report and publish it for your audience.


