548
Power BI Executive KPI Dashboard
Power BI Executive KPI Dashboard

More Report pages
Report Author: Abhijit Basak
548
Share template with others
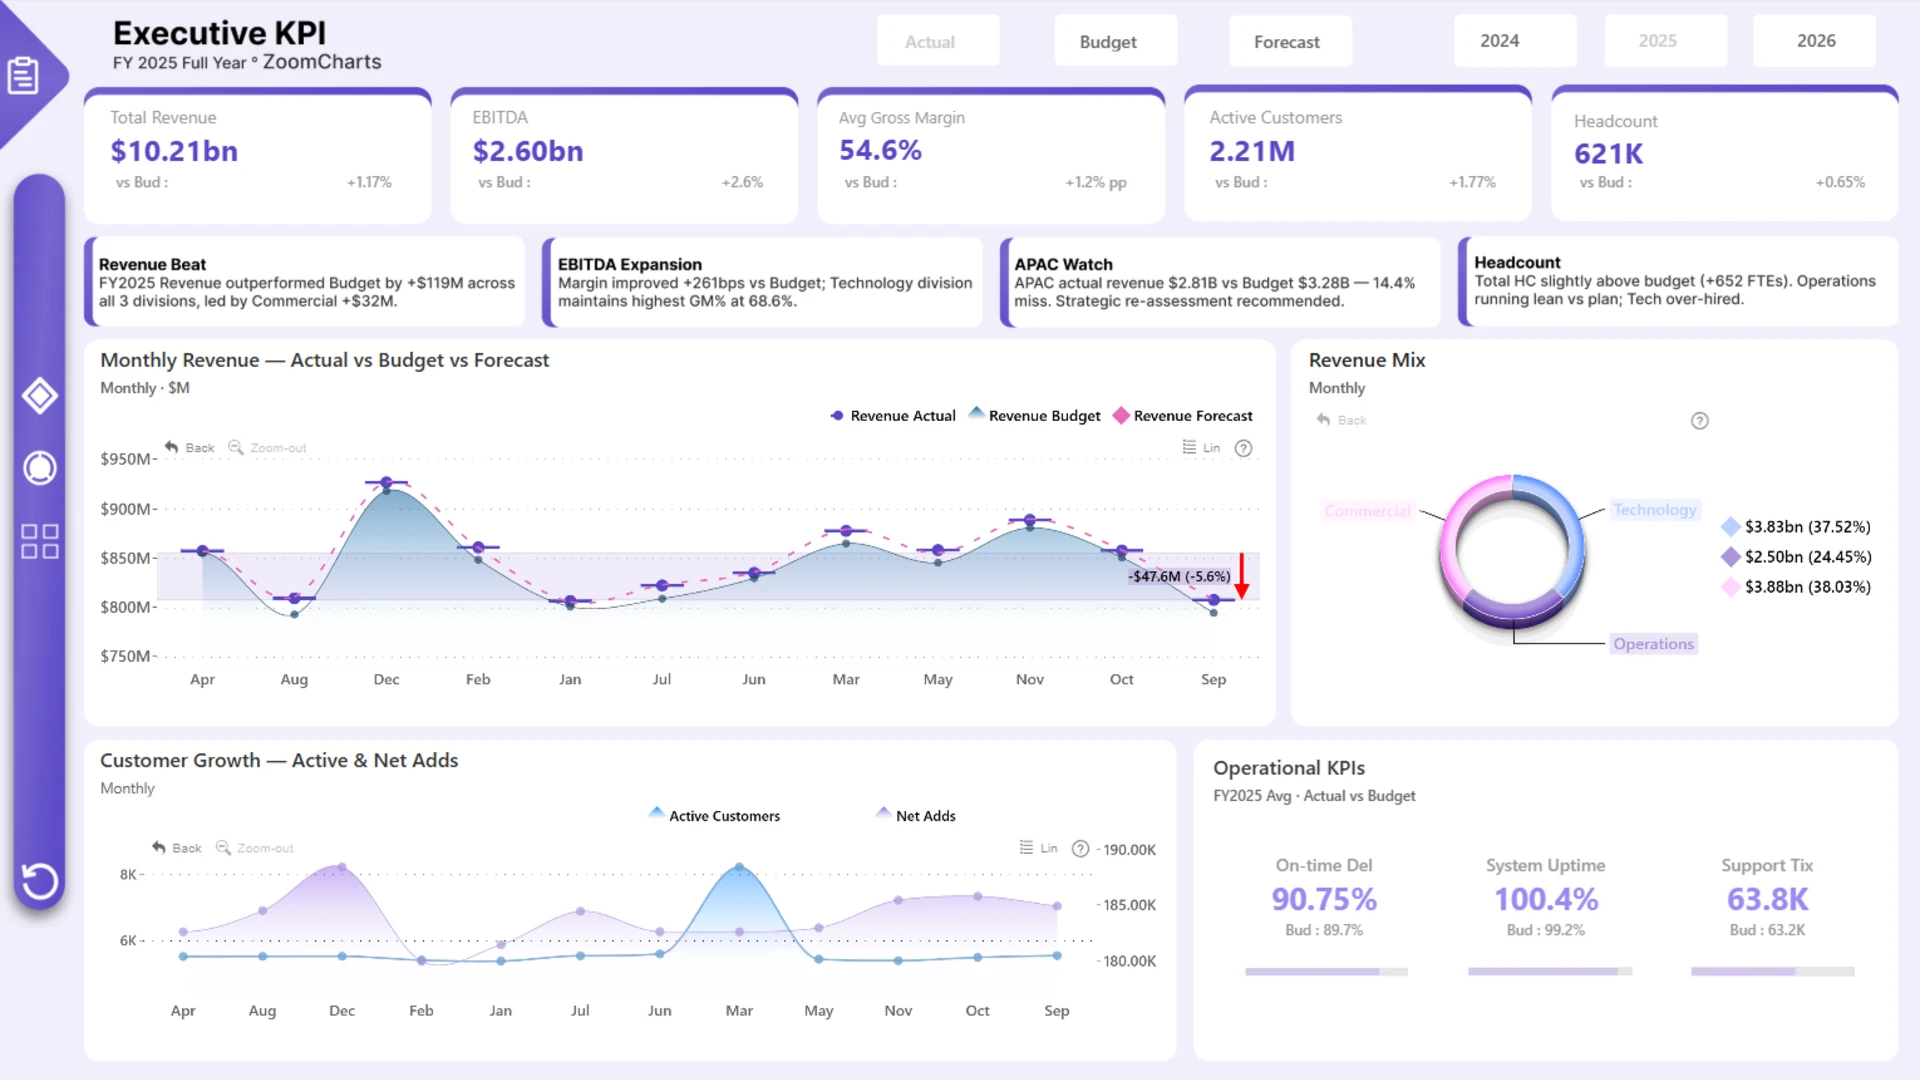
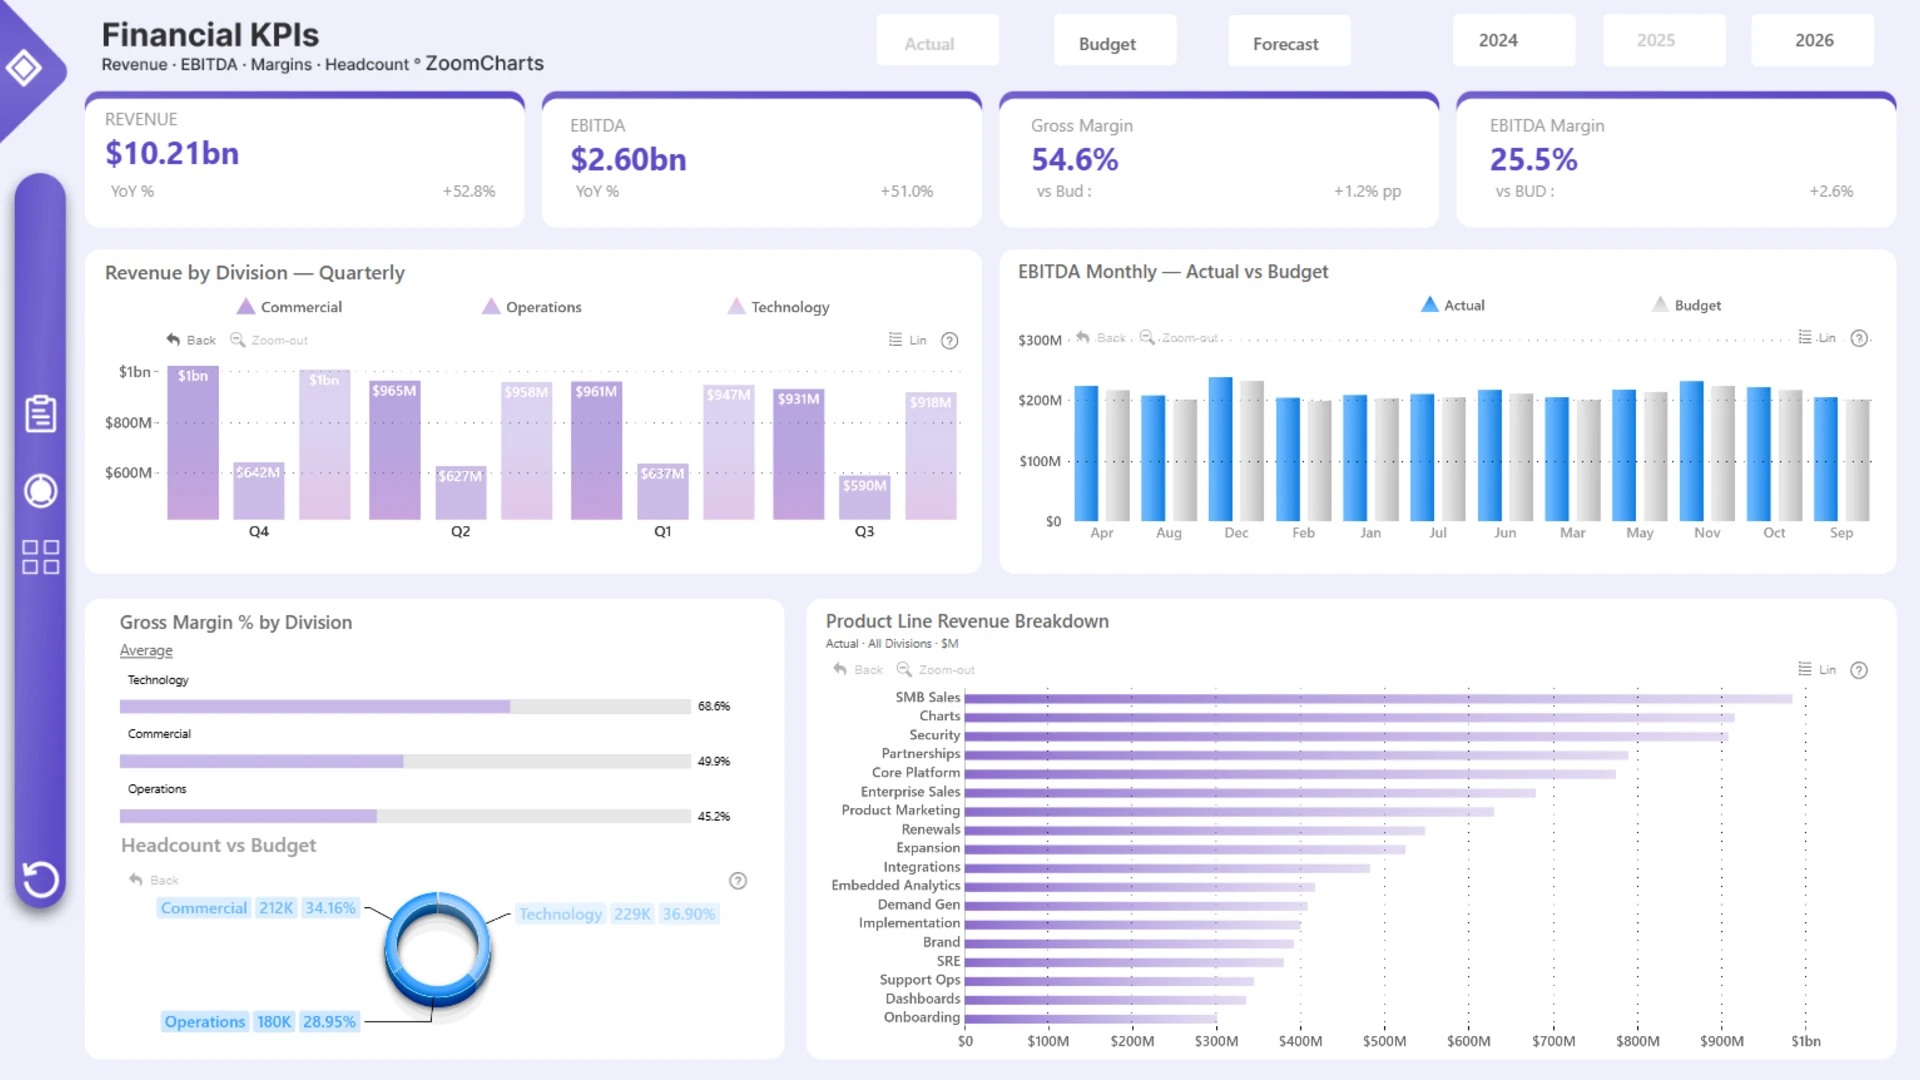
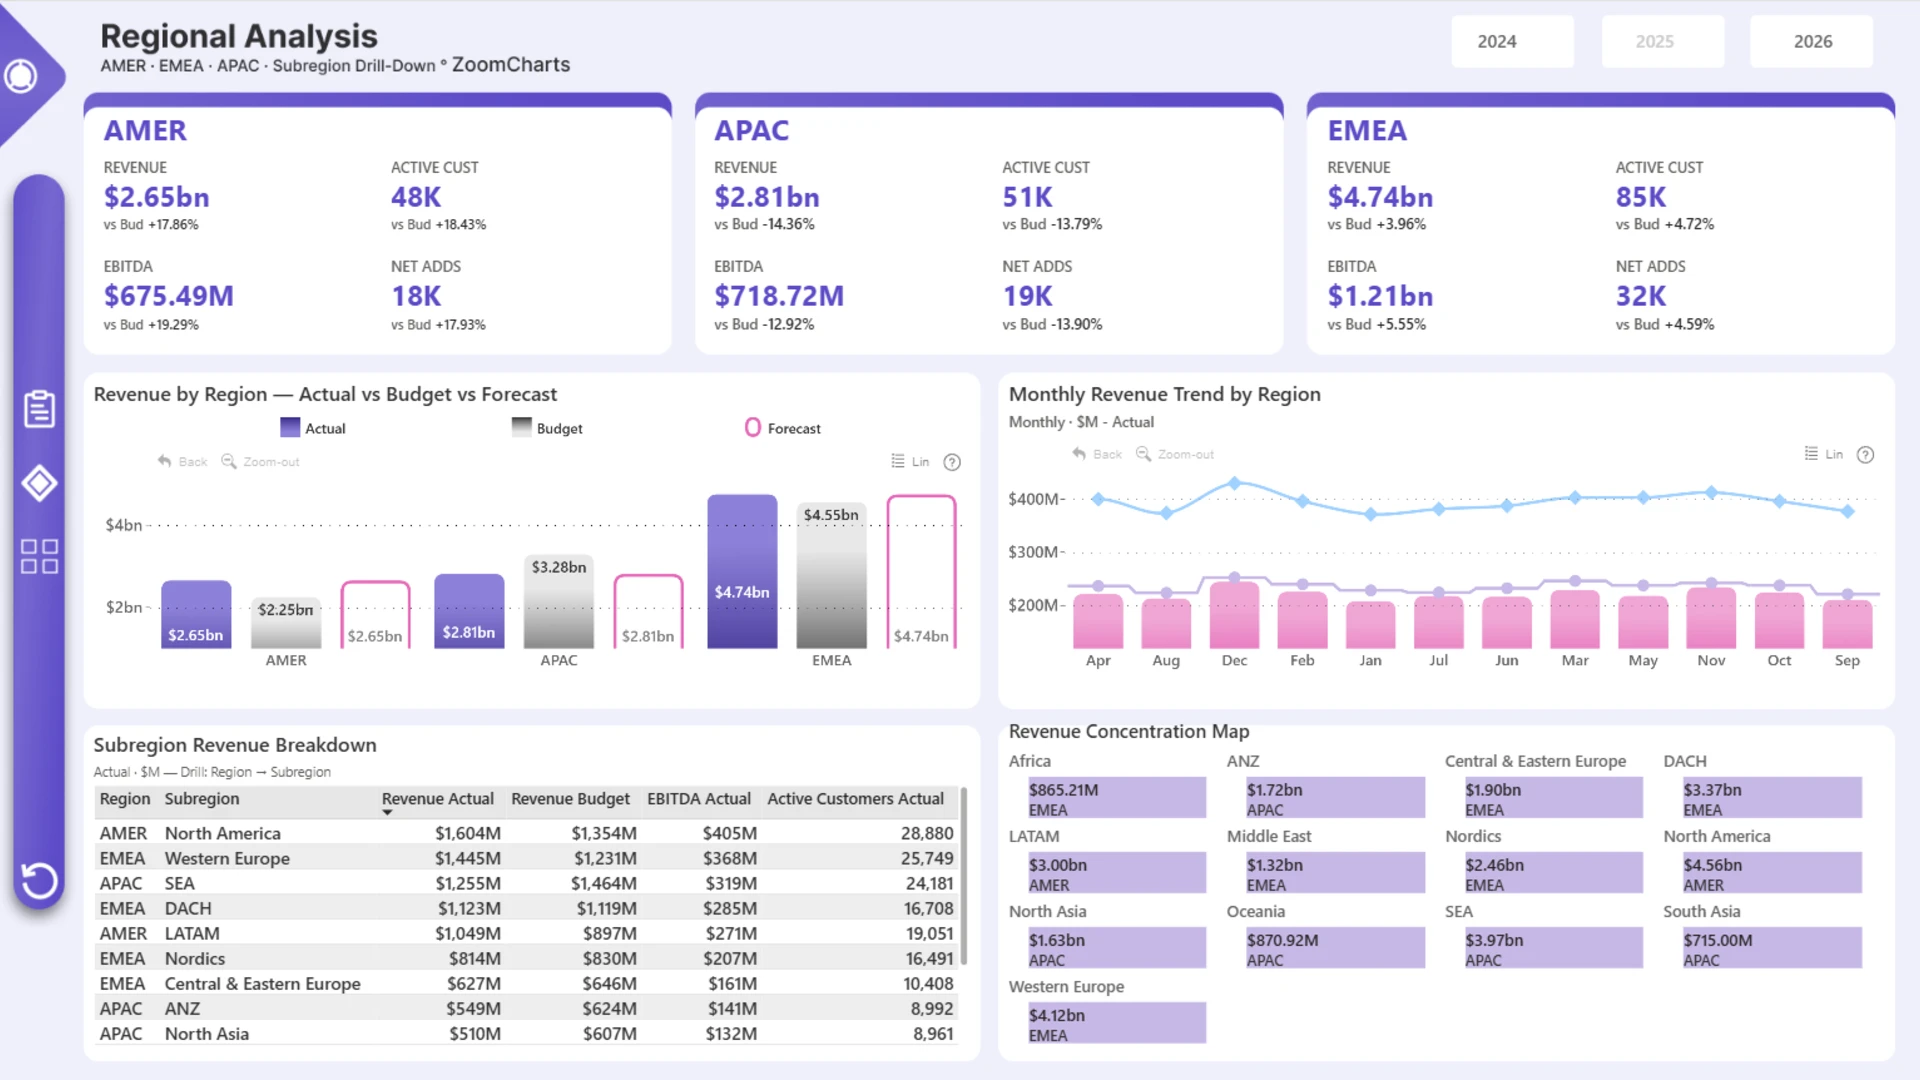
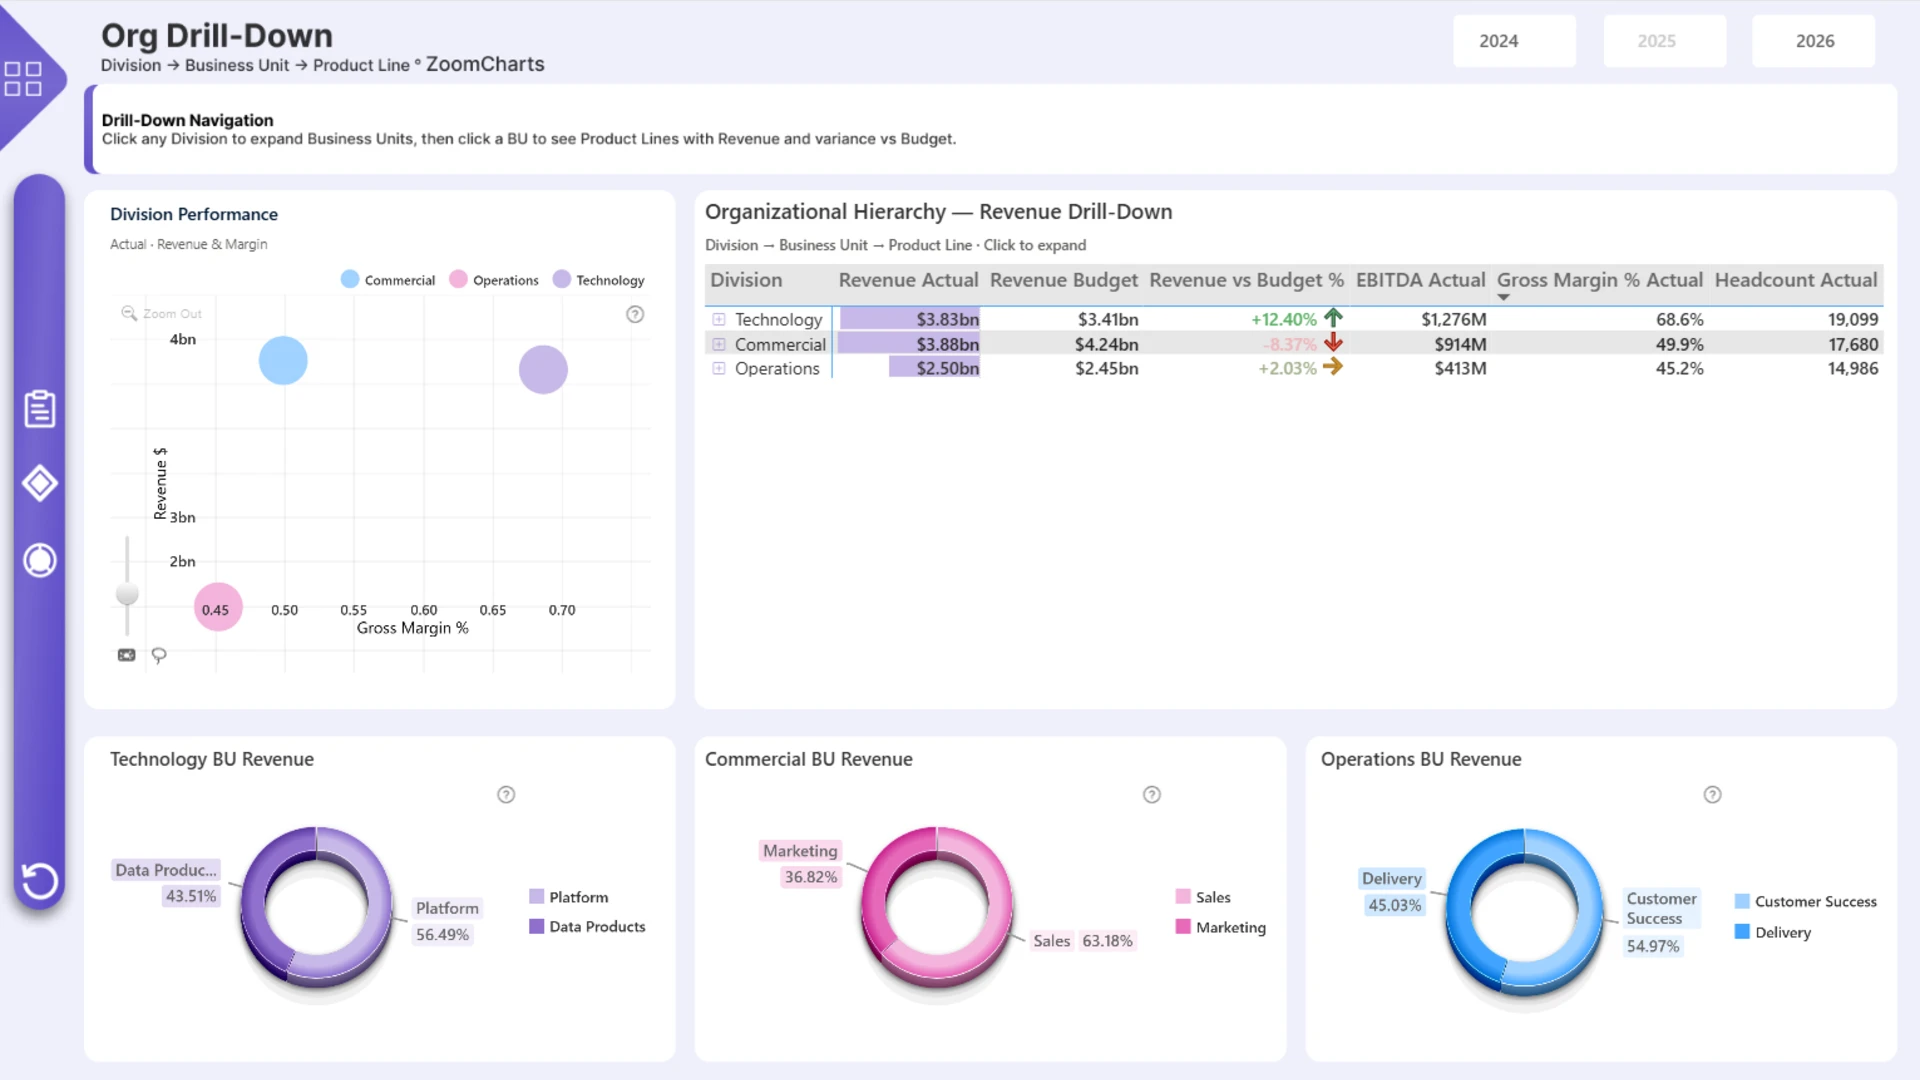
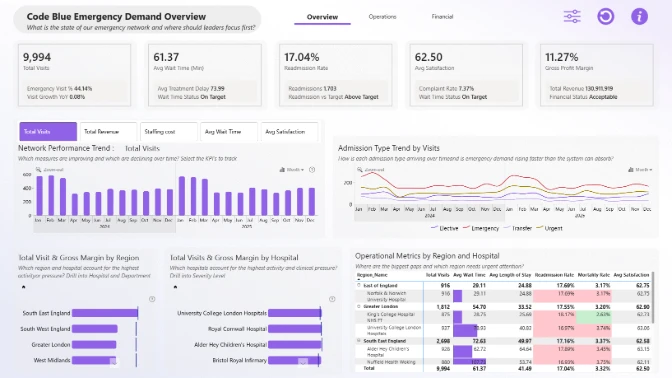
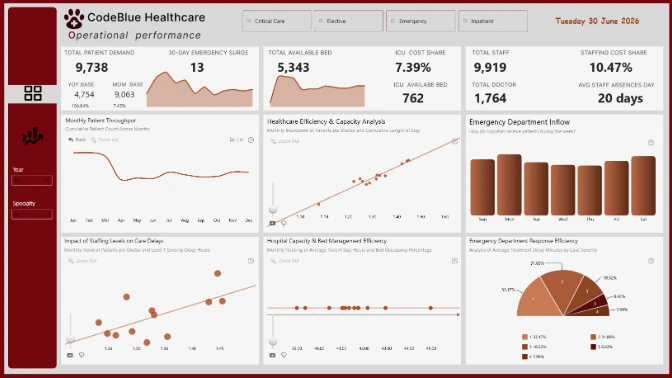
This interactive Power BI report presents an executive KPI dashboard built with ZoomCharts Drill Down custom visuals for Power BI. It highlights key metrics such as Revenue, EBITDA, Margin, Headcount, and Customer Growth, with Actual vs Budget vs Forecast comparisons, organizational drill-down, and regional performance analysis to support strategic decision-making.
The report was submitted to the ZoomCharts “4U Reports Challenge” (April 2026), using ZoomCharts Drill Down custom visuals for Power BI.
Author's Description:
An Executive KPI Report powered by ZoomCharts. This fully interactive, executive-grade report includes five pages, covering a landing page, executive summary, financial KPIs, regional analysis, and organizational drill-down. It features revenue mix, customer growth, EBITDA trends, and operational KPIs, with dynamic comparisons across Actual, Budget, and Forecast scenarios. Built with ZoomCharts custom visuals and advanced slicers, the dashboard enables smooth, intuitive exploration designed for clear, fast decision-making at the executive level.
ZoomCharts visuals used
4U Report Challenges
Participate in data challenges, build and submit reports to get free template downloads.
Join CommunityMobile view allows you to interact with the report. To Download the template please switch to desktop view.

Was this helpful? Thank you for your feedback!
Sorry about that.
How can we improve it?