73
Power BI E-Commerce Profitability Dashboard
Power BI E-Commerce Profitability Dashboard
More Report pages
Report Author: ZoomCharts
73
Share template with others
Summary
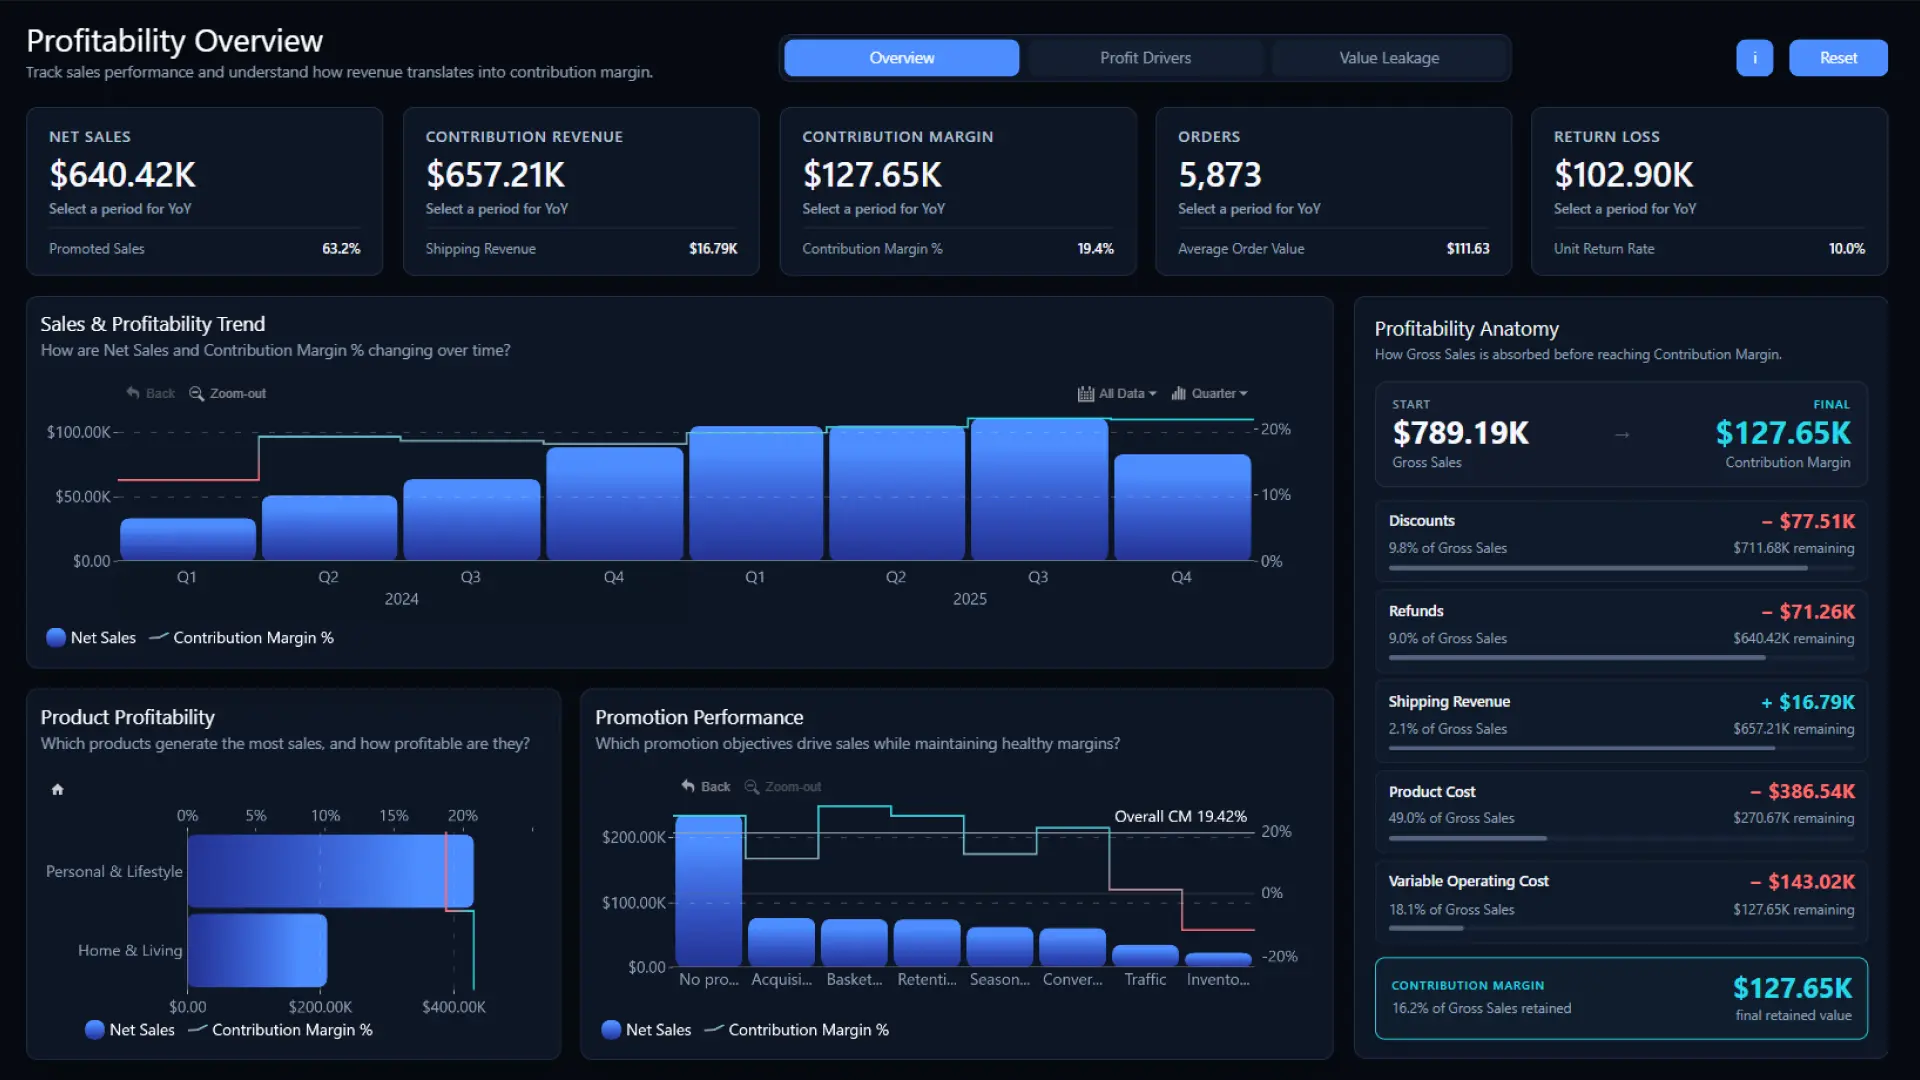
This Power BI e-commerce profitability dashboard shows how sales revenue translates into contribution margin after discounts, refunds, product costs, shipping revenue, and variable operating costs.
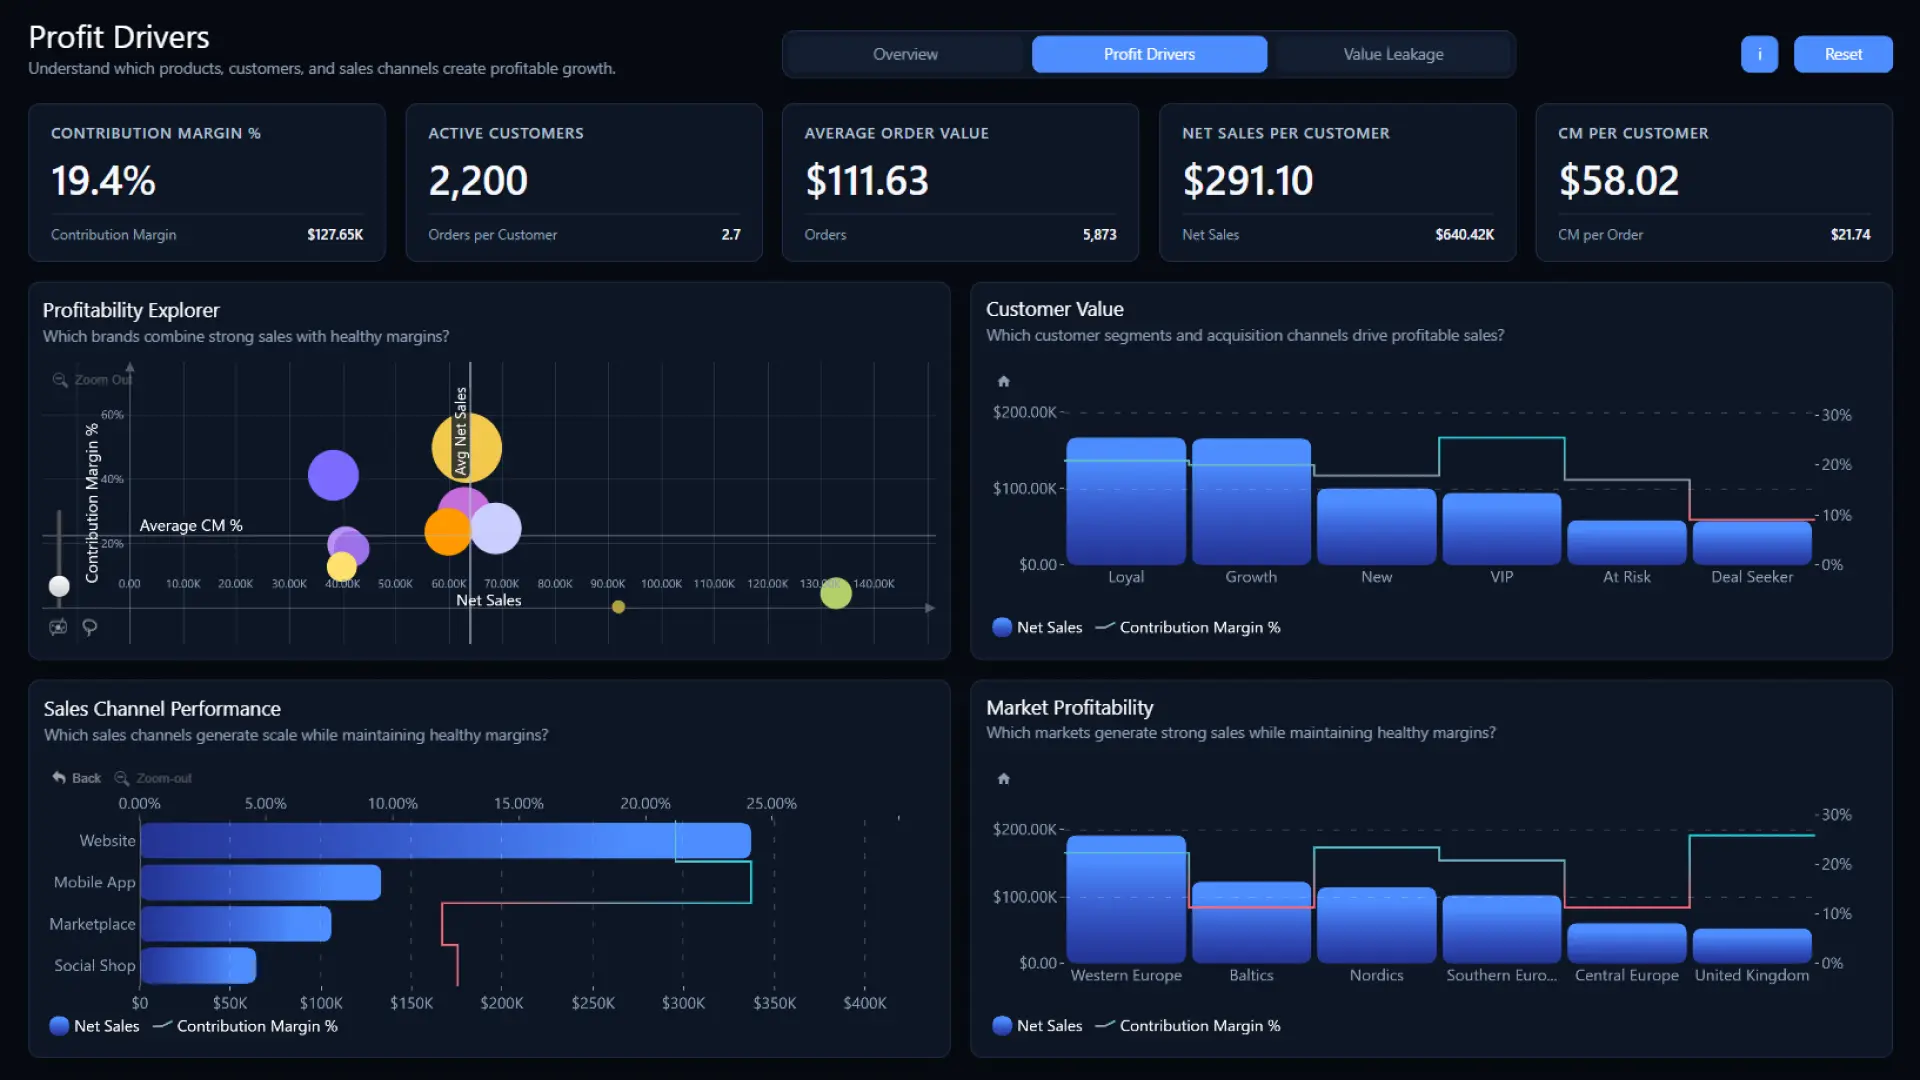
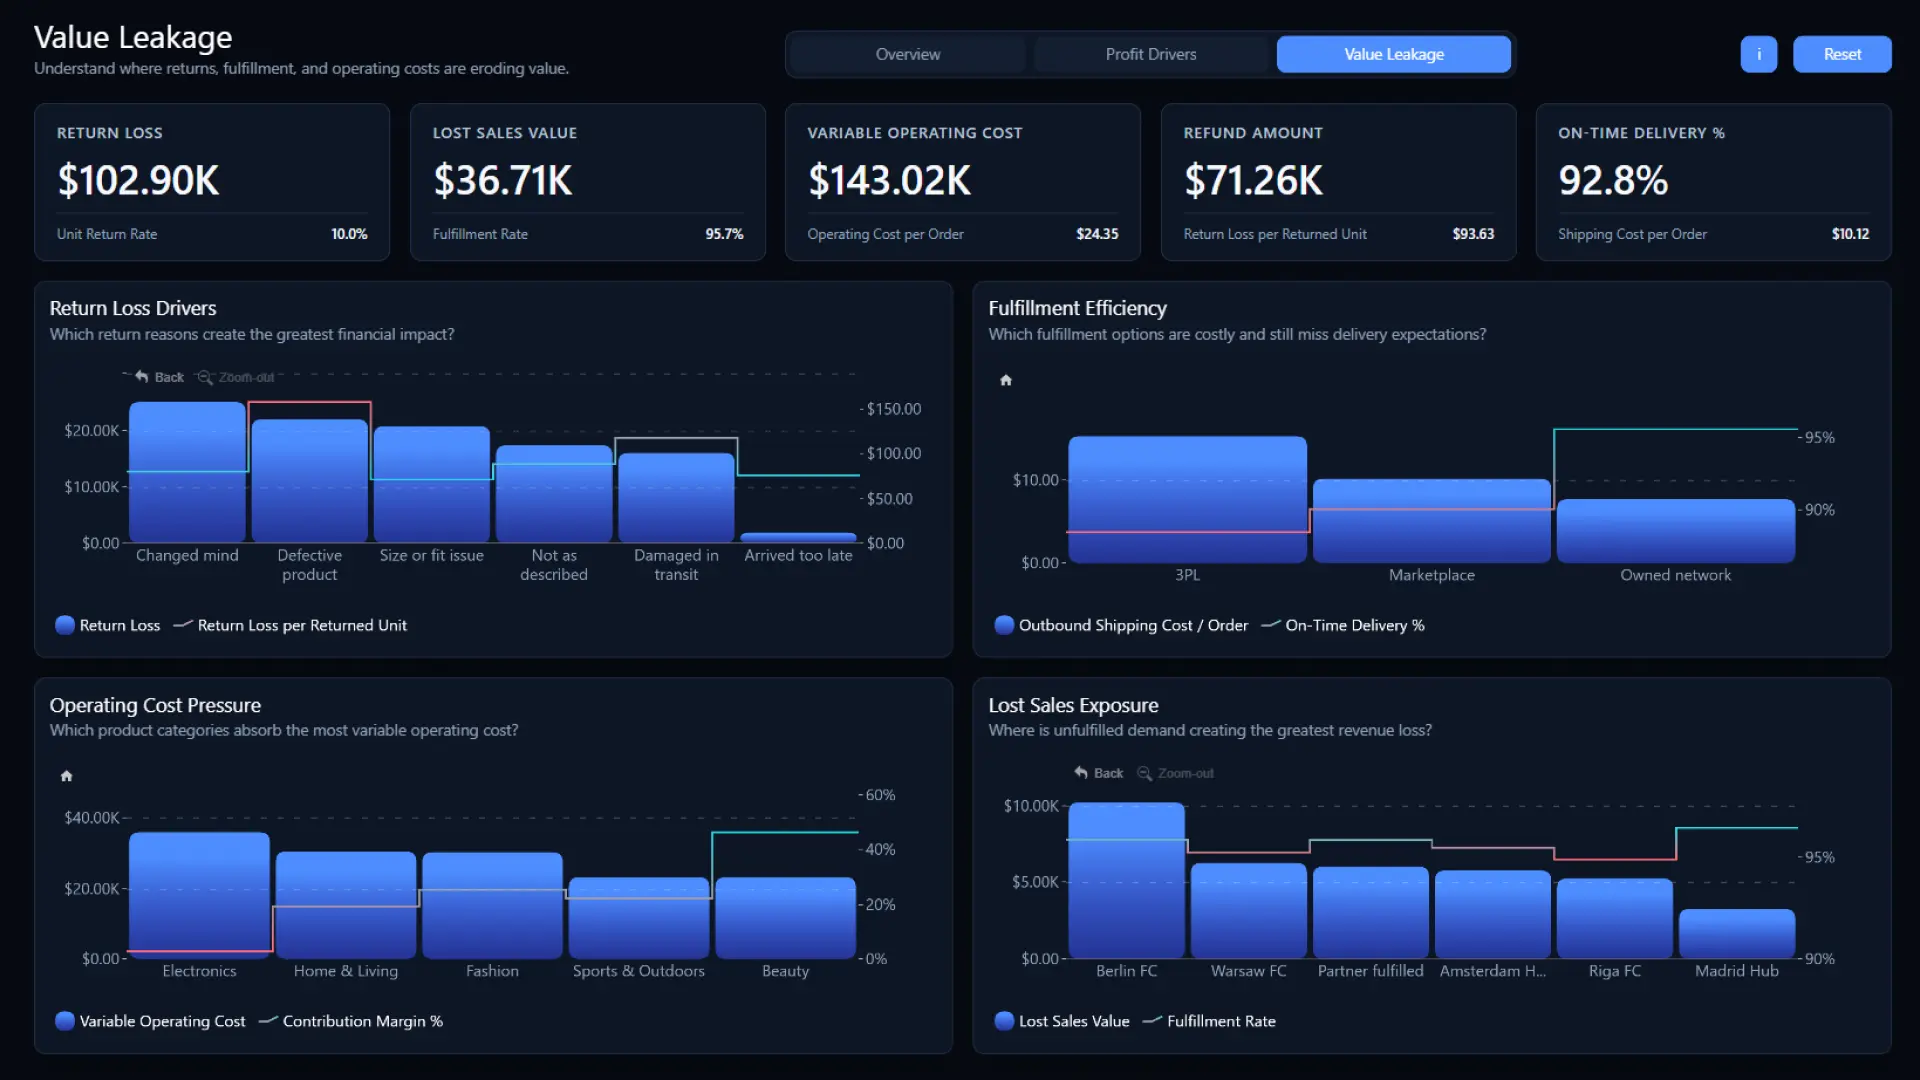
The three-page report helps users monitor profit performance, identify the products, customers, channels, and markets driving profitable growth, and understand where returns and fulfillment costs are eroding value.
Key Insights of the E-Commerce Profitability Dashboard
The report is organized into Overview, Profit Drivers, and Value Leakage pages. Key insights include:
- Sales and profitability: track net sales, contribution revenue, contribution margin, orders, average order value, promoted sales, and quarterly trends
- Profitability anatomy: follow the progression from gross sales to contribution margin through discounts, refunds, shipping revenue, product costs, and operating costs
- Profit drivers: compare profitability across brands, customer segments, acquisition channels, sales channels, and European markets
- Customer value: analyze active customers, orders per customer, net sales per customer, contribution margin per customer, and contribution margin per order
- Return losses: measure the financial impact of returns by reason, including defective products, sizing issues, shipping damage, and changed customer decisions
- Fulfillment performance: compare shipping costs and on-time delivery across third-party logistics, marketplaces, and the owned network
- Lost sales and operating costs: identify product categories and fulfillment locations associated with higher costs or unfulfilled demand
Interactive charts combine sales and cost values with contribution margin, fulfillment, and delivery percentages, making it easier to compare financial scale with operational efficiency.
How to Use This E-Commerce Profitability Dashboard
Use the navigation tabs to move between the Overview, Profit Drivers, and Value Leakage pages. Click chart elements to filter related visuals, use Ctrl + click to make multiple selections, long-click to drill down, or click and drag to explore a selected area.
Apply the available date and quarter controls to review specific periods. Select the information button for interaction guidance, or use Reset to clear all filters and return the report to its initial view.
ZoomCharts visuals used




4U Report Challenges
Participate in data challenges, build and submit reports to get free template downloads.
Join CommunityMobile view allows you to interact with the report. To Download the template please switch to desktop view.
How to use a PBIX template
Preview the interactive report, download the PBIX file, open it in Power BI Desktop, and replace the same data connection with your own dataset.
Preview and download
Explore the report online and download the PBIX template file.
Open in Power BI Desktop
Open the downloaded PBIX file in Power BI Desktop.
Connect your data
Replace the sample data source with your own dataset.
Refresh and adjust
Refresh the model and update fields or visual were needed.
Save and share
Save your report and publish it for your audience.


