392
Power BI E-commerce Performance Tracker Dashboard
Power BI E-commerce Performance Tracker Dashboard
More Report pages
Report Author: Agbata Dickson Ukolojo
392
Share template with others
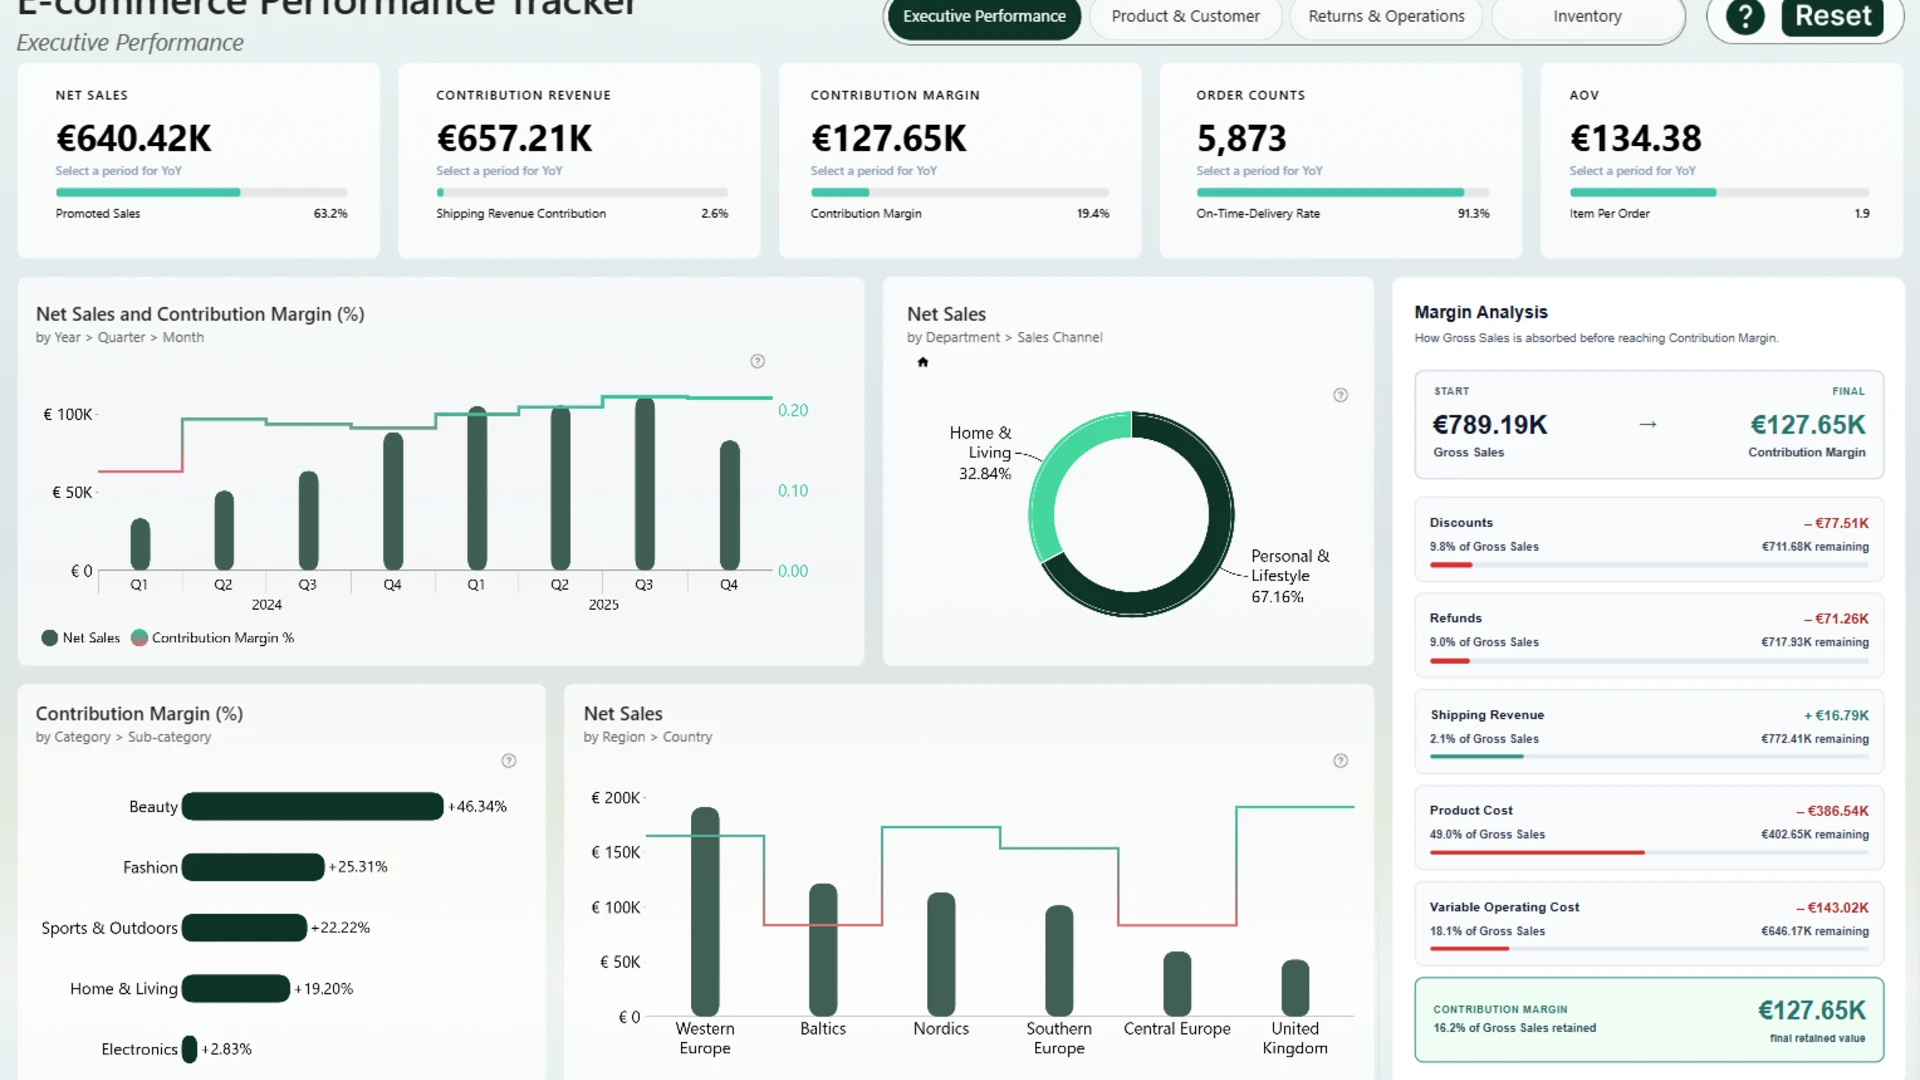
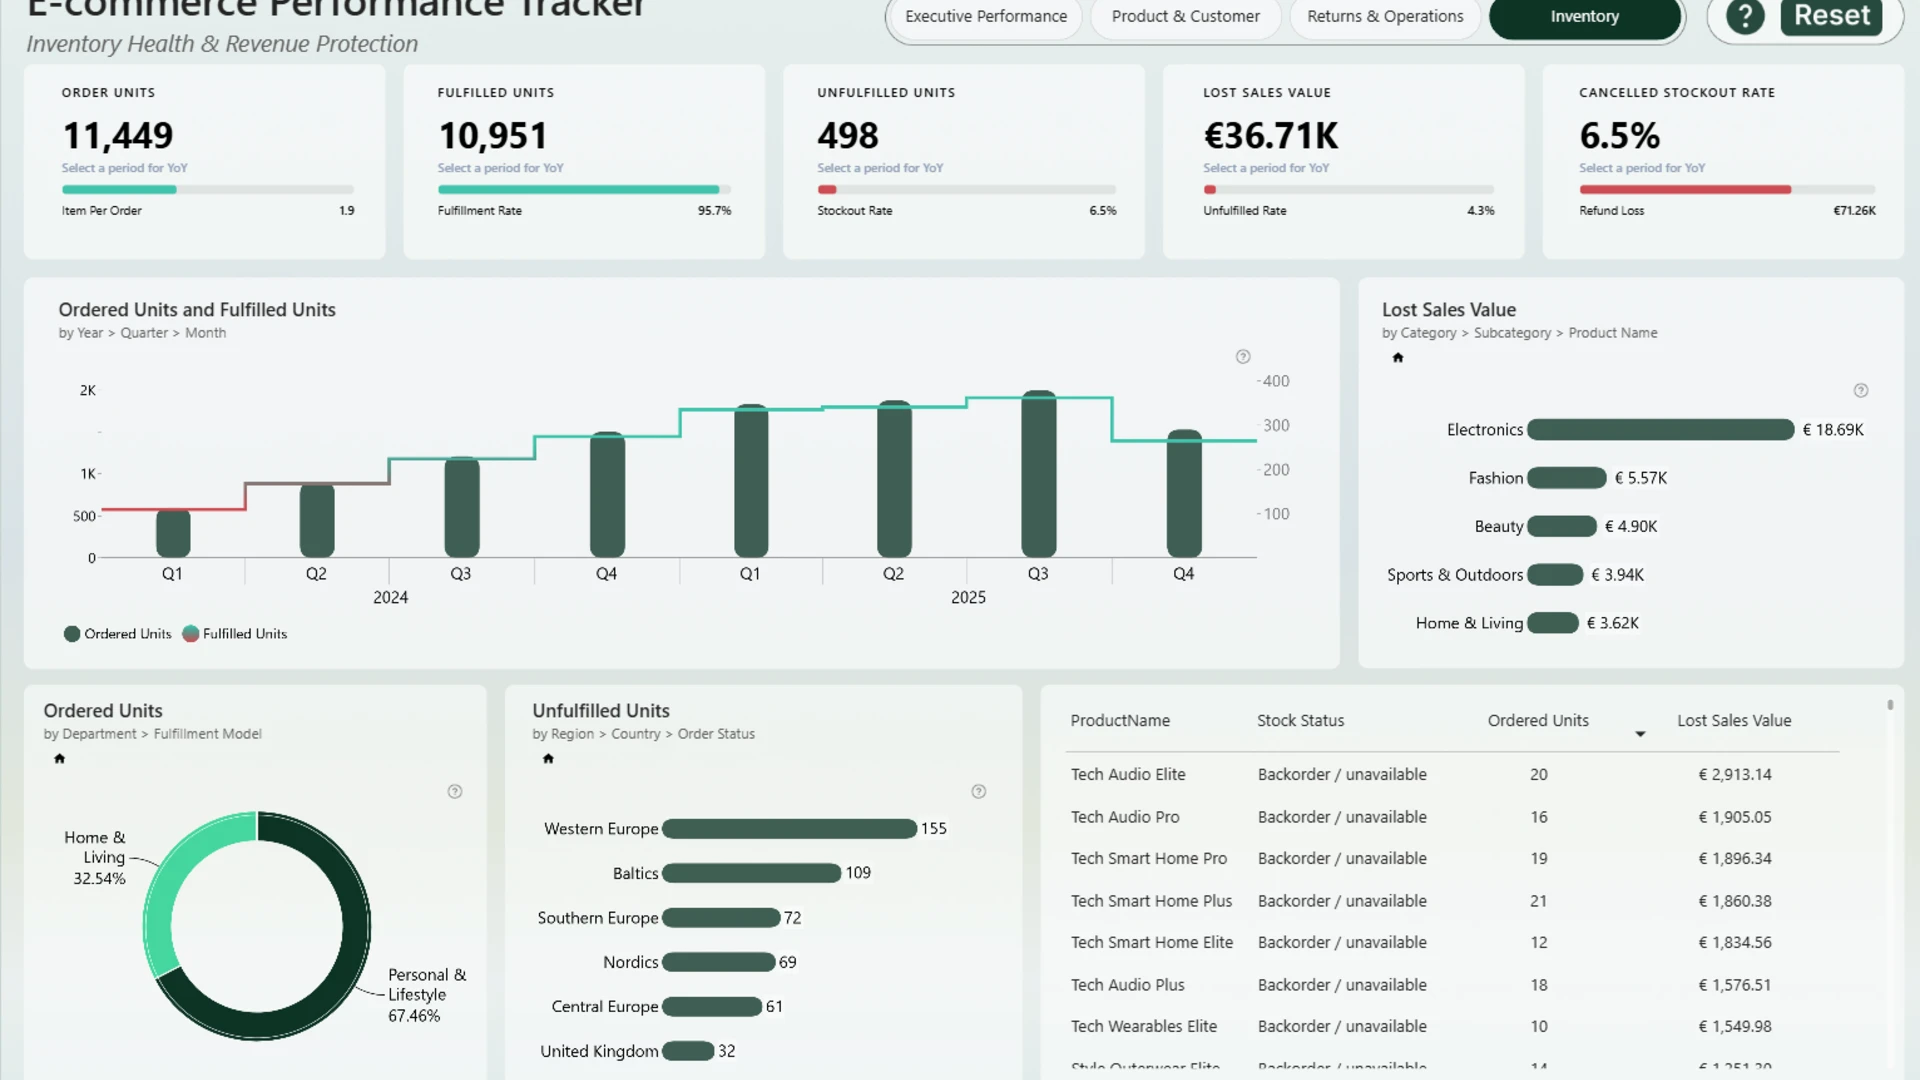
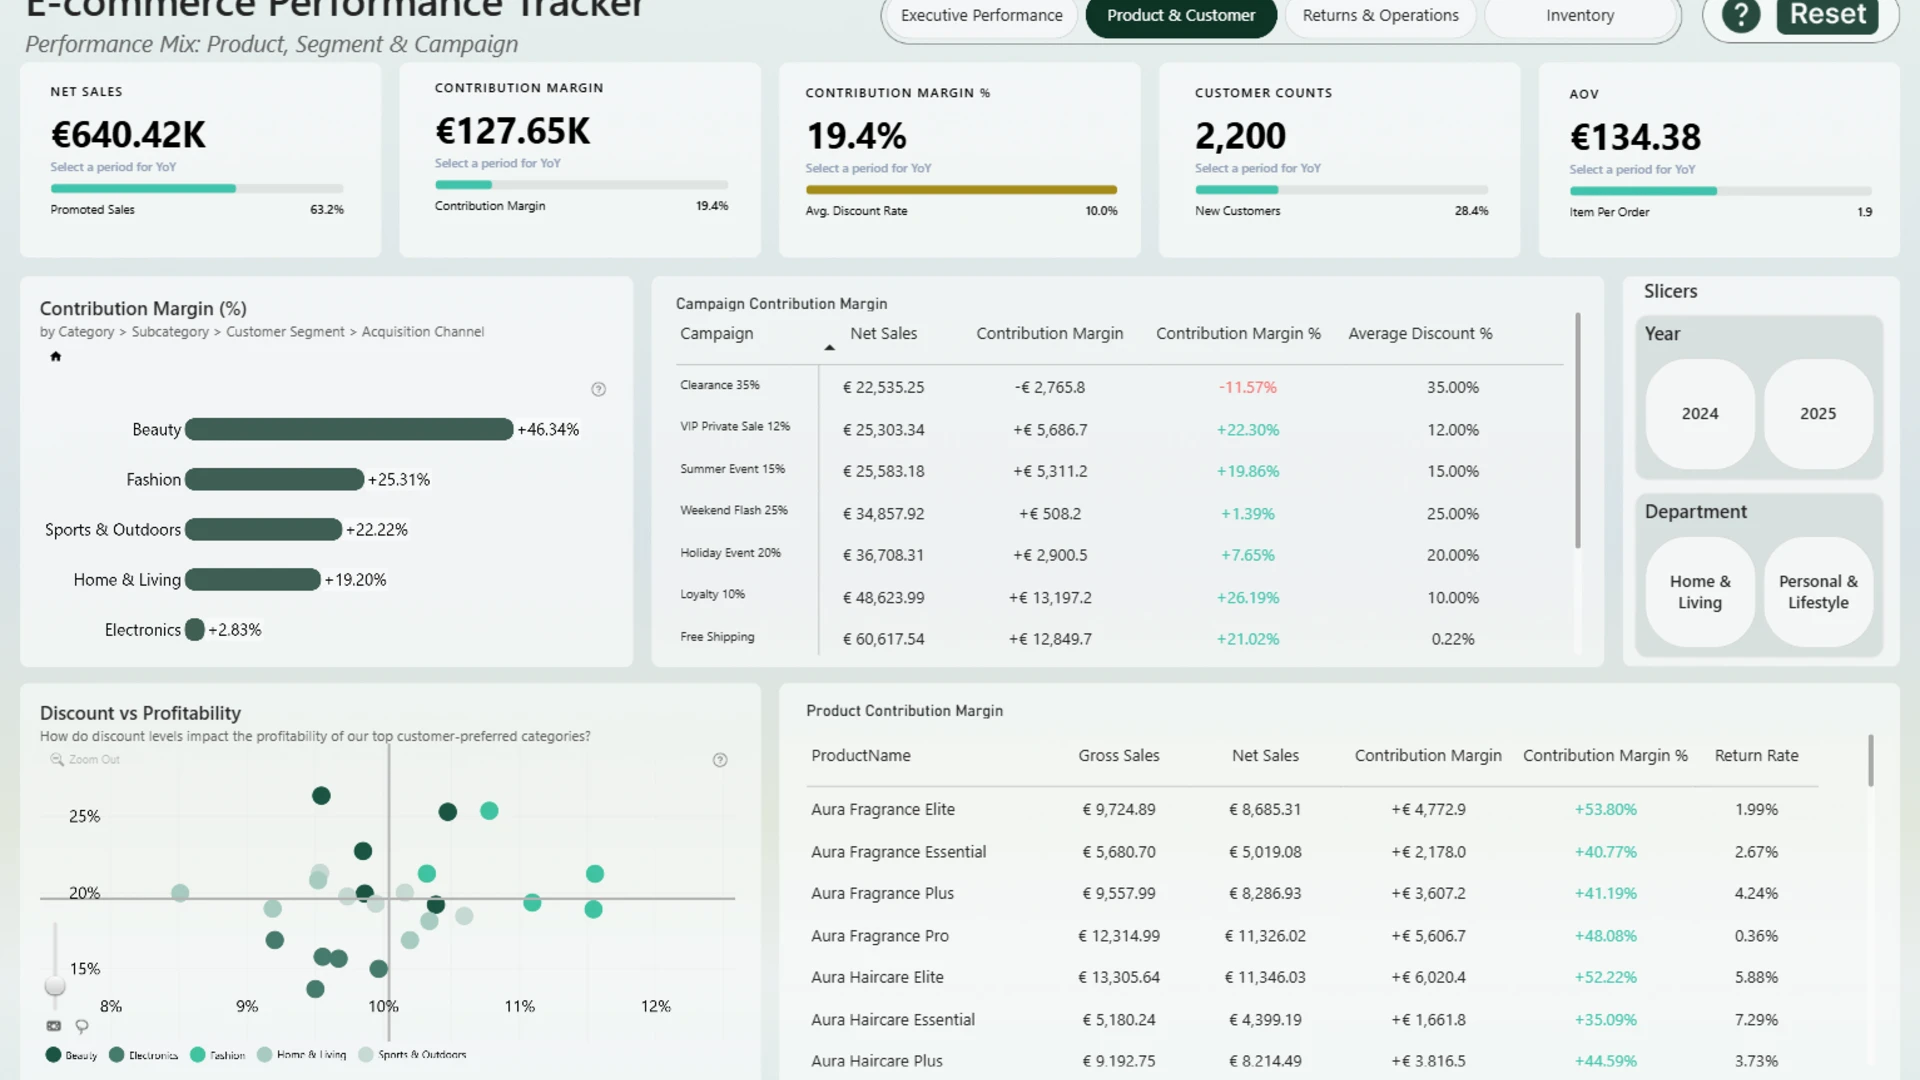
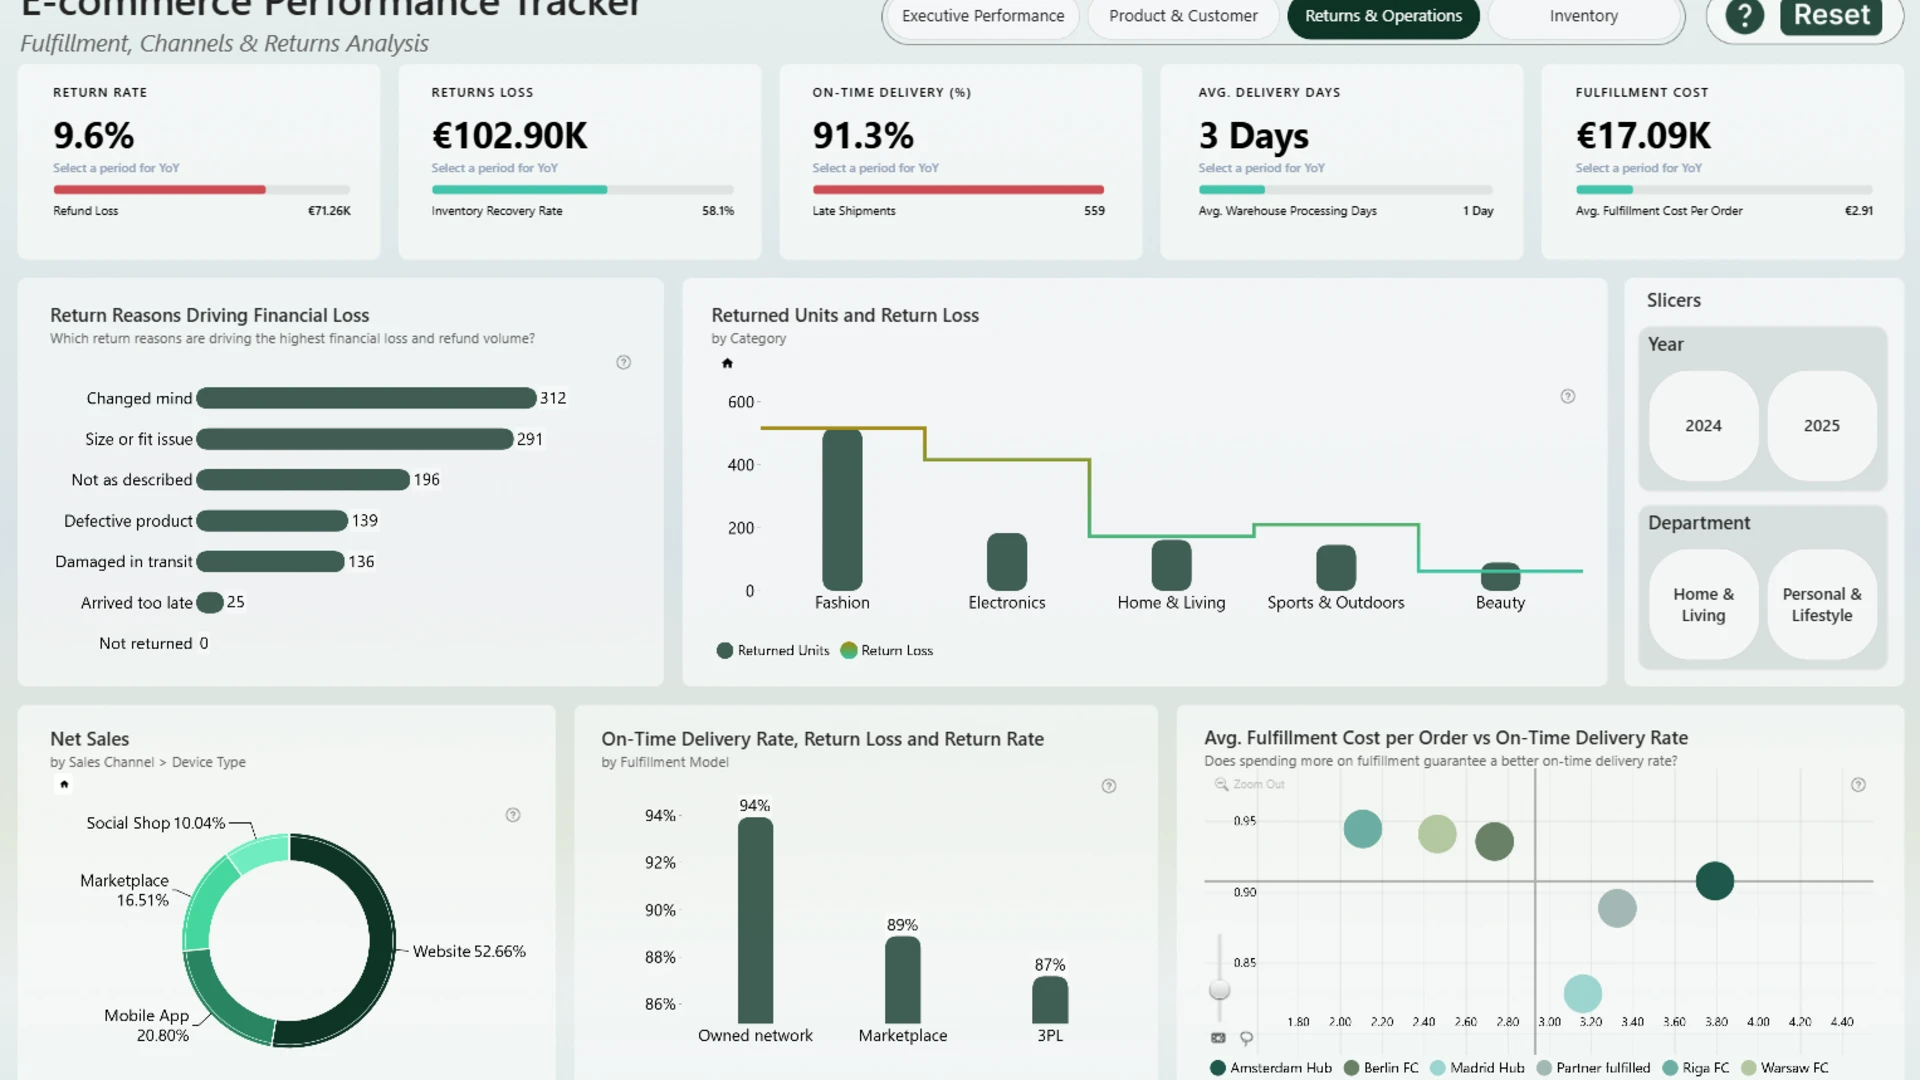
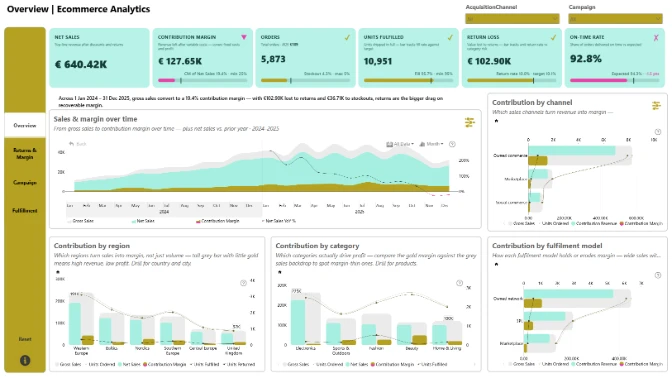
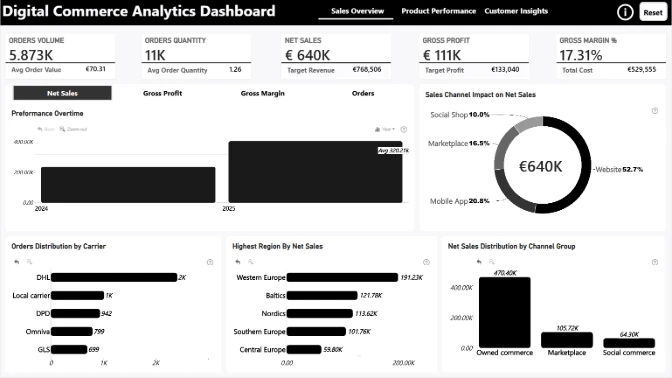
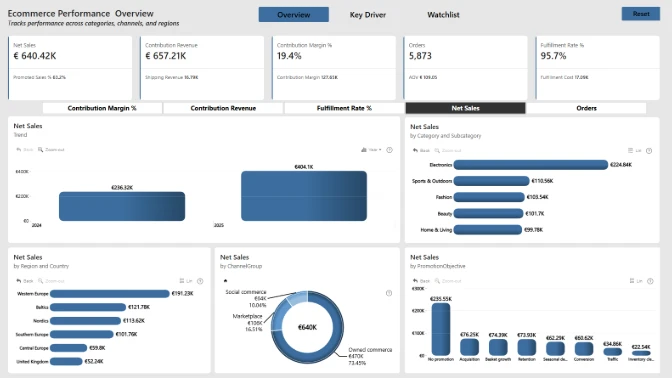
This interactive Power BI dashboard analyzes e-commerce profitability across sales, customers, promotions, returns, fulfillment, and inventory. It helps business leaders understand revenue and margin performance, customer behavior, and promotion effectiveness. The report also highlights operational costs, delivery performance, returns, stock availability, and potential revenue leakage. The goal is to turn transactional data into clear insights that support better commercial and operational decisions.
ZoomCharts visuals used





4U Report Challenges
Participate in data challenges, build and submit reports to get free template downloads.
Join CommunityMobile view allows you to interact with the report. To Download the template please switch to desktop view.
How to use a PBIX template
Preview the interactive report, download the PBIX file, open it in Power BI Desktop, and replace the same data connection with your own dataset.
Preview and download
Explore the report online and download the PBIX template file.
Open in Power BI Desktop
Open the downloaded PBIX file in Power BI Desktop.
Connect your data
Replace the sample data source with your own dataset.
Refresh and adjust
Refresh the model and update fields or visual were needed.
Save and share
Save your report and publish it for your audience.


