121
Power BI E-commerce KPI and Margin Dashboard
Power BI E-commerce KPI and Margin Dashboard
More Report pages
Report Author: Abigail Adeleye
121
Share template with others
This three-page Power BI dashboard provides a clear view of e-commerce performance across customer acquisition, sales, customer experience, and inventory availability.
The report goes beyond sales totals to show who the customers are, how they are acquired, how their value develops over time, how effectively orders are fulfilled, and where stock limitations are leading to missed sales opportunities.
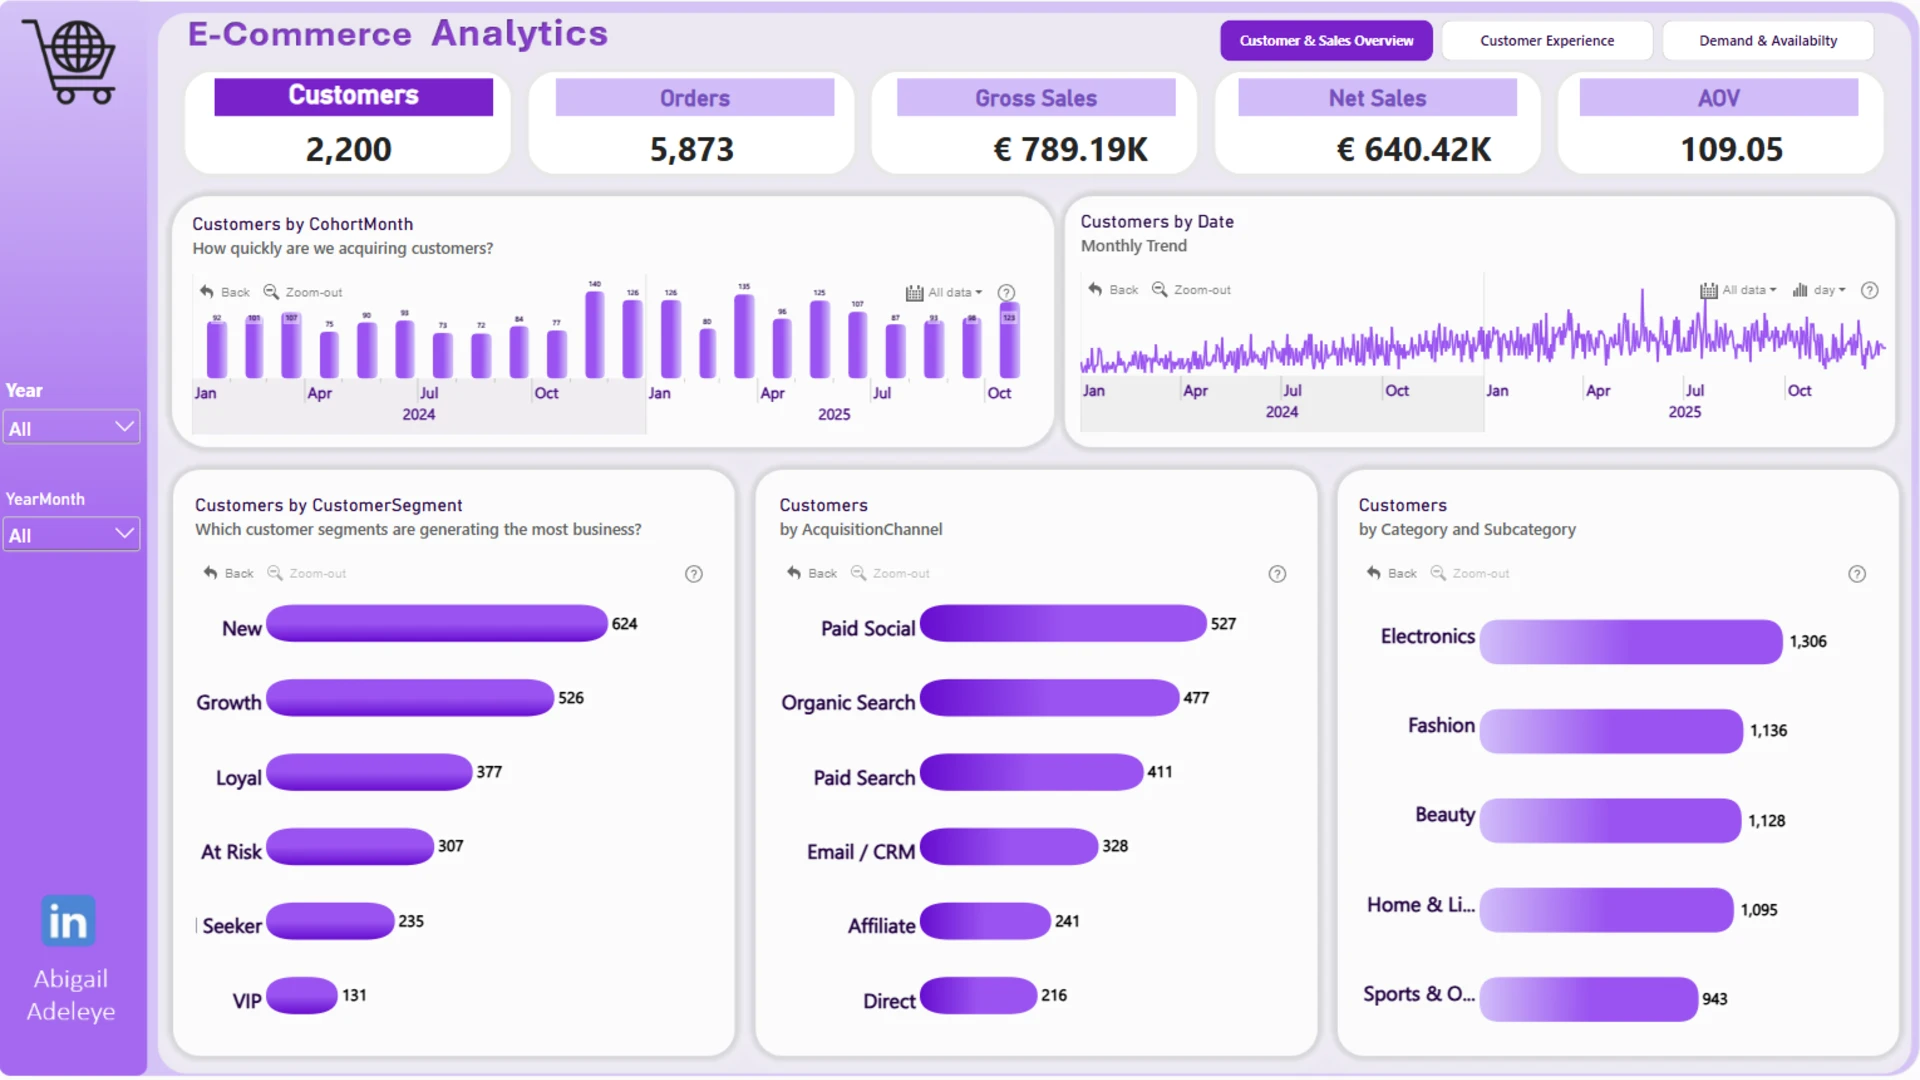
Page 1: Customer & Sales Overview
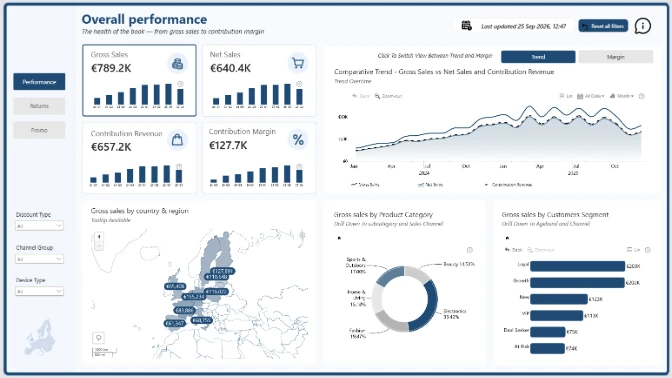
The first page focuses on customer acquisition and sales performance. It covers customer segments, acquisition channels, product categories, order activity, and overall sales results.
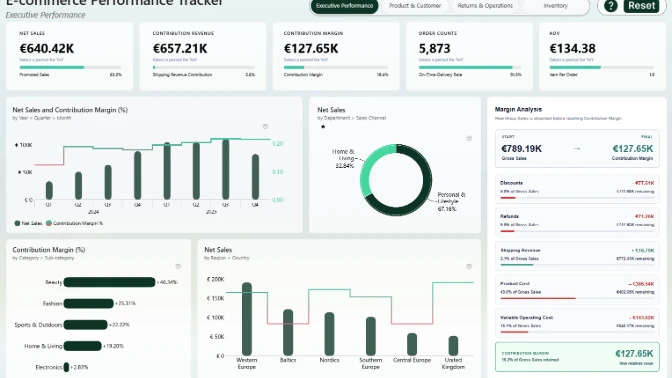
At the business level, 2,200 customers generated 5,873 orders, resulting in €789.19K in gross sales and €640.42K in net sales. Average order value is €109.05.
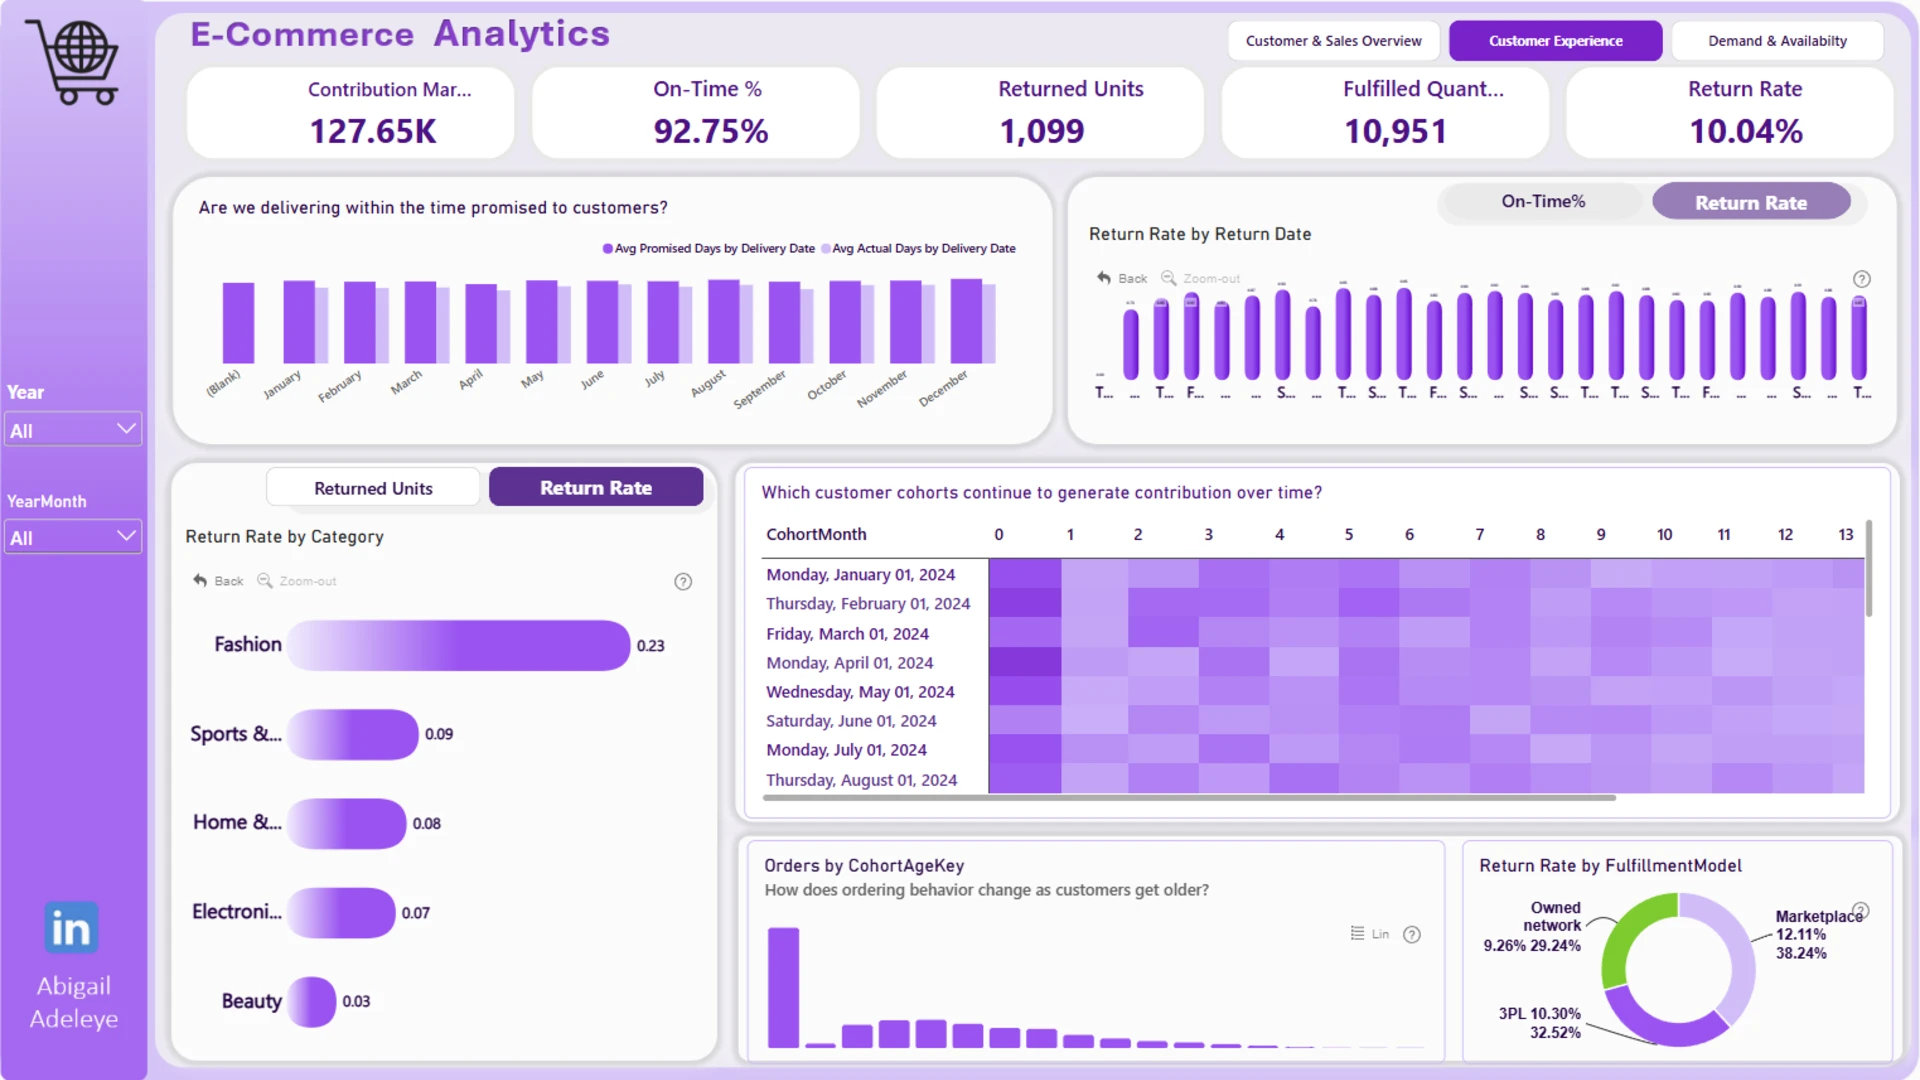
Page 2: Customer Experience
The second page looks at customer experience and profitability. It combines contribution margin, delivery performance, returns, ordering behaviour, and customer cohort analysis to show how different customer groups contribute over time.
This page helps identify whether customer value is being maintained after acquisition and where delivery or return issues may be affecting overall performance.
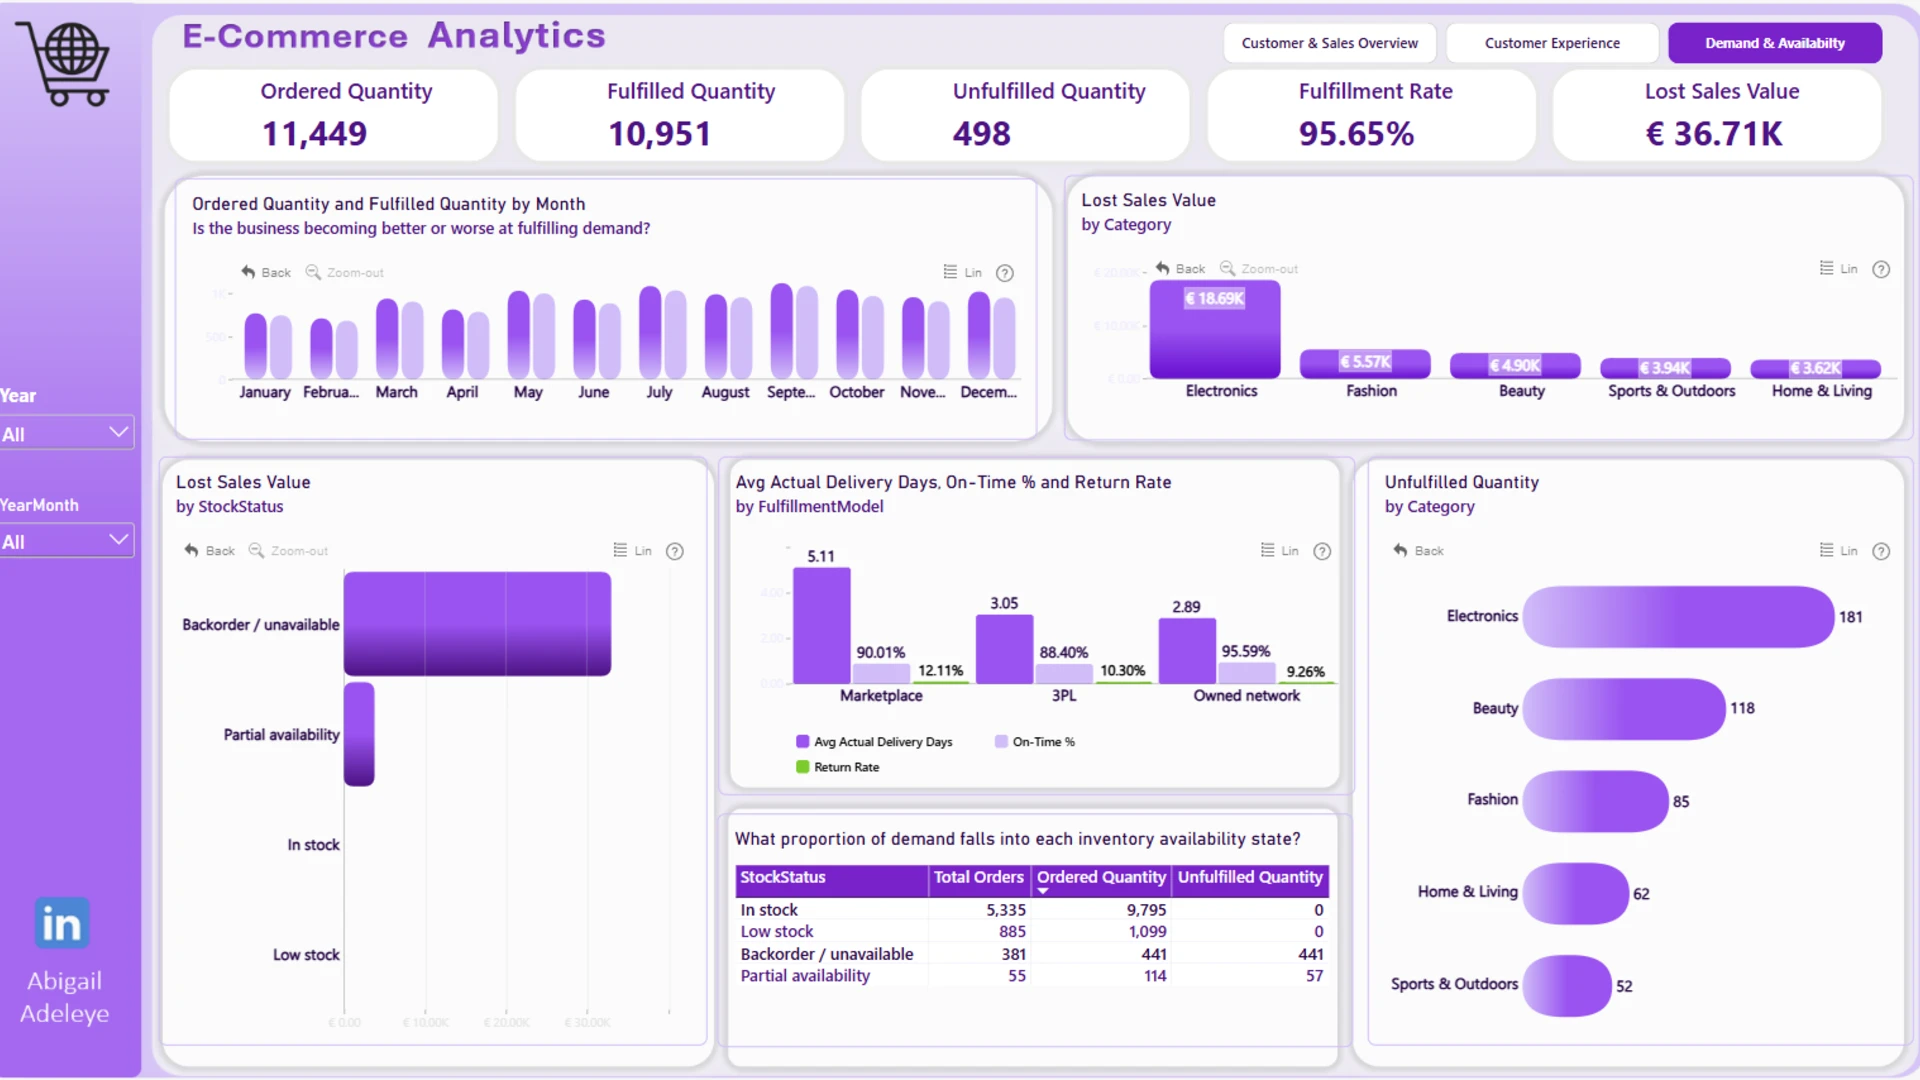
Page 3: Demand & Availability
The final page focuses on demand, fulfilment, and inventory availability. It compares ordered and fulfilled quantities, fulfilment rates, unfulfilled demand, lost sales, stock status, and different fulfilment models.
This makes it easier to see where inventory constraints are limiting sales and which parts of the business are experiencing the biggest gaps between customer demand and available stock.
Overall, the dashboard connects customer, sales, operational, and inventory metrics in one report, helping users understand both business performance and the factors behind it.
ZoomCharts visuals used




4U Report Challenges
Participate in data challenges, build and submit reports to get free template downloads.
Join CommunityMobile view allows you to interact with the report. To Download the template please switch to desktop view.
How to use a PBIX template
Preview the interactive report, download the PBIX file, open it in Power BI Desktop, and replace the same data connection with your own dataset.
Preview and download
Explore the report online and download the PBIX template file.
Open in Power BI Desktop
Open the downloaded PBIX file in Power BI Desktop.
Connect your data
Replace the sample data source with your own dataset.
Refresh and adjust
Refresh the model and update fields or visual were needed.
Save and share
Save your report and publish it for your audience.


