238
Power BI Destination Analytics Dashboard
Power BI Destination Analytics Dashboard
More Report pages
Report Author: Safa Adnan
238
Share template with others
Key Features & Insights
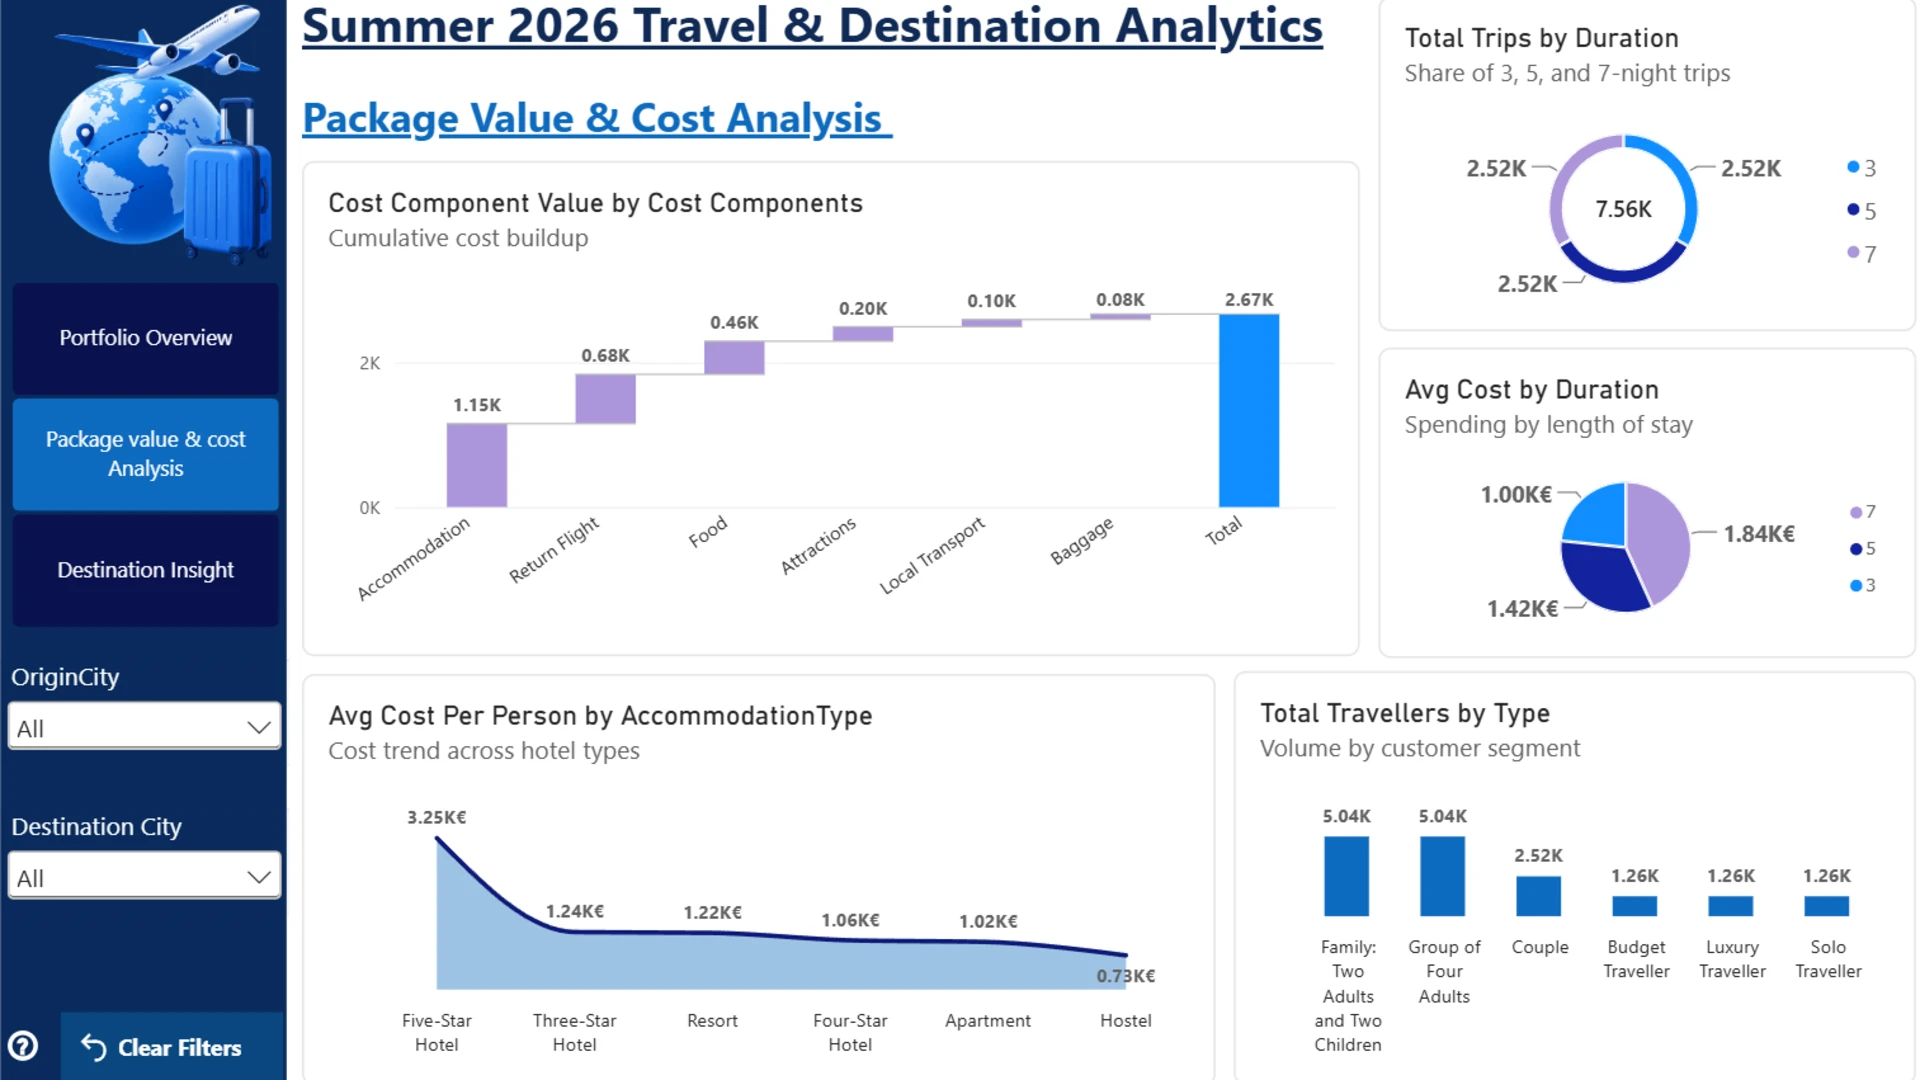
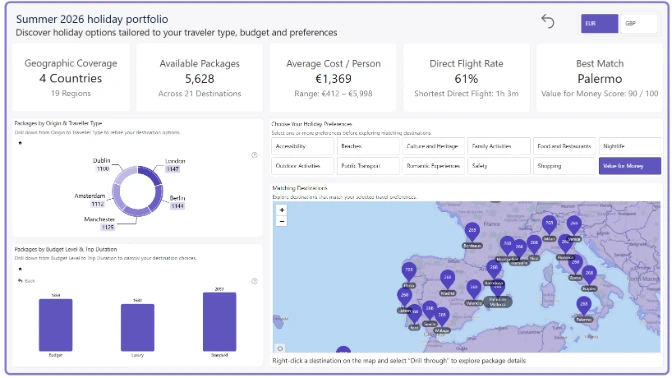
Interactive Navigation: ZoomCharts Drill Down Visuals make it easy to explore the data and cross-filter between visuals.
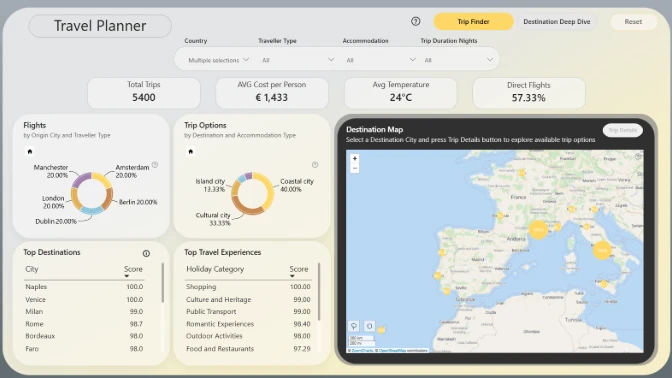
In-Report Guidance: Each page includes an Info (?) icon explaining the page objective, key metrics, and how to interact with the visuals.
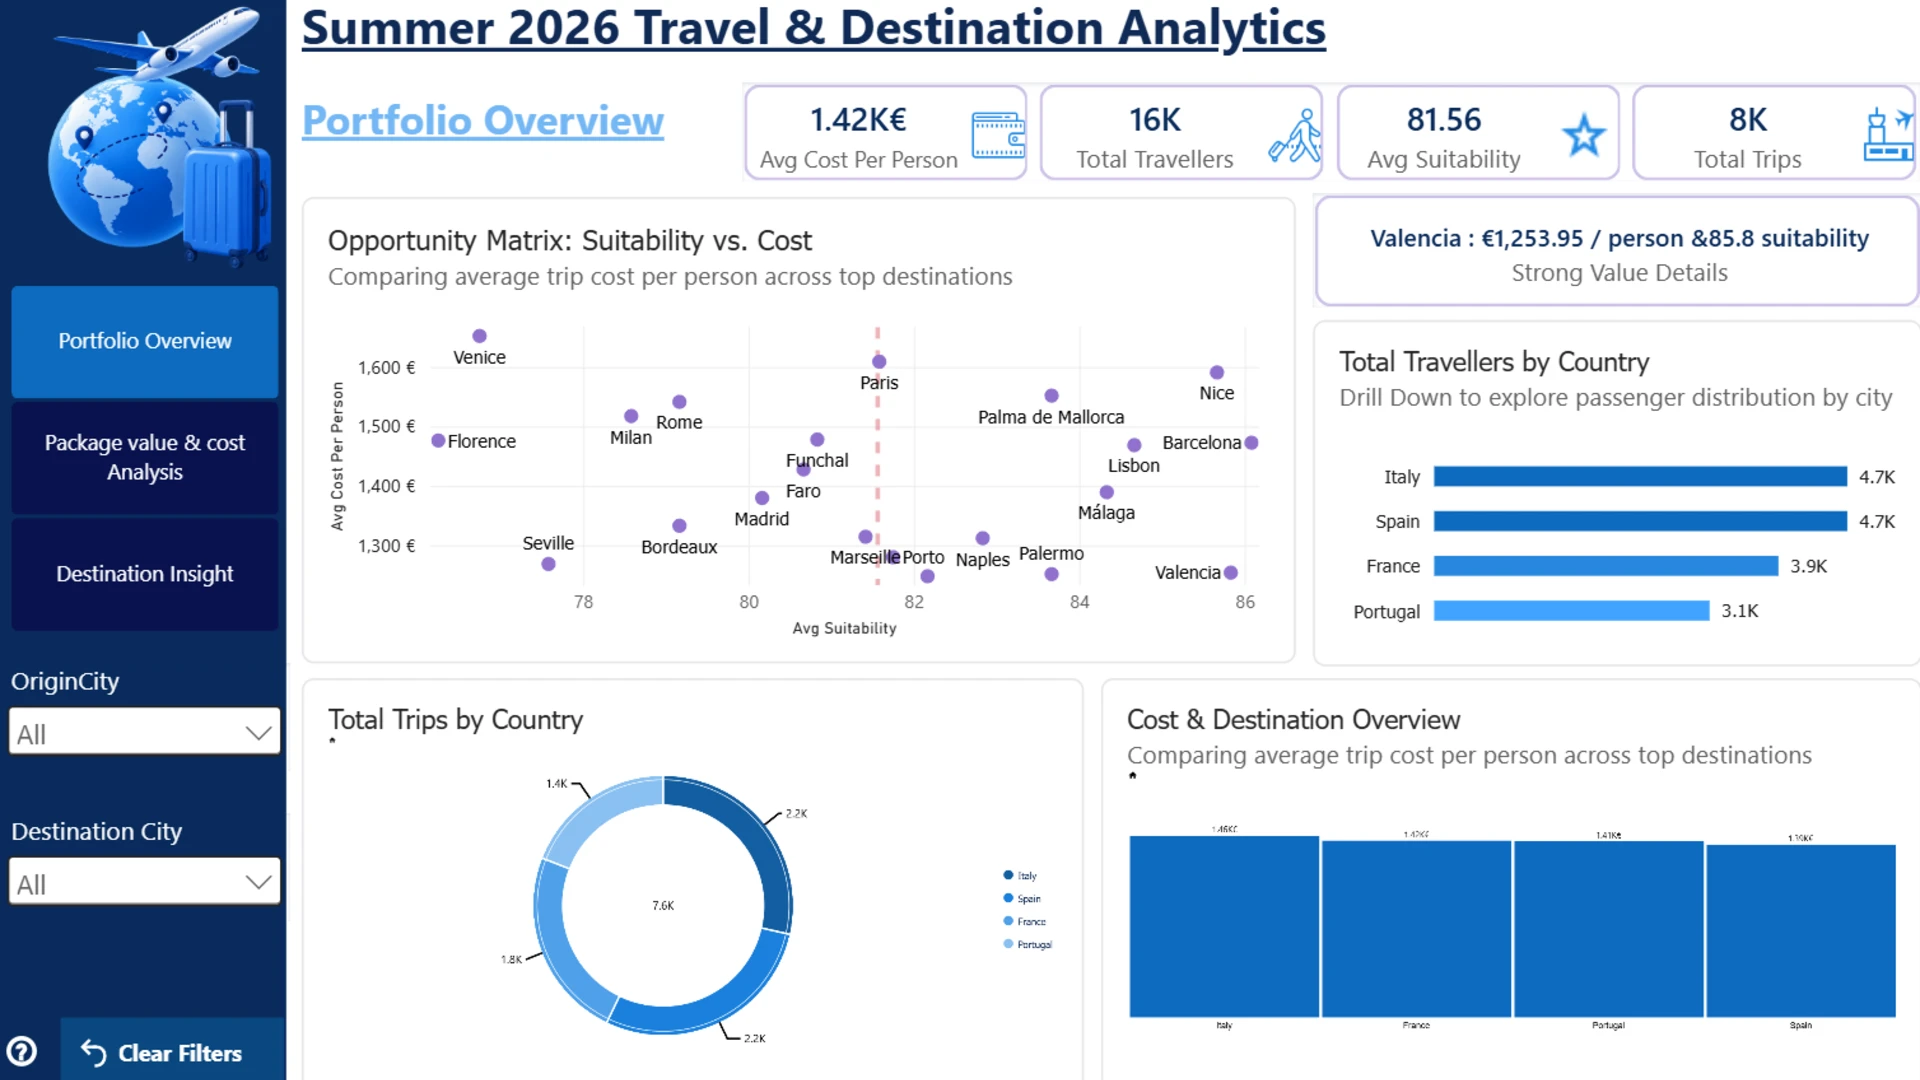
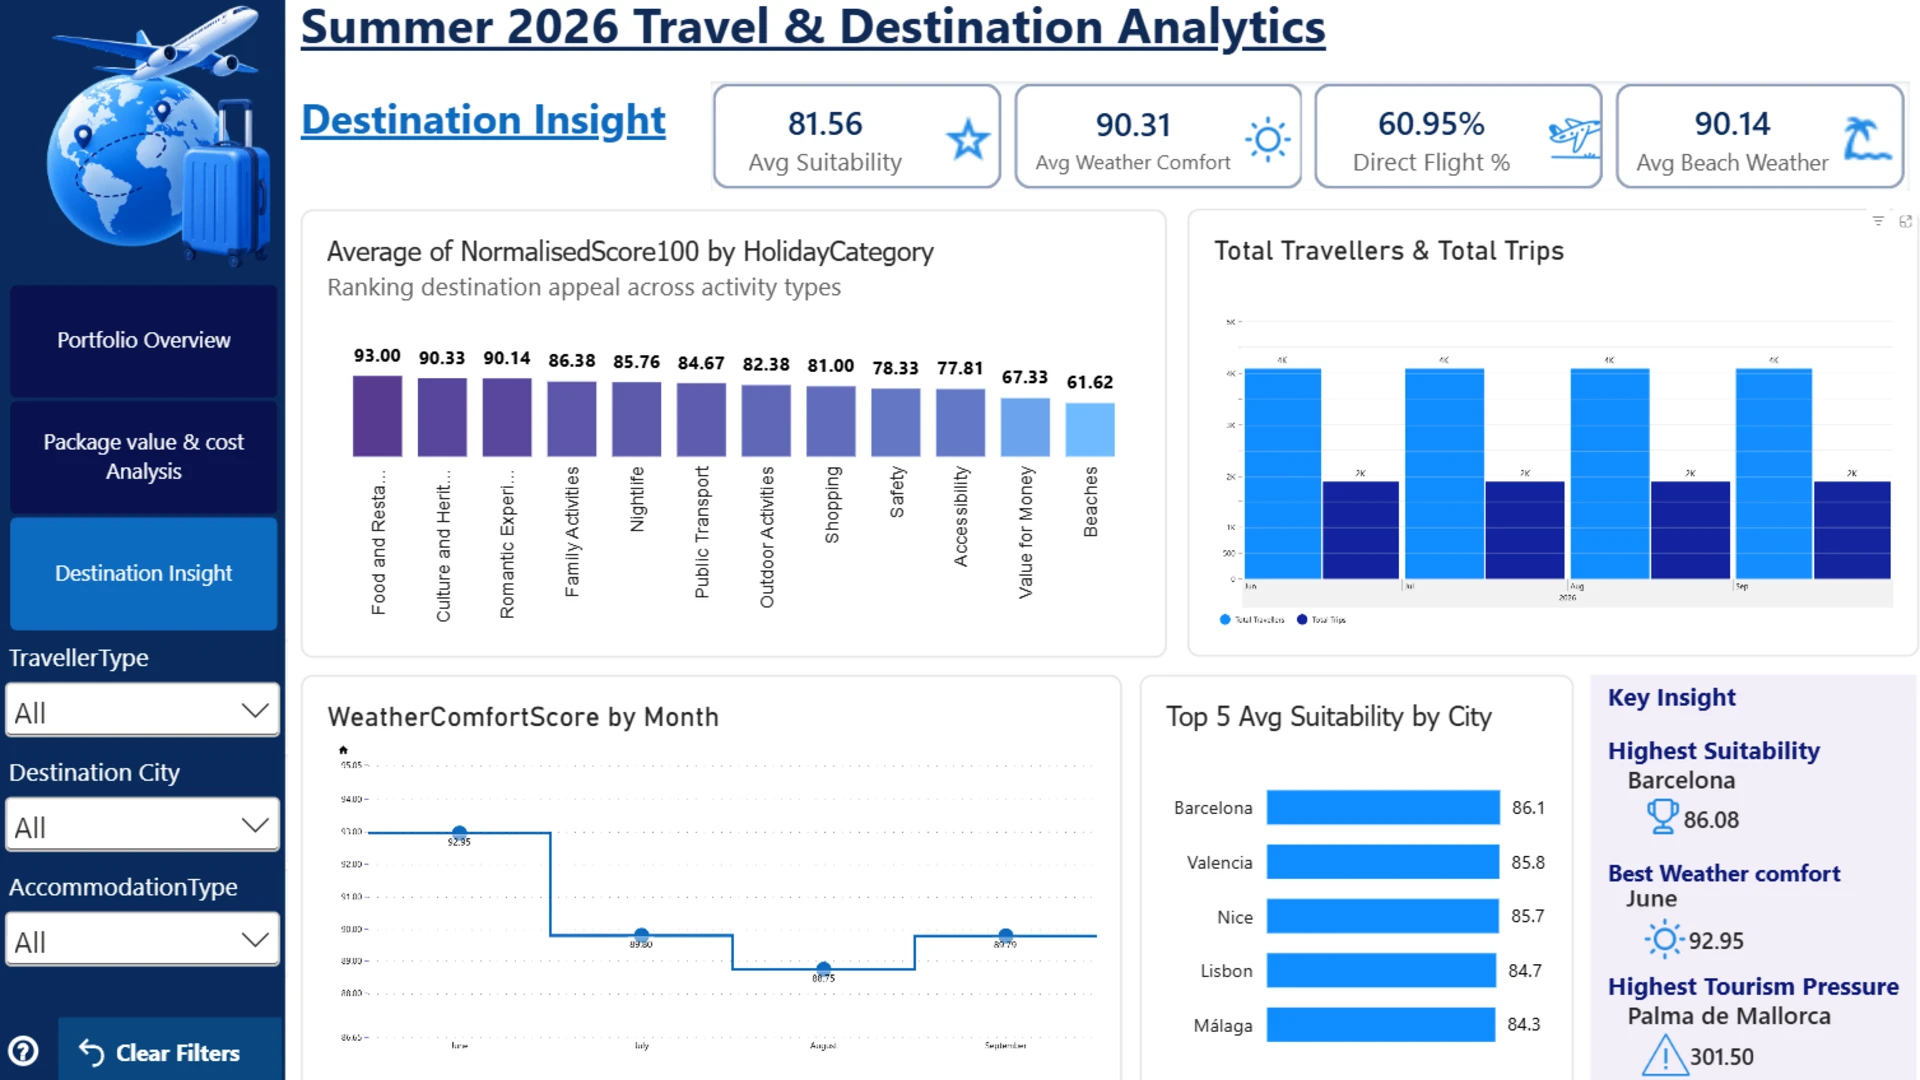
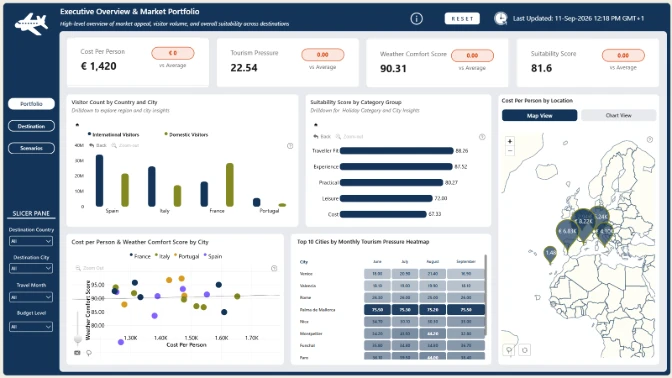
Destination Suitability: Compare destinations across different holiday categories and identify the cities that best match specific travel preferences.
Seasonality & Weather: Explore weather comfort scores together with monthly travel trends to understand how destination suitability changes throughout the summer.
Detailed Tooltips: Visual tooltips provide additional metrics and context without overcrowding the main report pages.



4U Report Challenges
Participate in data challenges, build and submit reports to get free template downloads.
Join CommunityMobile view allows you to interact with the report. To Download the template please switch to desktop view.
How to use a PBIX template
Preview the interactive report, download the PBIX file, open it in Power BI Desktop, and replace the same data connection with your own dataset.
Preview and download
Explore the report online and download the PBIX template file.
Open in Power BI Desktop
Open the downloaded PBIX file in Power BI Desktop.
Connect your data
Replace the sample data source with your own dataset.
Refresh and adjust
Refresh the model and update fields or visual were needed.
Save and share
Save your report and publish it for your audience.


