187
Power BI Dashboard for Travel Destination Planning
Power BI Dashboard for Travel Destination Planning
More Report pages
Report Author: Aniefiok Ben
187
Share template with others
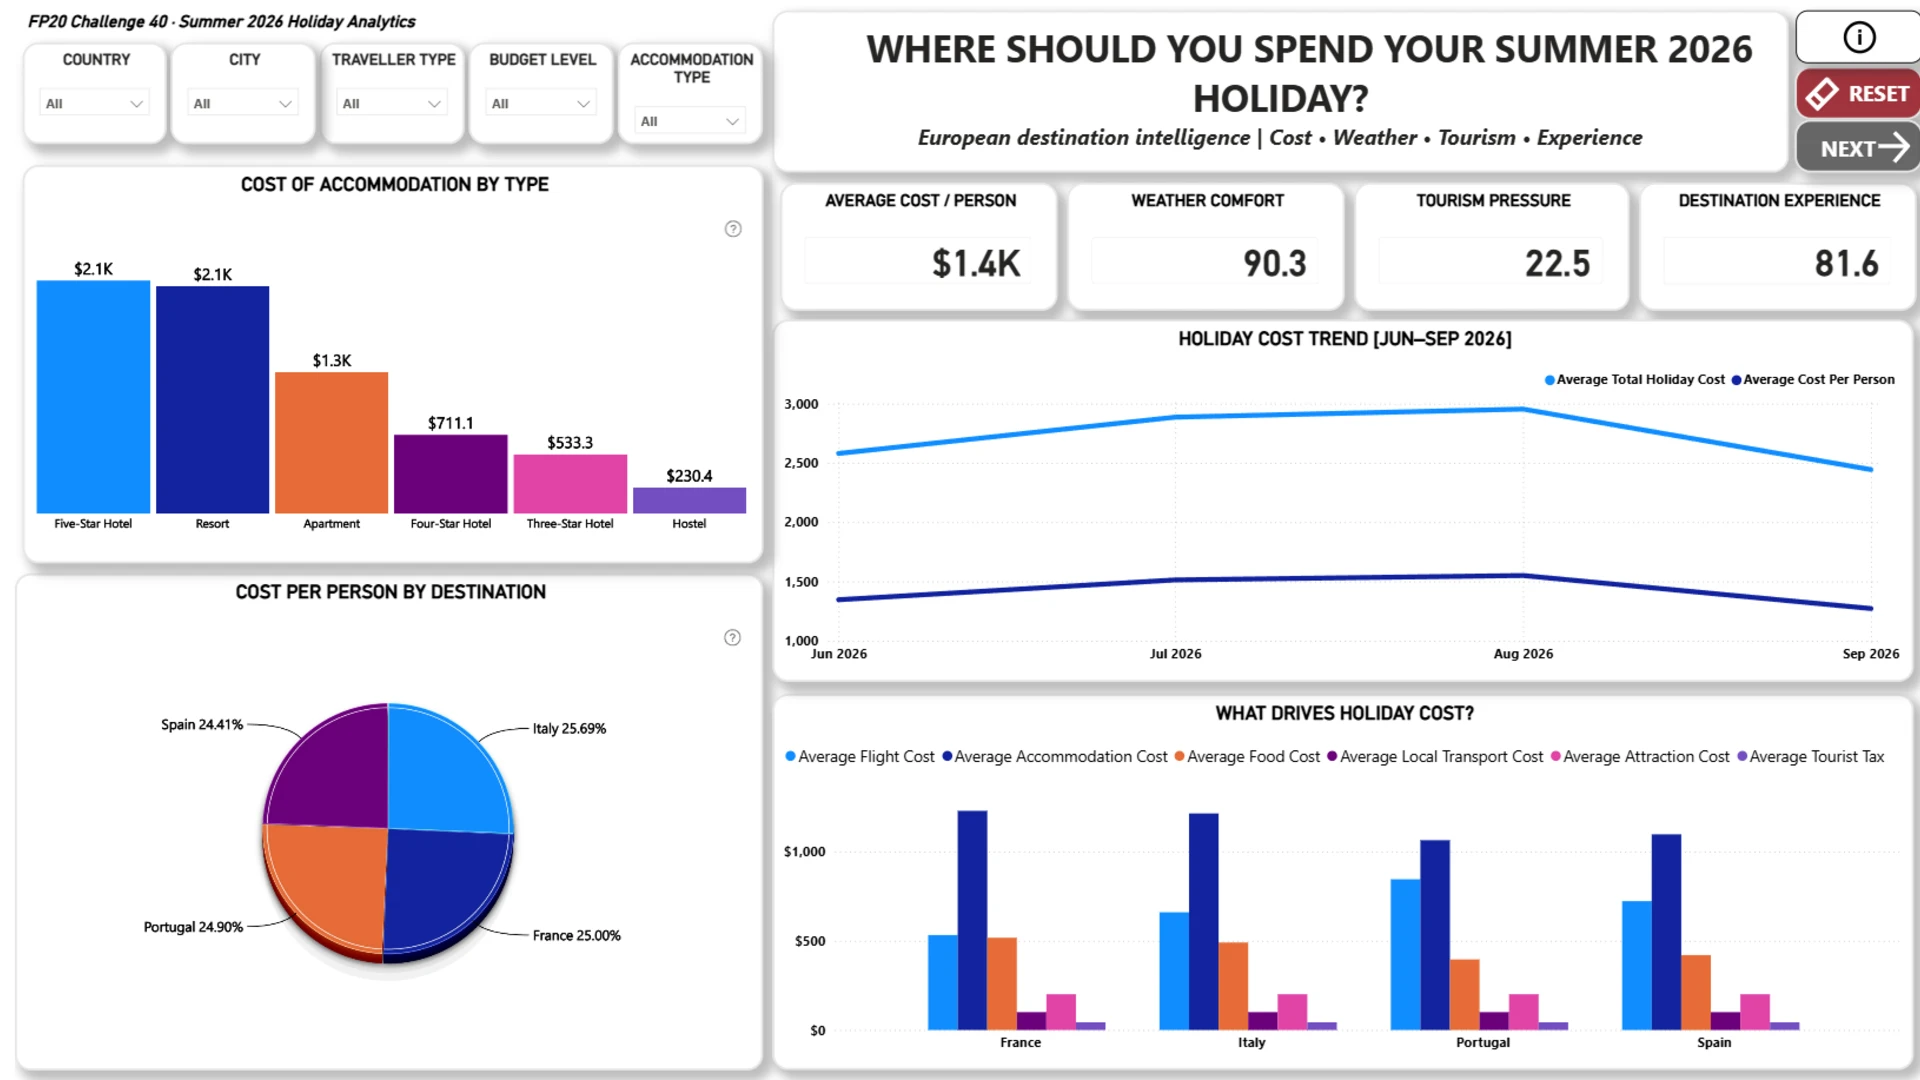
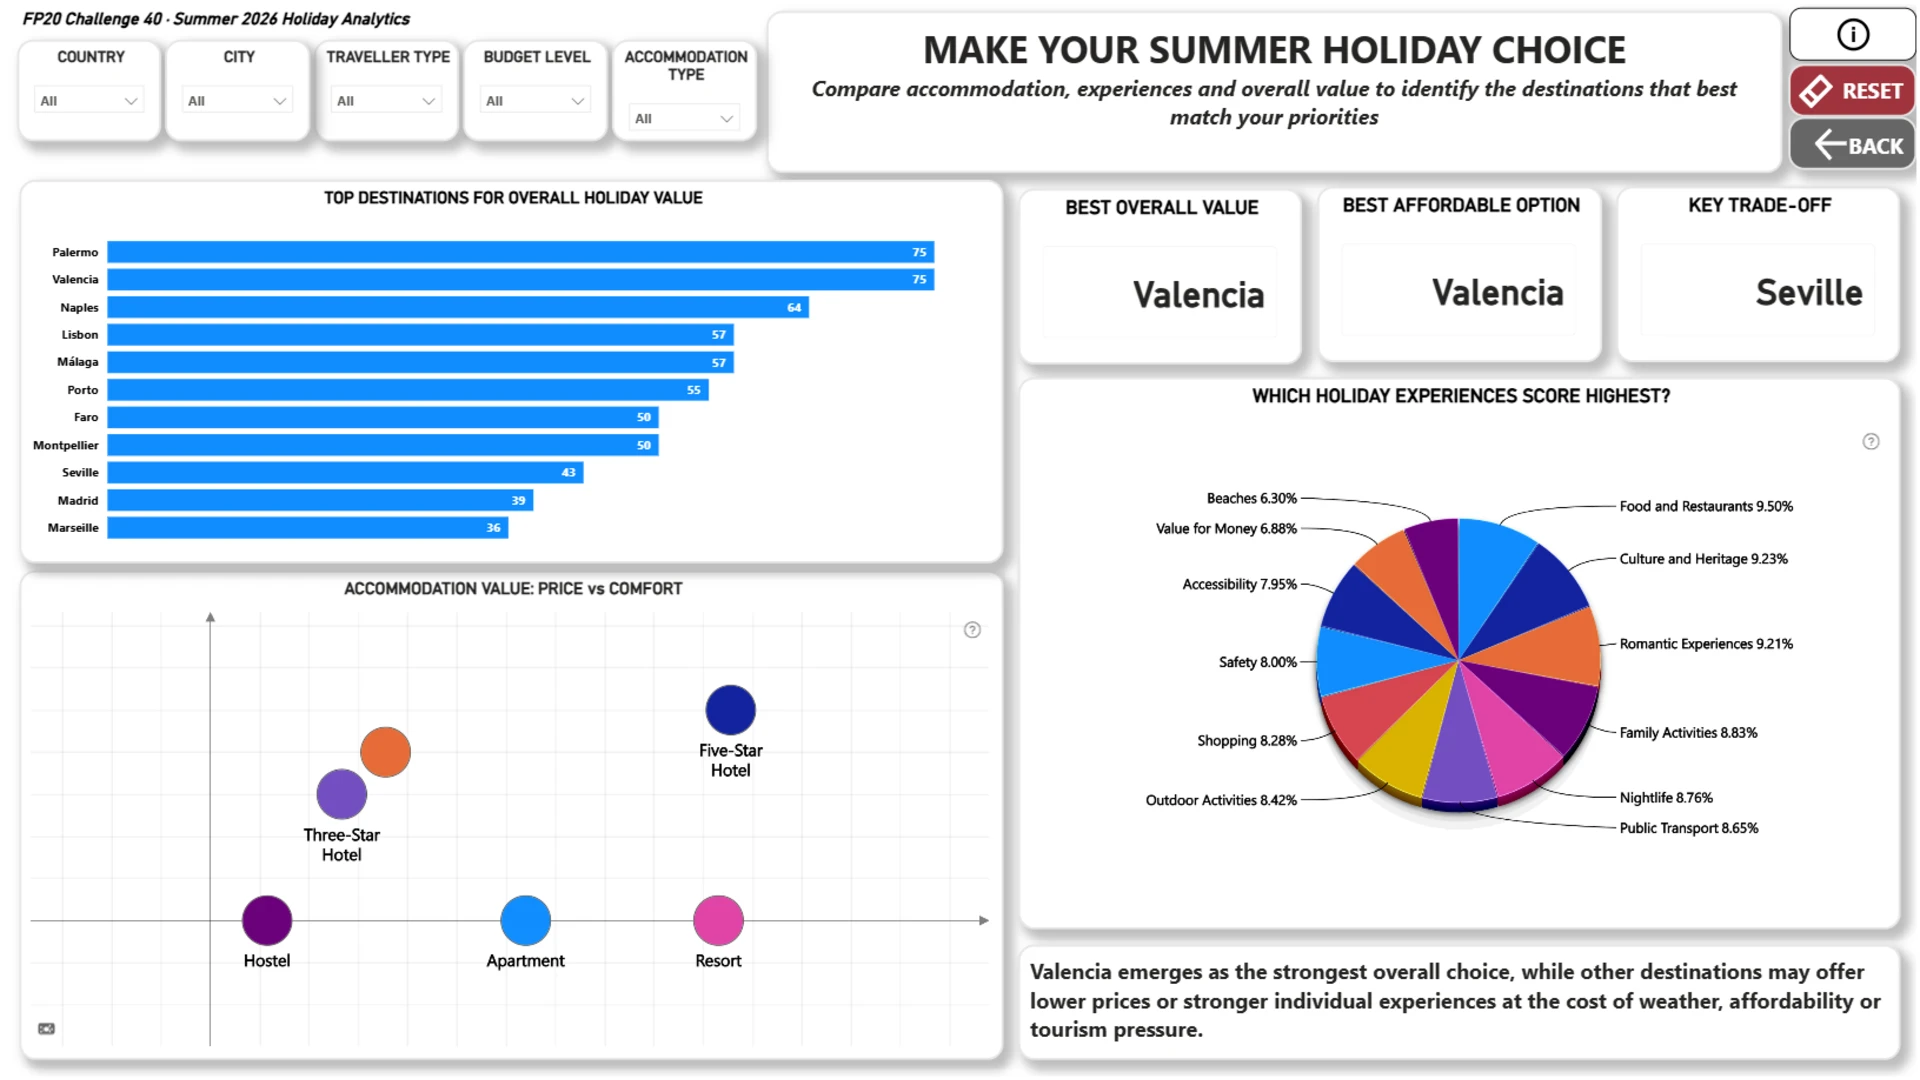
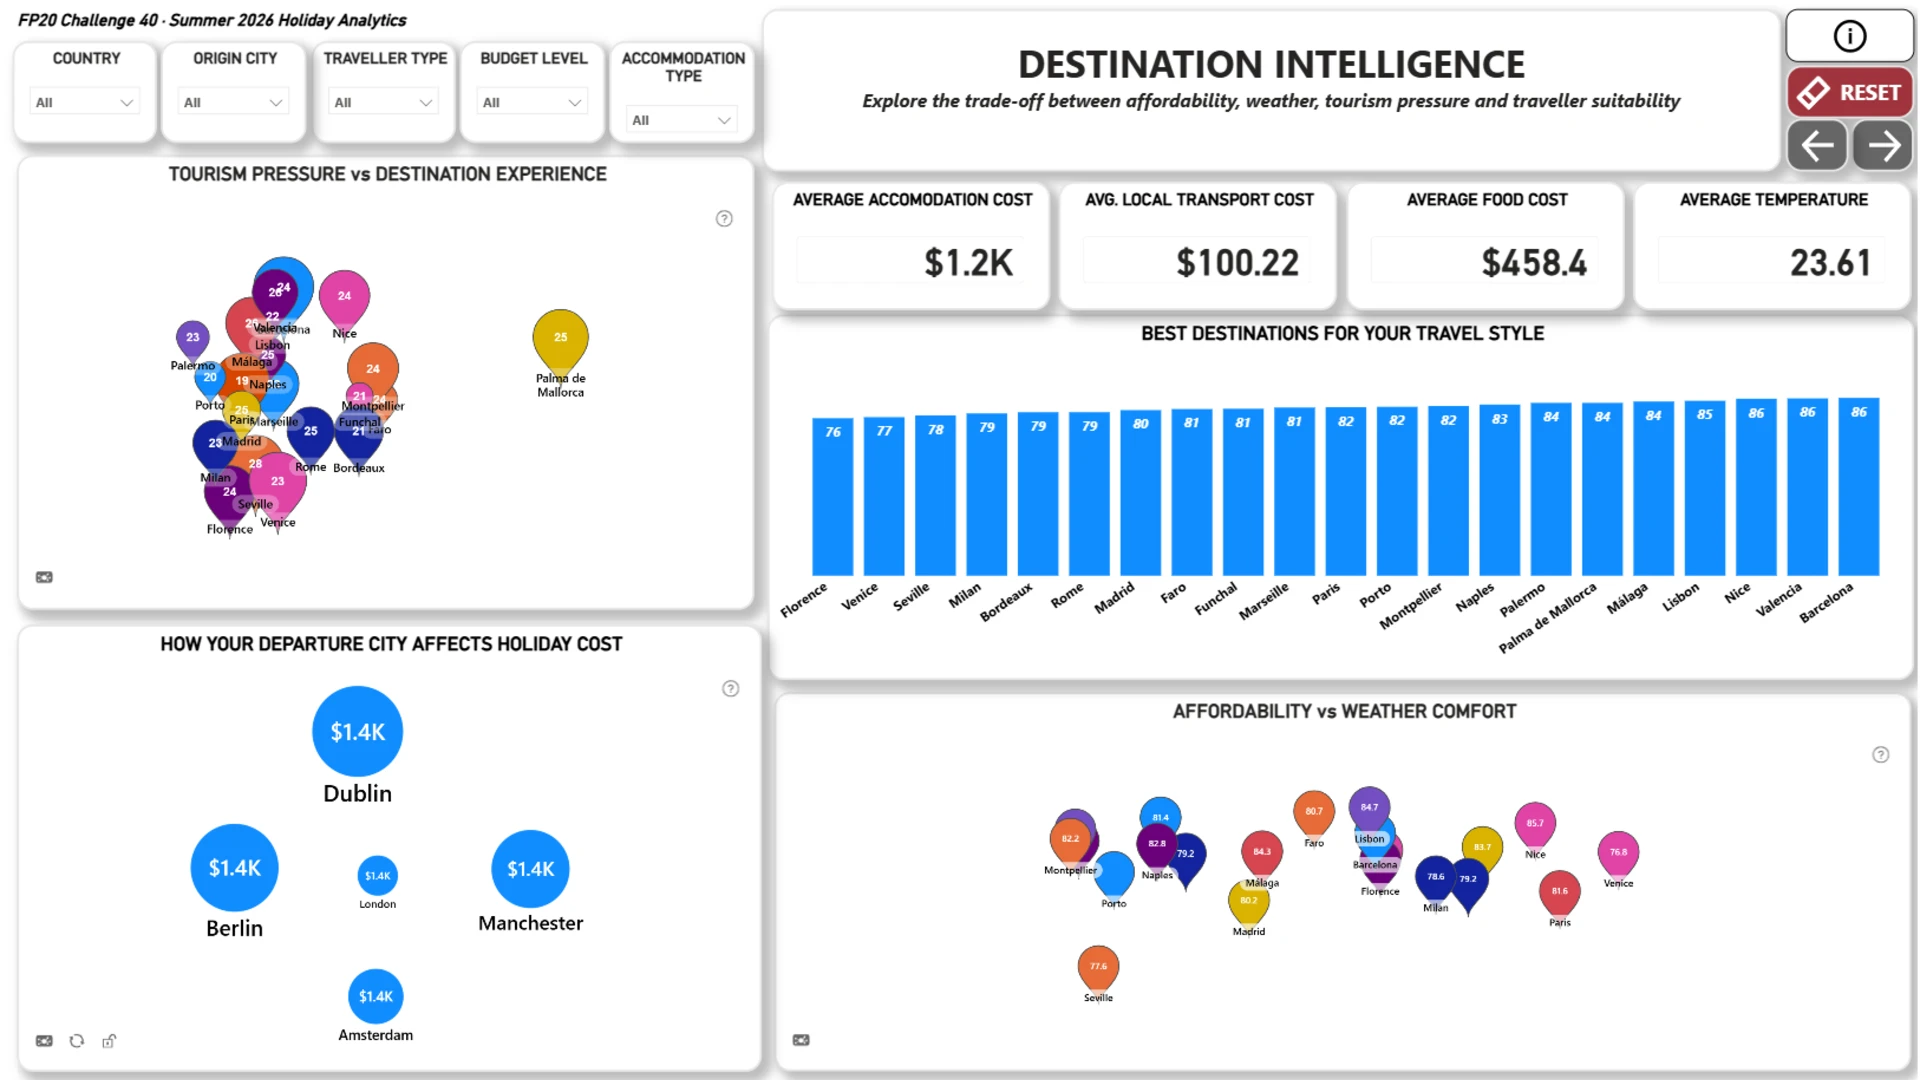
This Power BI report provides a data-driven analysis to help a traveller company identify the best destinations for a Summer 2026 holiday. It evaluates destinations across key factors including holiday cost, weather comfort, tourism pressure, destination experience, traveller suitability, origin-city impact, accommodation options, and overall value. The report is structured across three interactive pages, moving from understanding the holiday landscape, to exploring key trade-offs, and finally supporting destination selection through an Overall Holiday Value Score and personalised recommendations. Interactive ZoomCharts Drill Down visuals further enable users to explore destinations and travel insights in greater detail.
ZoomCharts visuals used





4U Report Challenges
Participate in data challenges, build and submit reports to get free template downloads.
Join CommunityMobile view allows you to interact with the report. To Download the template please switch to desktop view.
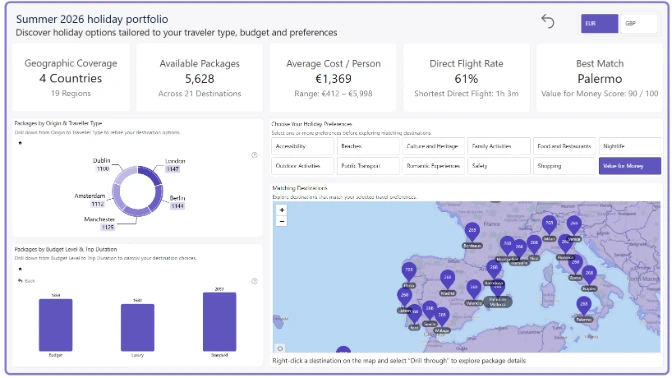
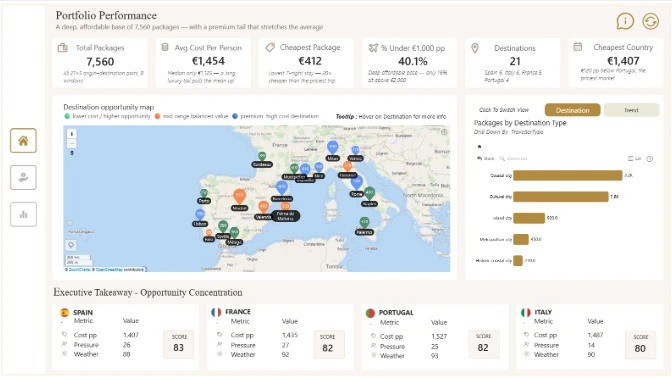
How to use a PBIX template
Preview the interactive report, download the PBIX file, open it in Power BI Desktop, and replace the same data connection with your own dataset.
Preview and download
Explore the report online and download the PBIX template file.
Open in Power BI Desktop
Open the downloaded PBIX file in Power BI Desktop.
Connect your data
Replace the sample data source with your own dataset.
Refresh and adjust
Refresh the model and update fields or visual were needed.
Save and share
Save your report and publish it for your audience.


