38
Power BI AI Agent Customer Support Analytics Dashboard
Power BI AI Agent Customer Support Analytics Dashboard
More Report pages
Report Author: ZoomCharts
38
Share template with others
Summary
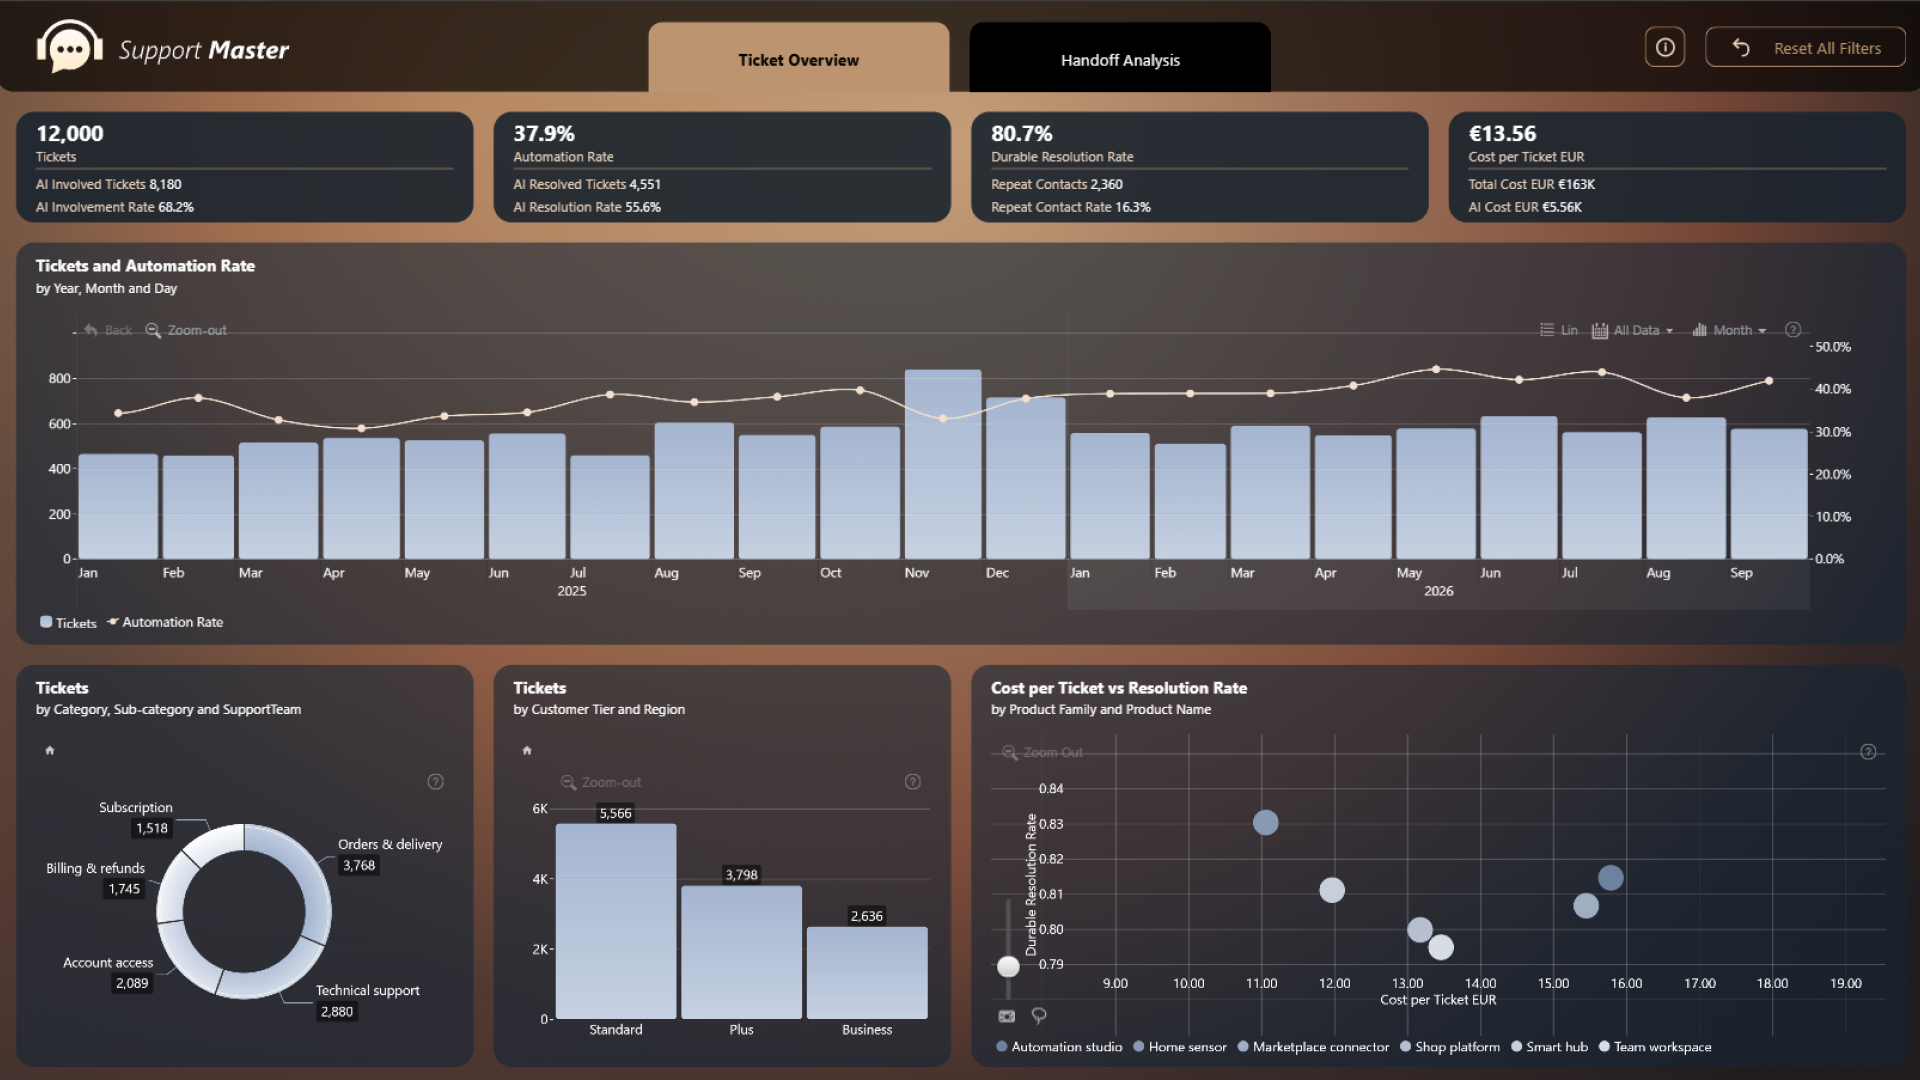
This Power BI AI agent customer support analytics dashboard was created for the FP20 Analytics & ZoomCharts Challenge 42. It analyzes 12,000 customer-support tickets recorded between January 2025 and September 2026.
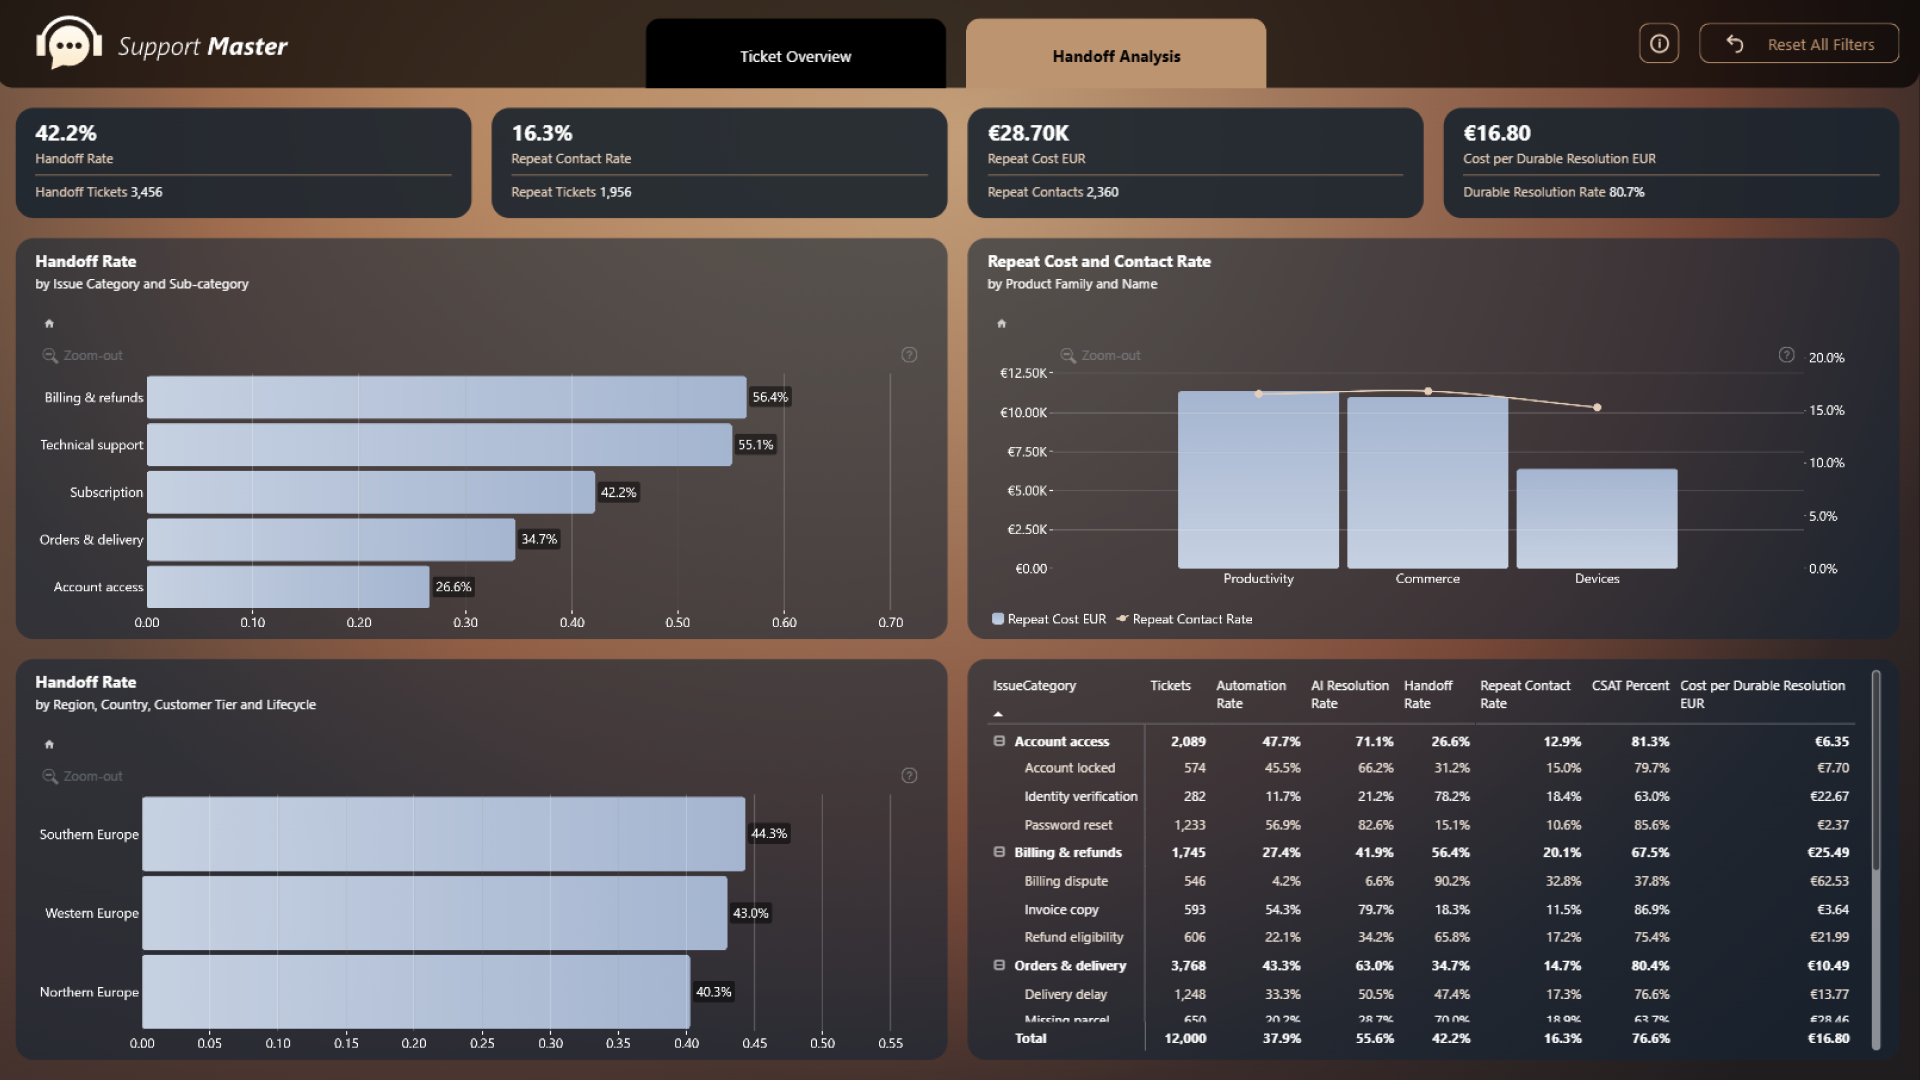
The report helps support leaders evaluate how AI automation, human assistance, and routing decisions affect resolution quality, customer satisfaction, repeat contacts, and service costs. It highlights where AI delivers value, when human intervention is needed, and which areas of the support process may require improvement.
Key Insights of the Power BI AI Agent Customer Support Analytics Dashboard
The report is structured across two pages: Ticket Overview and Handoff Analysis. It provides insights into:
- Ticket volume and automation: ticket trends, automation rates, AI involvement, and AI resolution performance
- Resolution quality: durable resolution rates, repeat contacts, customer satisfaction, and differences across support issues
- AI-to-human handoffs: handoff rates by issue category, region, customer tier, lifecycle stage, product family, and product
- Support costs: cost per ticket, cost per durable resolution, AI-related costs, and the financial impact of repeat contacts
- Customer and product segments: ticket distribution and outcomes across issue types, regions, customer tiers, support teams, and products
- Performance over time: changes in ticket volume and automation rates from January 2025 to September 2026
ZoomCharts Drill Down Visuals make it possible to move from high-level KPIs to more detailed results. The report supports comparisons between operational efficiency and customer outcomes, helping users identify where automation reduces costs without compromising resolution quality.
How to use this Power BI Dashboard
Use the page navigation to switch between the Ticket Overview and Handoff Analysis. Select active chart elements to filter related visuals, compare customer or product segments, and investigate the factors behind ticket handoffs, repeat contacts, and support costs.
Use the drill-down controls to explore more detailed categories and the Reset All Filters button to return to the complete report view.
Download the free PBIX file to customize this Power BI customer support dashboard template for your business needs. Connect your own support data and adapt the visuals, KPIs, filters, and calculations to analyze AI performance, human handoffs, resolution quality, customer satisfaction, and service costs.
ZoomCharts visuals used


4U Report Challenges
Participate in data challenges, build and submit reports to get free template downloads.
Join CommunityMobile view allows you to interact with the report. To Download the template please switch to desktop view.
How to use a PBIX template
Preview the interactive report, download the PBIX file, open it in Power BI Desktop, and replace the same data connection with your own dataset.
Preview and download
Explore the report online and download the PBIX template file.
Open in Power BI Desktop
Open the downloaded PBIX file in Power BI Desktop.
Connect your data
Replace the sample data source with your own dataset.
Refresh and adjust
Refresh the model and update fields or visual were needed.
Save and share
Save your report and publish it for your audience.


