1353
Power BI Sales Dashboard for the Pharmaceutical Industry
Power BI Sales Dashboard for the Pharmaceutical Industry
More Report pages
Report Author: ATHIRA M N
1353
Share template with others
Summary
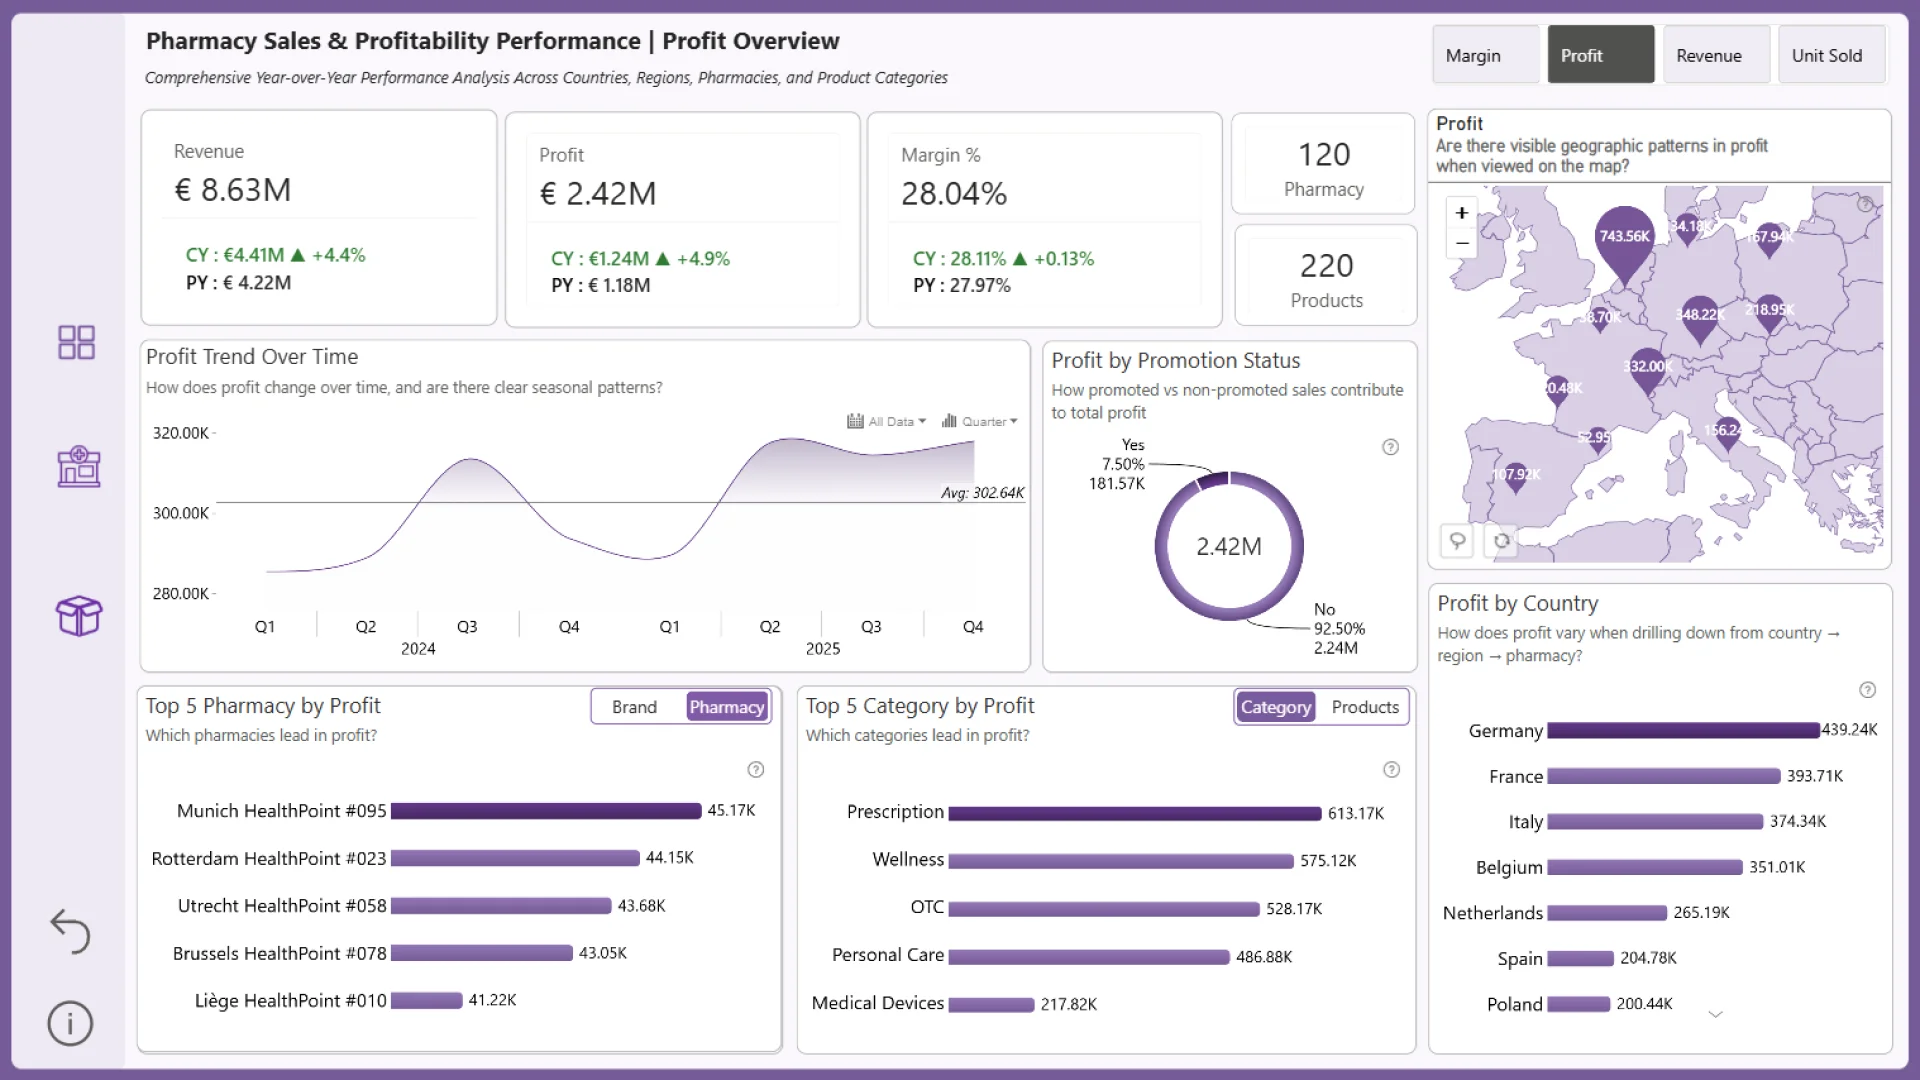
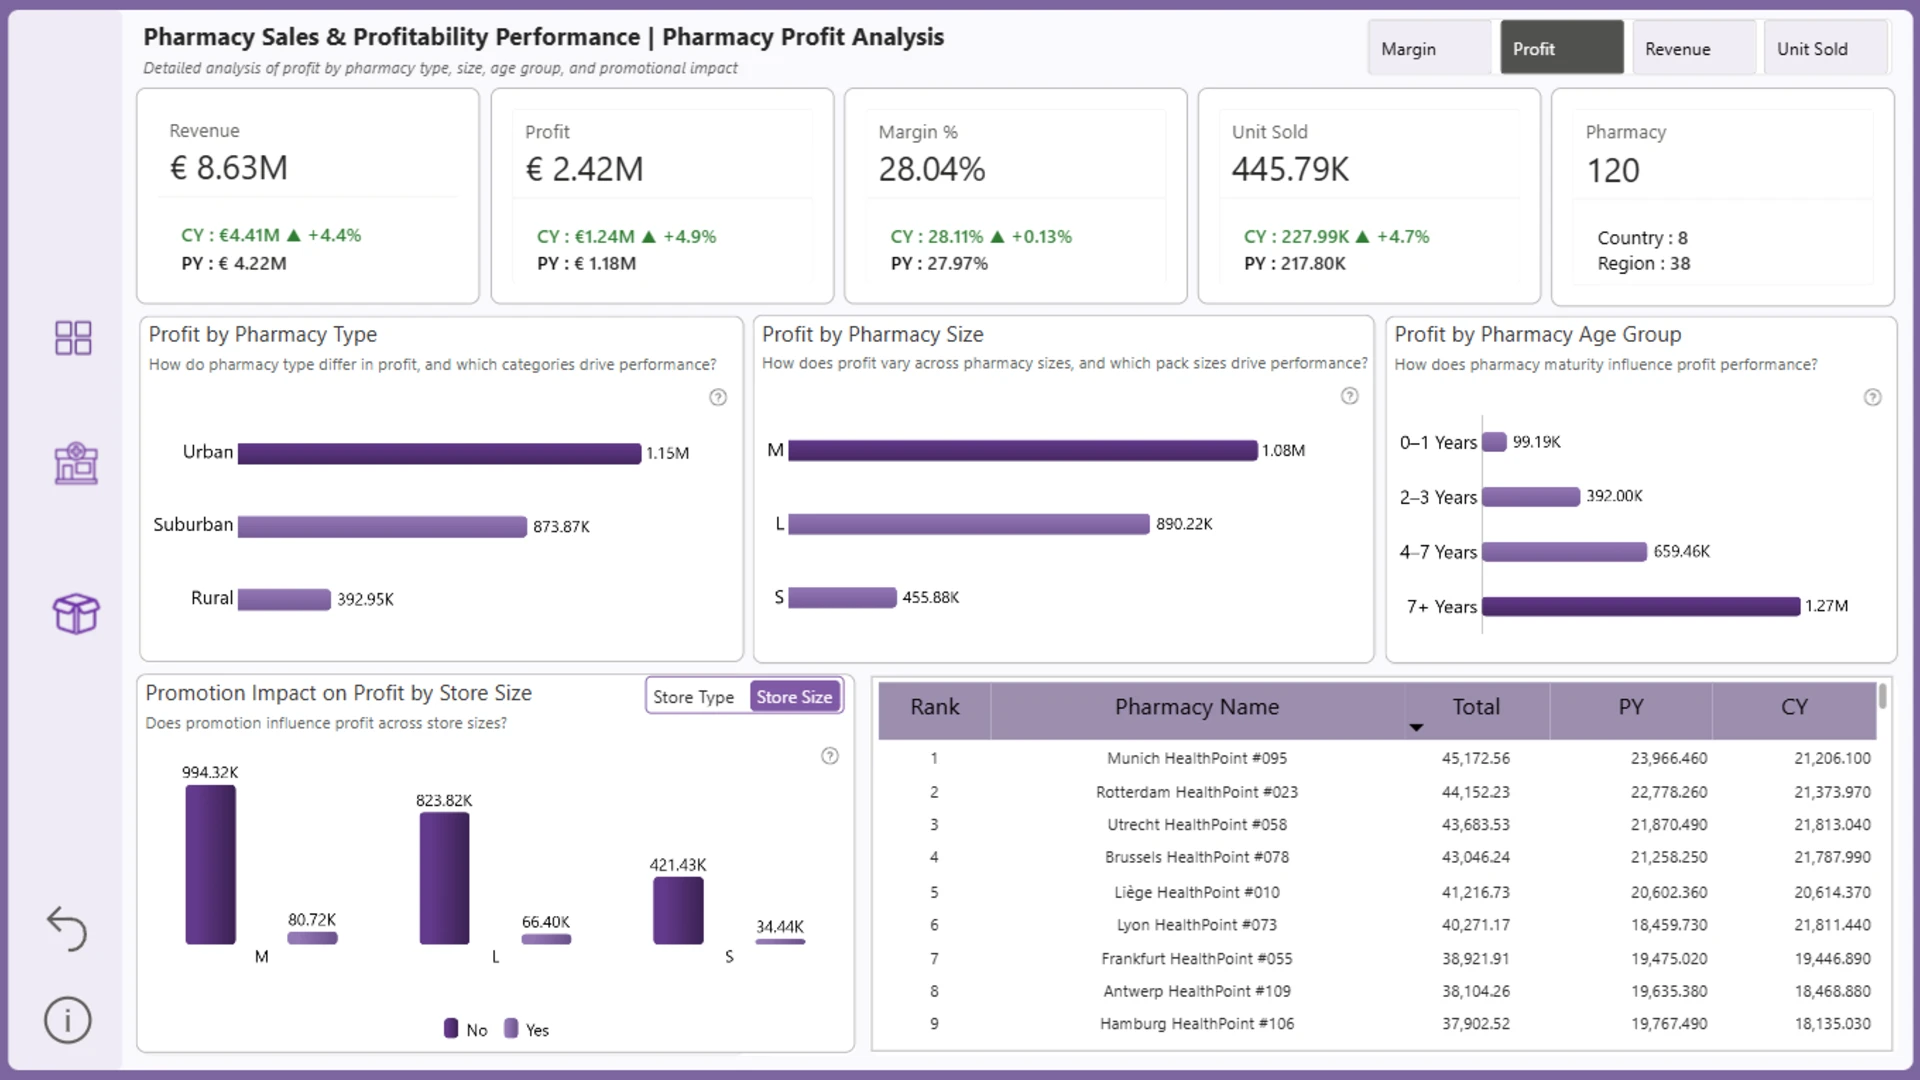
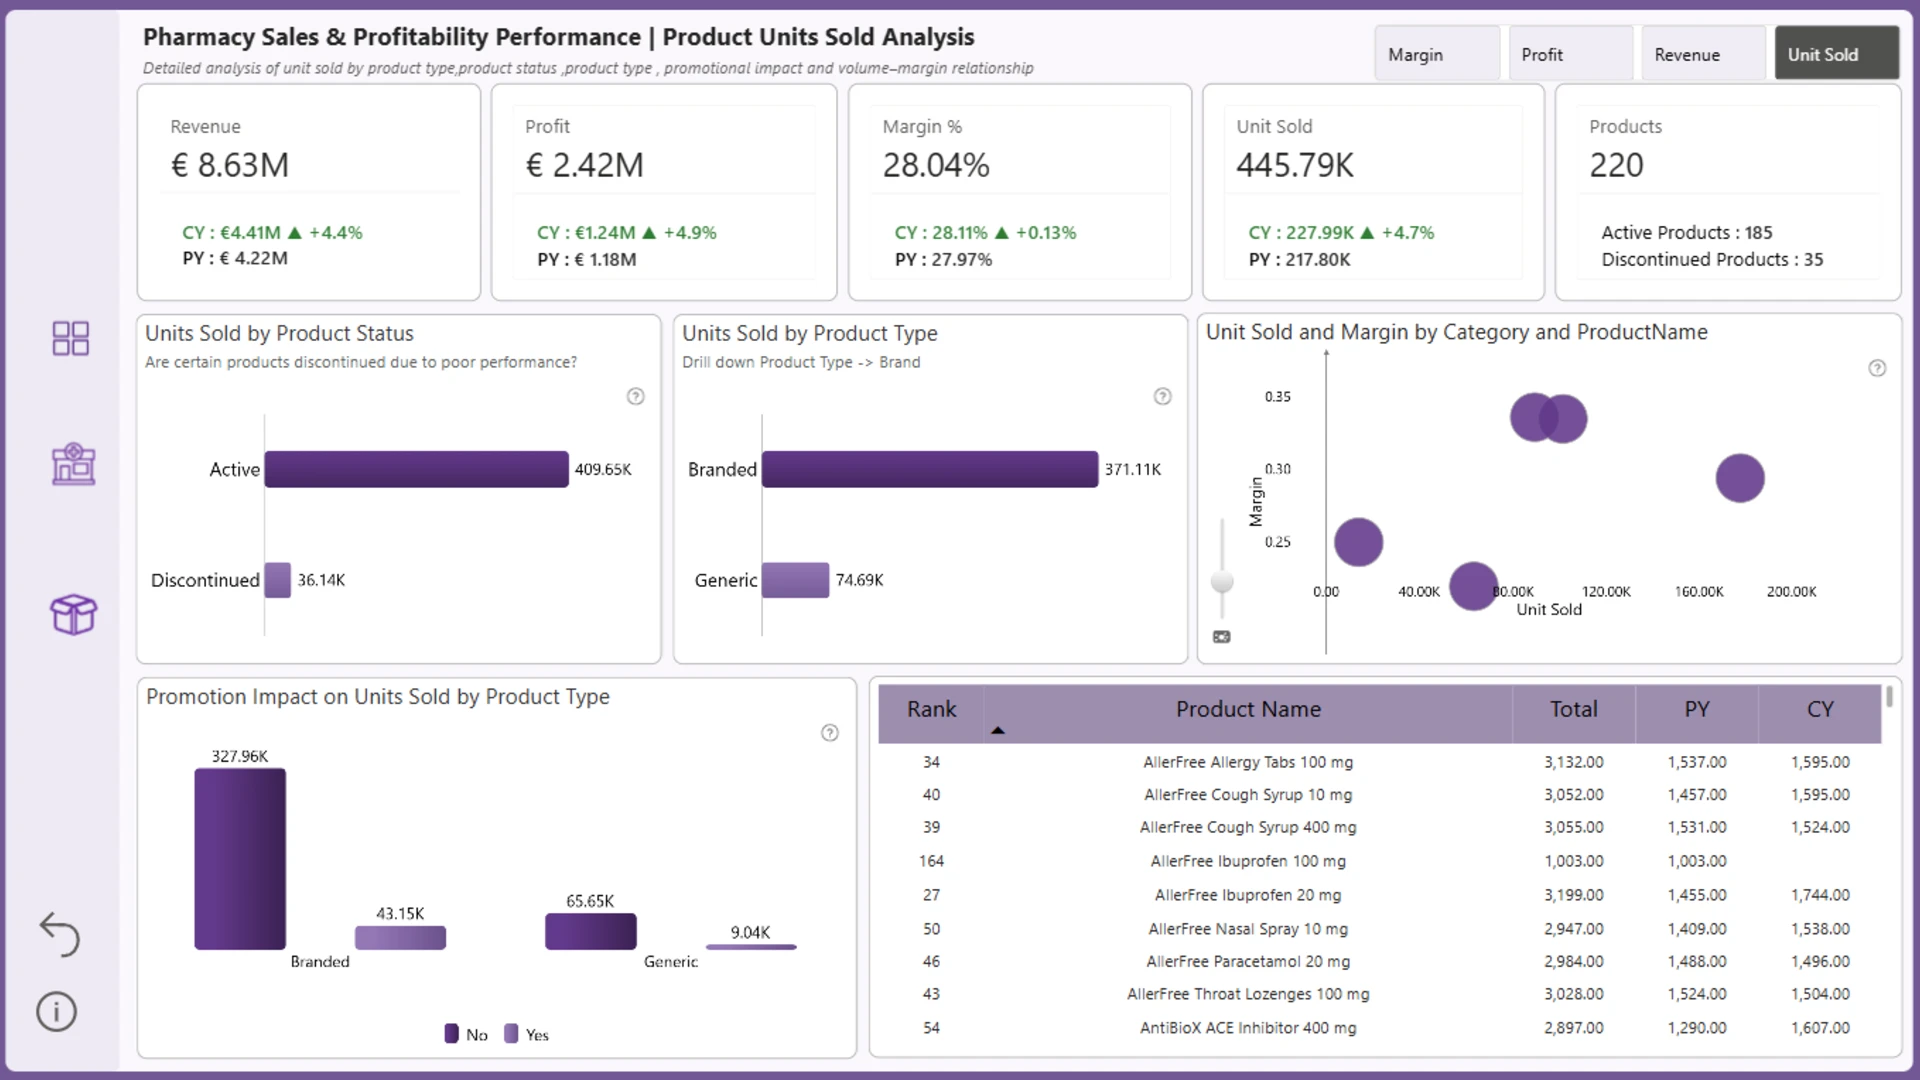
This pharmacy sales and profitability dashboard is an interactive Power BI example for exploring sales performance and profitability from time-based, geographic, and categorical perspectives.
Created by ATHIRA M N for the Onyx Data DataDNA ZoomCharts Mini Challenge in January-February 2026, the report uses Drill Down Scatter PRO, Combo PRO, Combo Bar PRO, Timeline PRO, Map PRO, and Donut PRO visuals.
Key Insights of the Pharmacy Sales & Profitability Dashboard
The gallery includes three report views that support analysis from several perspectives. The main areas of analysis include:
- Sales performance: examine pharmacy sales results and changes over time
- Profitability analysis: compare sales measures with profitability indicators
- Geographic performance: explore how results vary across locations
- Category composition: review how different segments contribute to overall performance
- Metric relationships: use scatter and combination charts to investigate patterns between business measures
The interactive Power BI visuals work together to filter the report, helping users move from an overview to more focused pharmacy sales and profitability insights.
How to Use This Pharmacy Sales & Profitability Dashboard
Click active chart elements, map locations, or timeline selections to filter the report and explore the data from different perspectives. Use the available drill-down interactions to move into more detailed views where supported.
Download the .pbix template to examine the report structure, calculations, visual settings, and interactions, or adapt the dashboard to your own pharmacy sales data.
ZoomCharts visuals used






4U Report Challenges
Participate in data challenges, build and submit reports to get free template downloads.
Join CommunityMobile view allows you to interact with the report. To Download the template please switch to desktop view.
How to use a PBIX template
Preview the interactive report, download the PBIX file, open it in Power BI Desktop, and replace the same data connection with your own dataset.
Preview and download
Explore the report online and download the PBIX template file.
Open in Power BI Desktop
Open the downloaded PBIX file in Power BI Desktop.
Connect your data
Replace the sample data source with your own dataset.
Refresh and adjust
Refresh the model and update fields or visual were needed.
Save and share
Save your report and publish it for your audience.


