671
Pharmacy Sales and Profitability Analysis 6
Pharmacy Sales and Profitability Analysis 6
Report Author: Mohamed Kadri
671
Share template with others
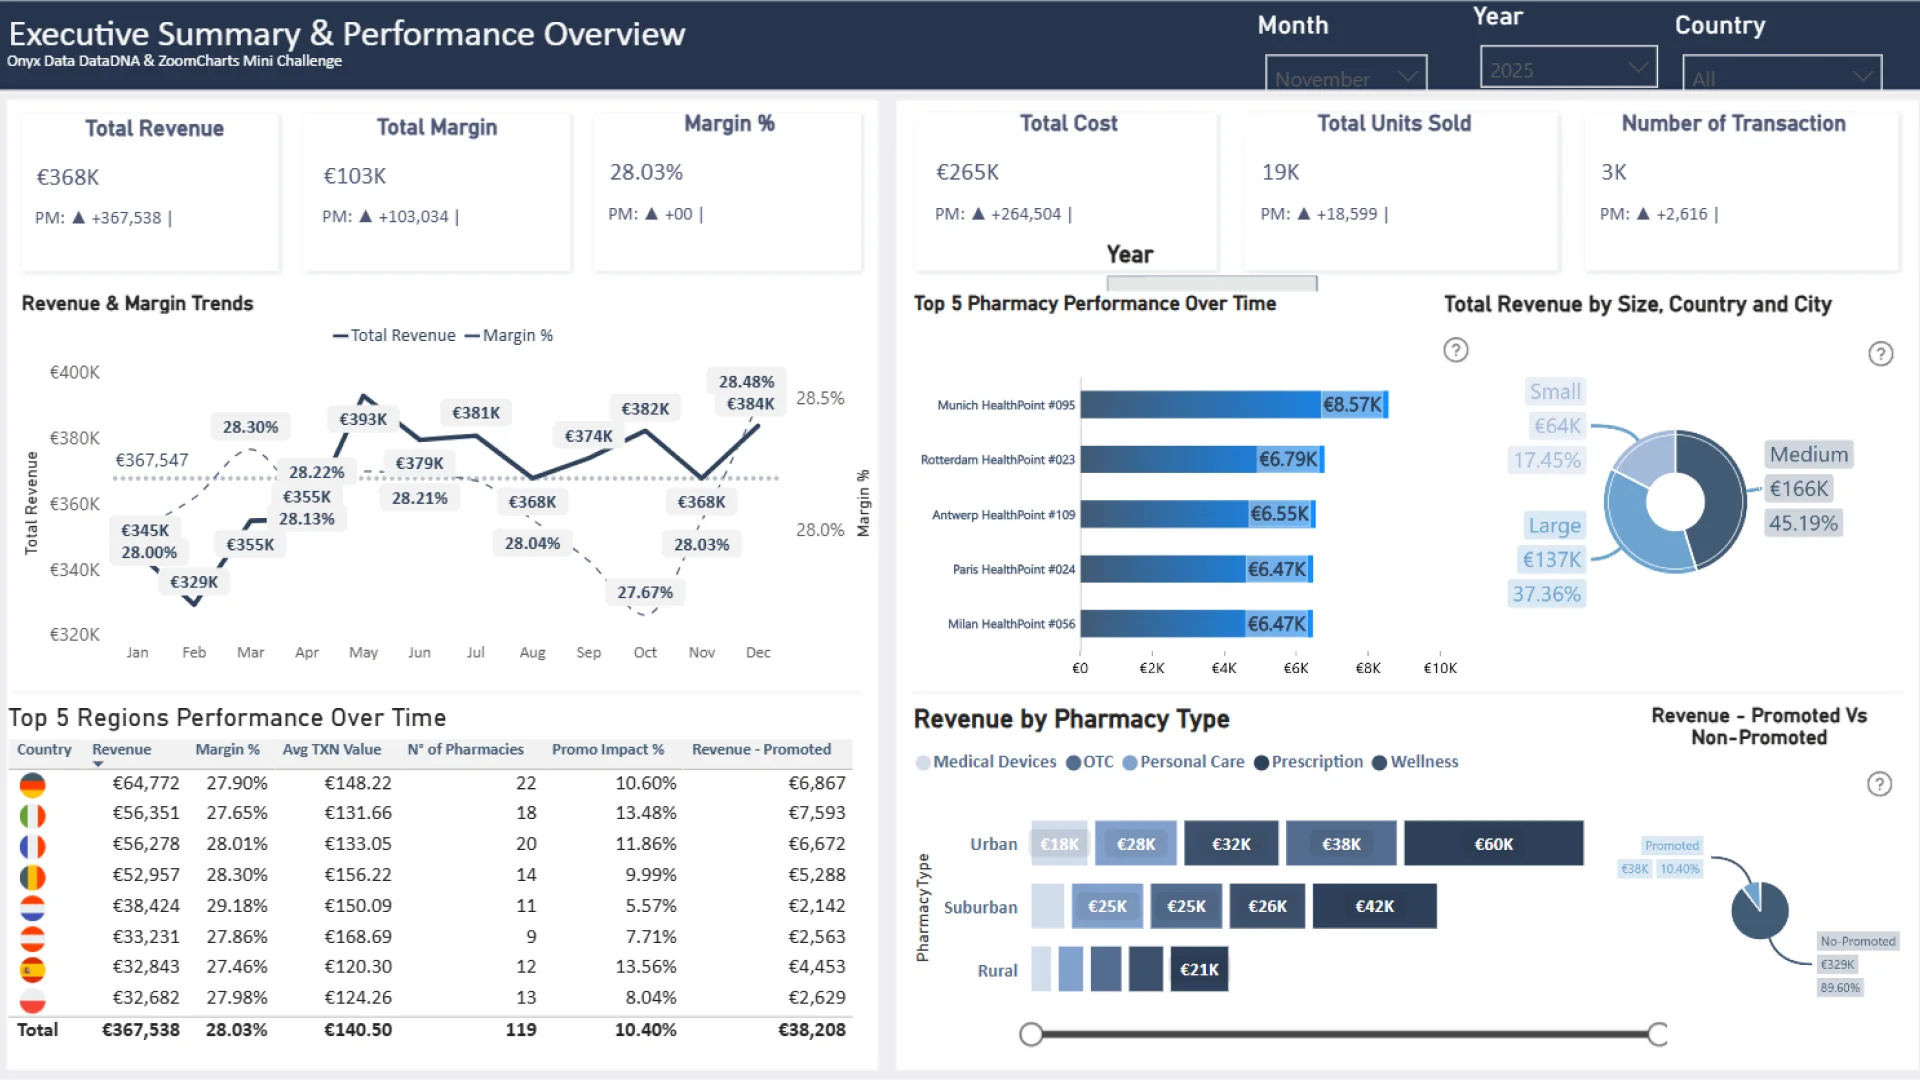
This Power BI report uses the Pharmacy Sales and Profitability dataset. The report features ZoomCharts Drill Down PRO custom visuals for Power BI. It was submitted to the Onyx Data DataDNA ZoomCharts Mini Challenge in January - February 2026.
Author’s Description:
Interactive Power BI dashboard analyzing European pharmacy sales performance across countries, regions, and product categories.
The report follows a three-page structure: Executive Overview (KPIs, trends, geographic and pharmacy type performance), Product & Geographic Intelligence (portfolio analysis, heat maps, and regional insights), and Advanced Analytics (a comprehensive drill-down table with more than 40 metrics).
Key features include 58+ custom DAX measures with time intelligence calculations (YoY, QoQ, MoM, YTD), a seven-level drill-down hierarchy (Country → Region → City → Pharmacy → Category → Brand → Product), volume versus margin quadrant analysis for portfolio optimization, promotion impact analysis, and pharmacy type benchmarking.
The dashboard also incorporates rich conditional formatting, interactive tooltips, and mobile-optimized views, and is designed to support strategic decision-making in pharmaceutical retail operations.
ZoomCharts visuals used




4U Report Challenges
Participate in data challenges, build and submit reports to get free template downloads.
Join CommunityMobile view allows you to interact with the report. To Download the template please switch to desktop view.
How to use a PBIX template
Preview the interactive report, download the PBIX file, open it in Power BI Desktop, and replace the same data connection with your own dataset.
Preview and download
Explore the report online and download the PBIX template file.
Open in Power BI Desktop
Open the downloaded PBIX file in Power BI Desktop.
Connect your data
Replace the sample data source with your own dataset.
Refresh and adjust
Refresh the model and update fields or visual were needed.
Save and share
Save your report and publish it for your audience.


