424
Pharmacy Sales and Profitability Analysis 10
Pharmacy Sales and Profitability Analysis 10
Report Author: Karolina Grzybek
424
Share template with others
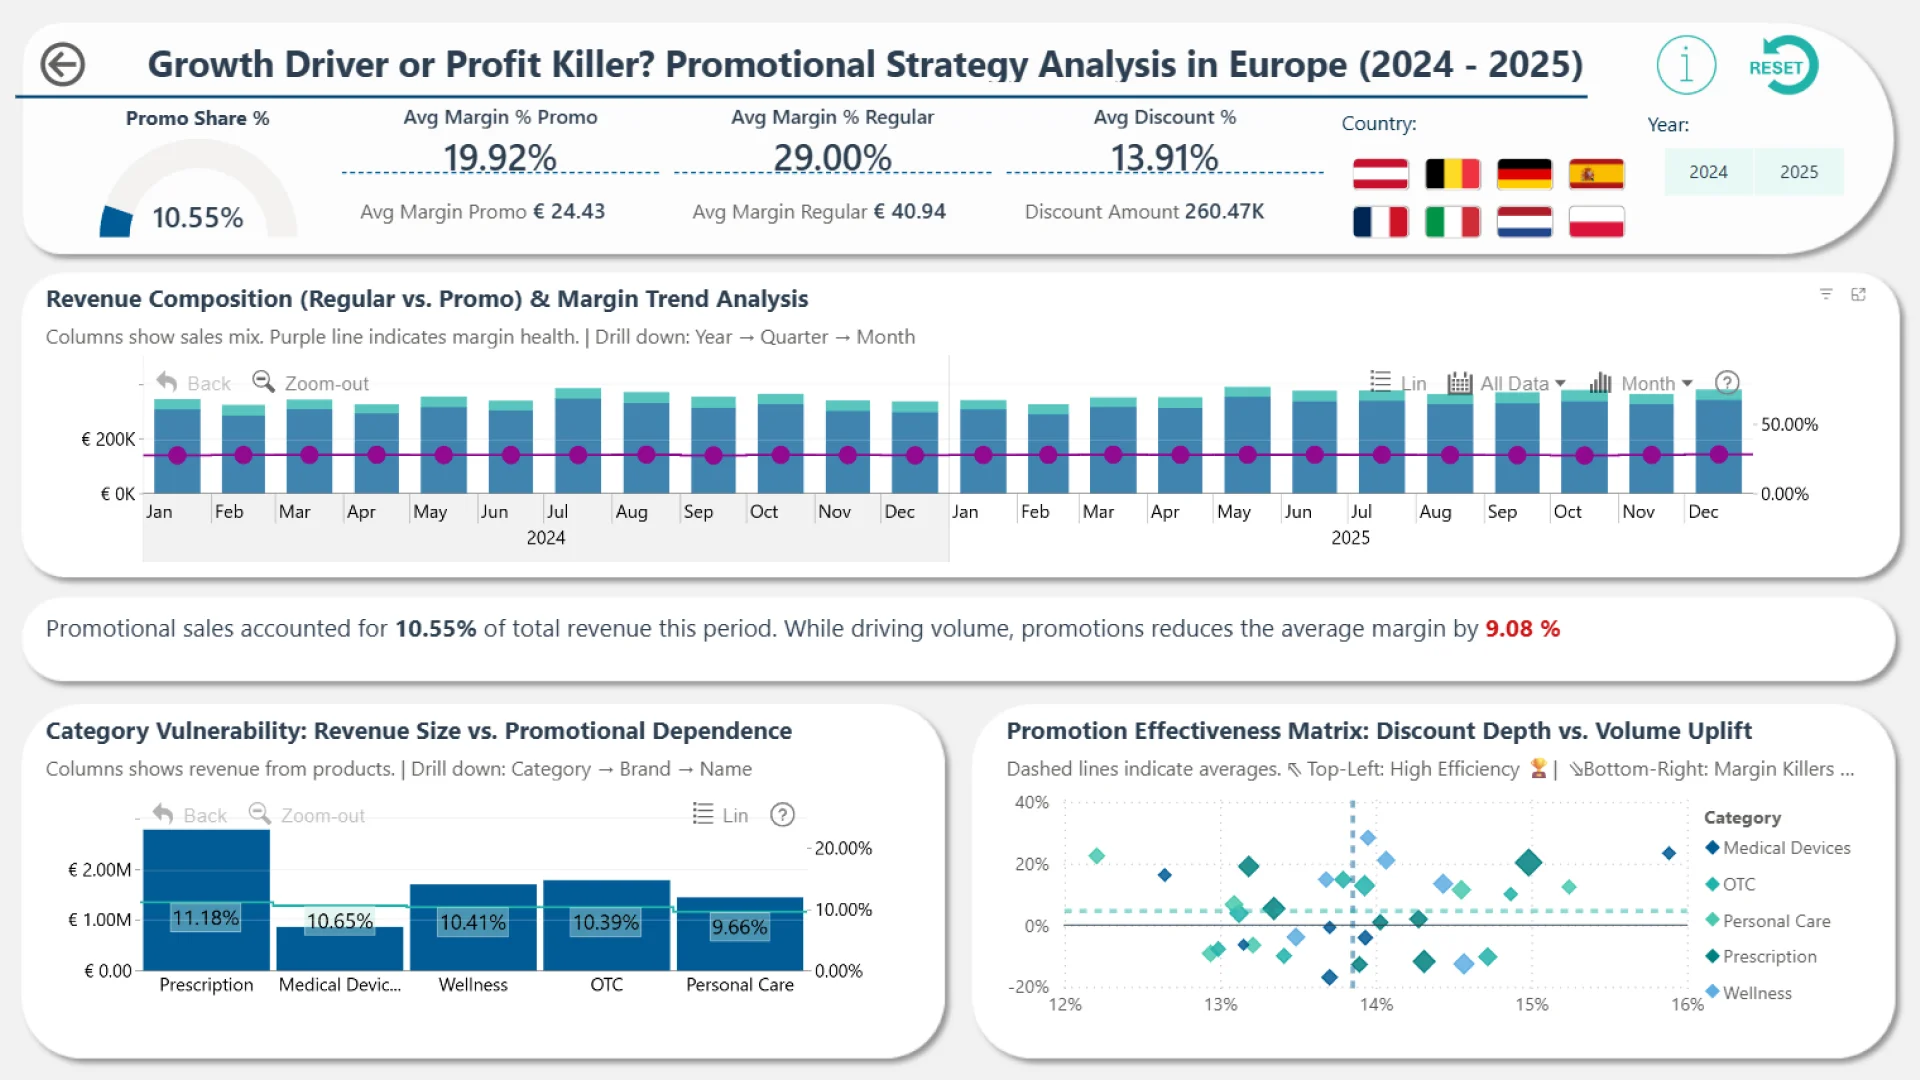
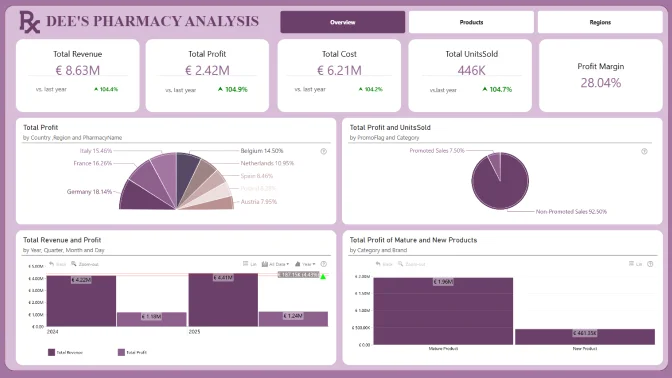
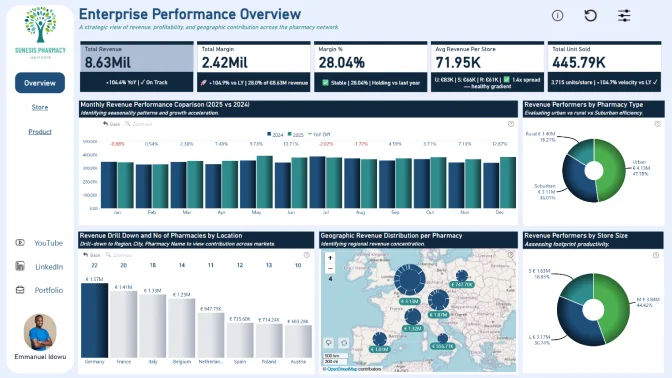
This Power BI report uses the Pharmacy Sales and Profitability dataset. The report features ZoomCharts Drill Down PRO custom visuals for Power BI. It was submitted to the Onyx Data DataDNA ZoomCharts Mini Challenge in January - February 2026.
Author’s Description:
I improved dynamic titles, added interactive help overlays, standardized KPI formatting, and refined navigation by hiding underlying pages for a cleaner app-style experience. I decided to retain the 2024/2025 year selection buttons instead of adding a timeline slicer, as this better aligns with the executive dashboard design while still allowing detailed time analysis through drill-down features. I hope these enhancements further improve the report’s clarity and user experience.
4U Report Challenges
Participate in data challenges, build and submit reports to get free template downloads.
Join CommunityMobile view allows you to interact with the report. To Download the template please switch to desktop view.

Was this helpful? Thank you for your feedback!
Sorry about that.
How can we improve it?