This Power BI report uses the Pharmacy Sales and Profitability dataset. The report features ZoomCharts Drill Down PRO custom visuals for Power BI. It was submitted to the Onyx Data DataDNA ZoomCharts Mini Challenge in January - February 2026.
Author’s Description:
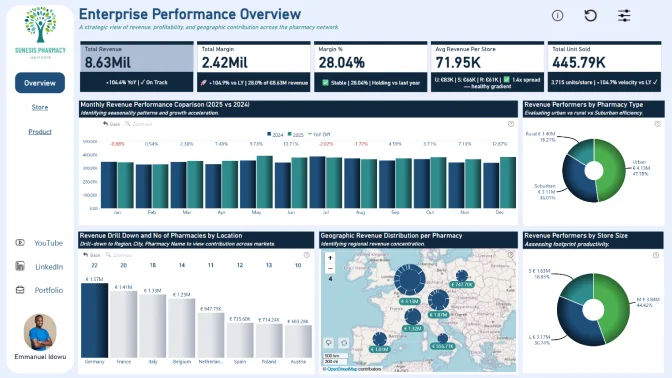
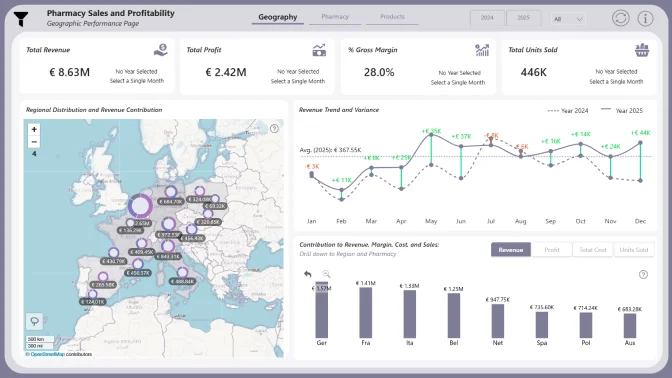
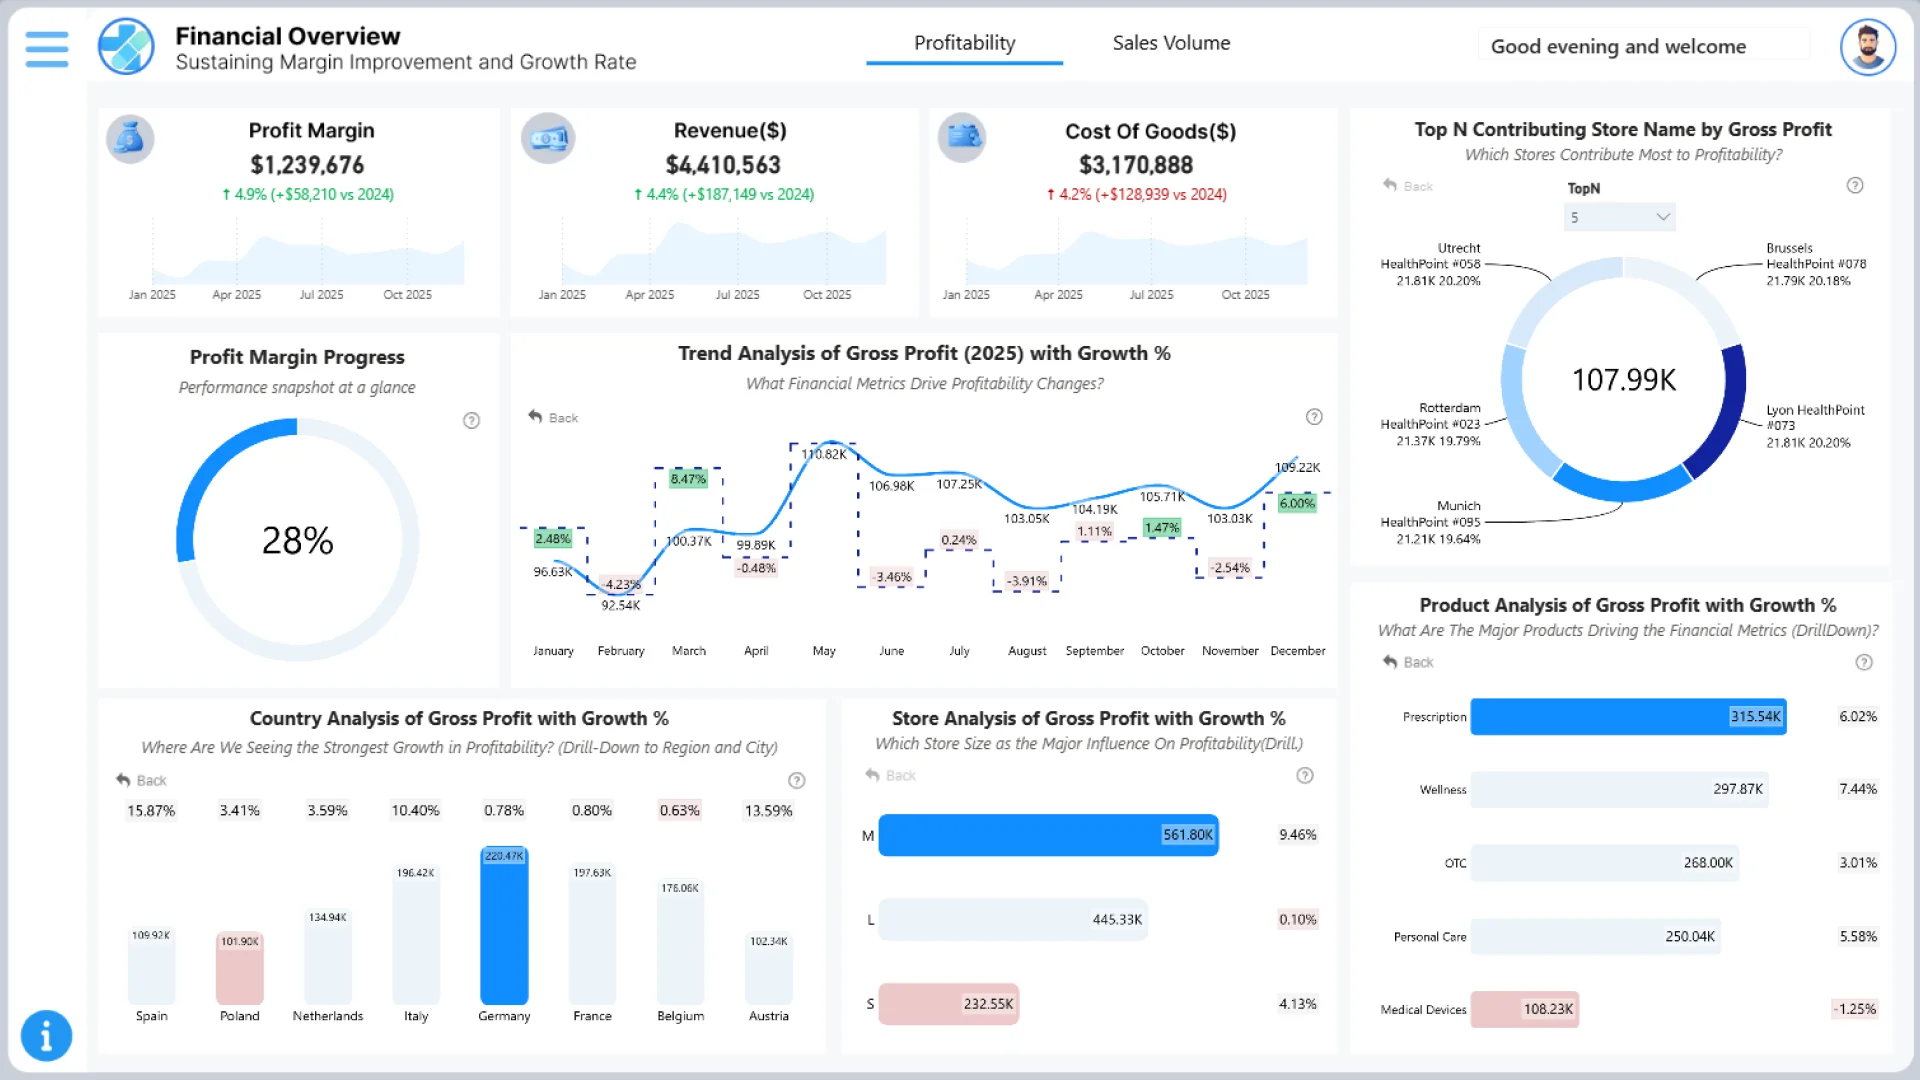
Page 1 focuses on gross profit as the primary outcome, with revenue and cost as its key drivers. Users can select the metric they want to track and instantly view percentage changes compared to prior periods. The dashboard enables drill-down by country, region, store size, and product category to uncover what drives profitability.
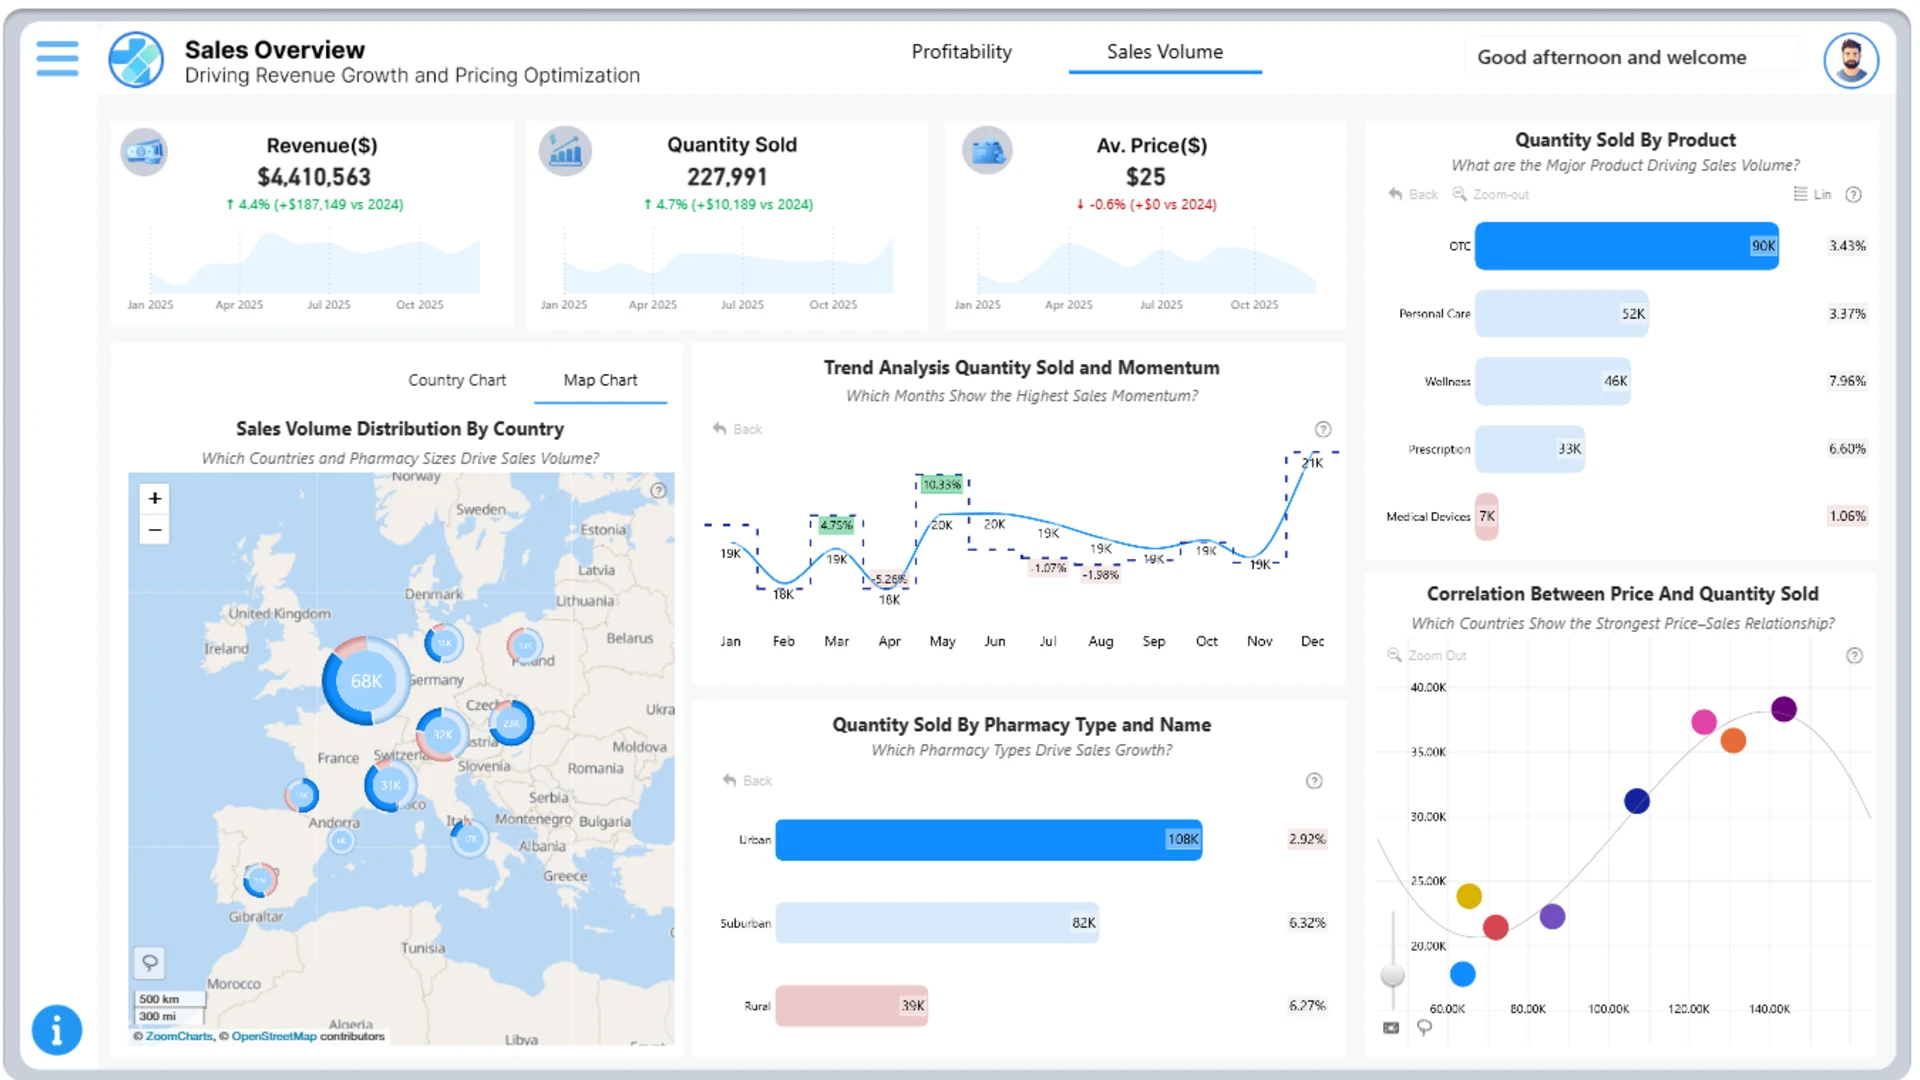
Page 2 shifts to sales and pricing, where revenue is influenced by quantity sold and average price. The analysis explores how price and sales volume interact across regions, including a correlation view that highlights where pricing strategy has the strongest impact on demand. Overall, the dashboard is designed for clarity, flexibility, and informed decision-making.