559
Pharma Sales Profitability Report 13
Pharma Sales Profitability Report 13
Report Author: Ugochukwu Nwasuruba
559
Share template with others
This Power BI report uses the Pharmacy Sales and Profitability dataset. The report features ZoomCharts Drill Down PRO custom visuals for Power BI. It was submitted to the Onyx Data DataDNA ZoomCharts Mini Challenge in January - February 2026.
Author’s Description:
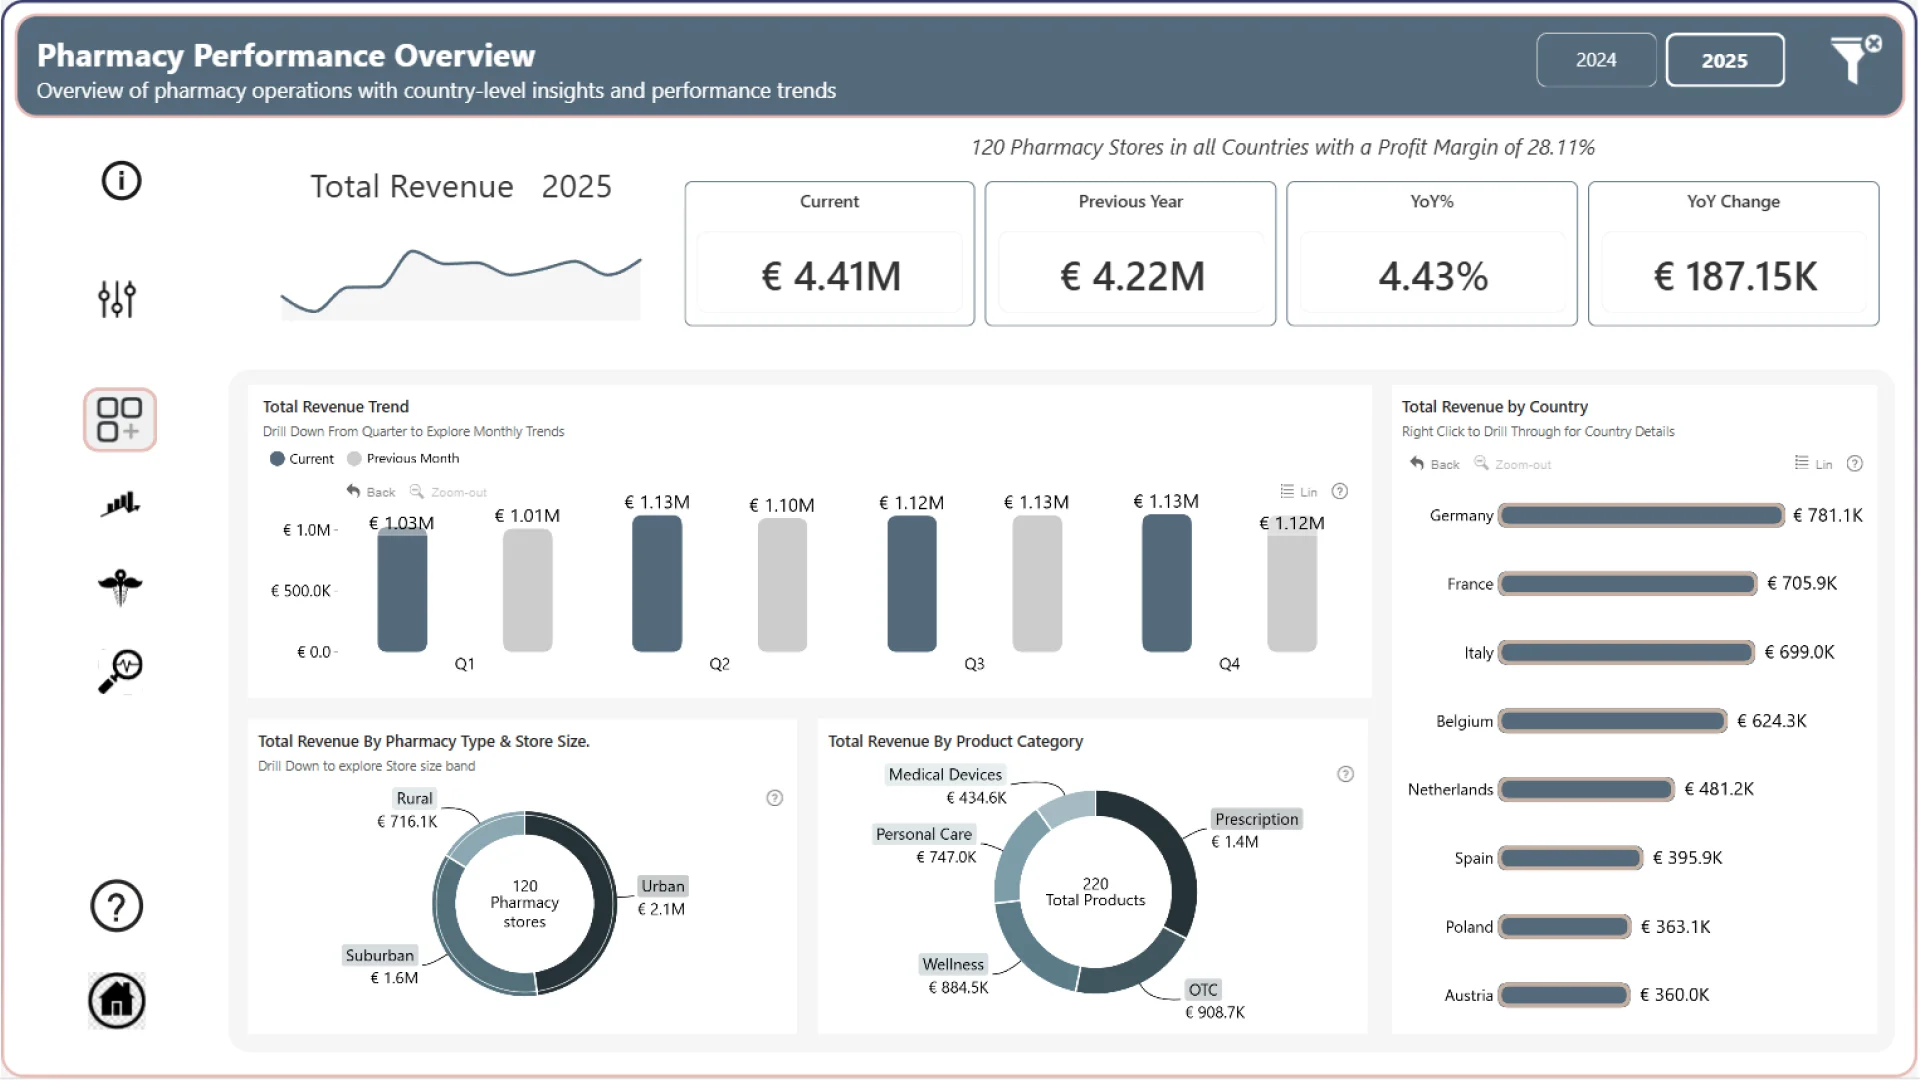
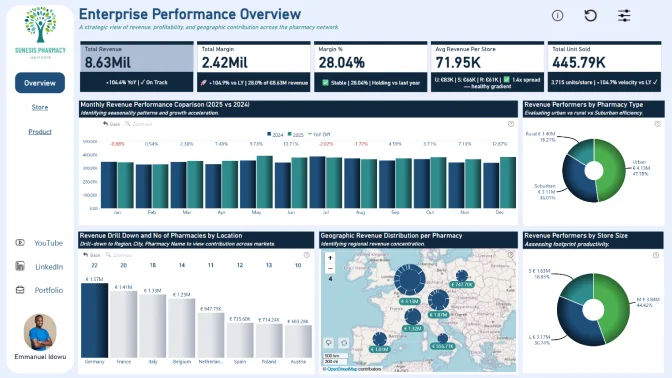
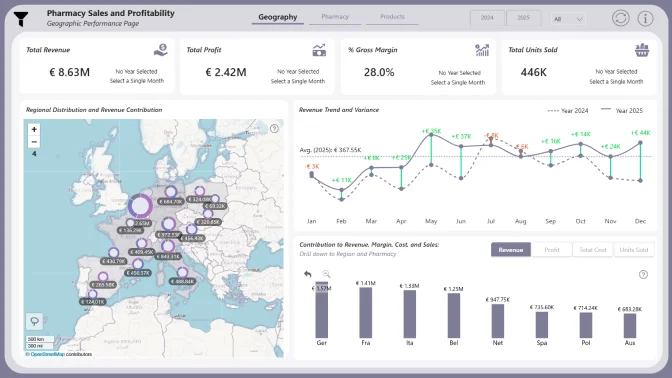
The Pharmacy Sales & Profitability Analytics Report analyzes performance across 120 pharmacy stores in 8 European markets, comparing 2025 with 2024. Revenue increased by 4.4% year over year to €4.41M, while profit margins remained stable at approximately 28%, although efficiency varies across geographies and store types. Germany, France, and Italy lead in sales volume, while Austria and Belgium demonstrate stronger margin efficiency; urban pharmacies drive nearly half of total revenue (€2.1M, 48%), whereas rural and newer stores achieve higher margins despite lower volumes. A product velocity framework segments items into slow movers, core movers, and fast movers to identify optimization opportunities, revealing that profitability is uneven across products and locations. The report uses calculation groups and field parameters to enable dynamic KPI switching within a streamlined, executive-friendly interface.
ZoomCharts visuals used
4U Report Challenges
Participate in data challenges, build and submit reports to get free template downloads.
Join CommunityMobile view allows you to interact with the report. To Download the template please switch to desktop view.

Was this helpful? Thank you for your feedback!
Sorry about that.
How can we improve it?