492
Pharma Sales Power BI Report 7
Pharma Sales Power BI Report 7
Report Author: Gad Shoaib
492
Share template with others
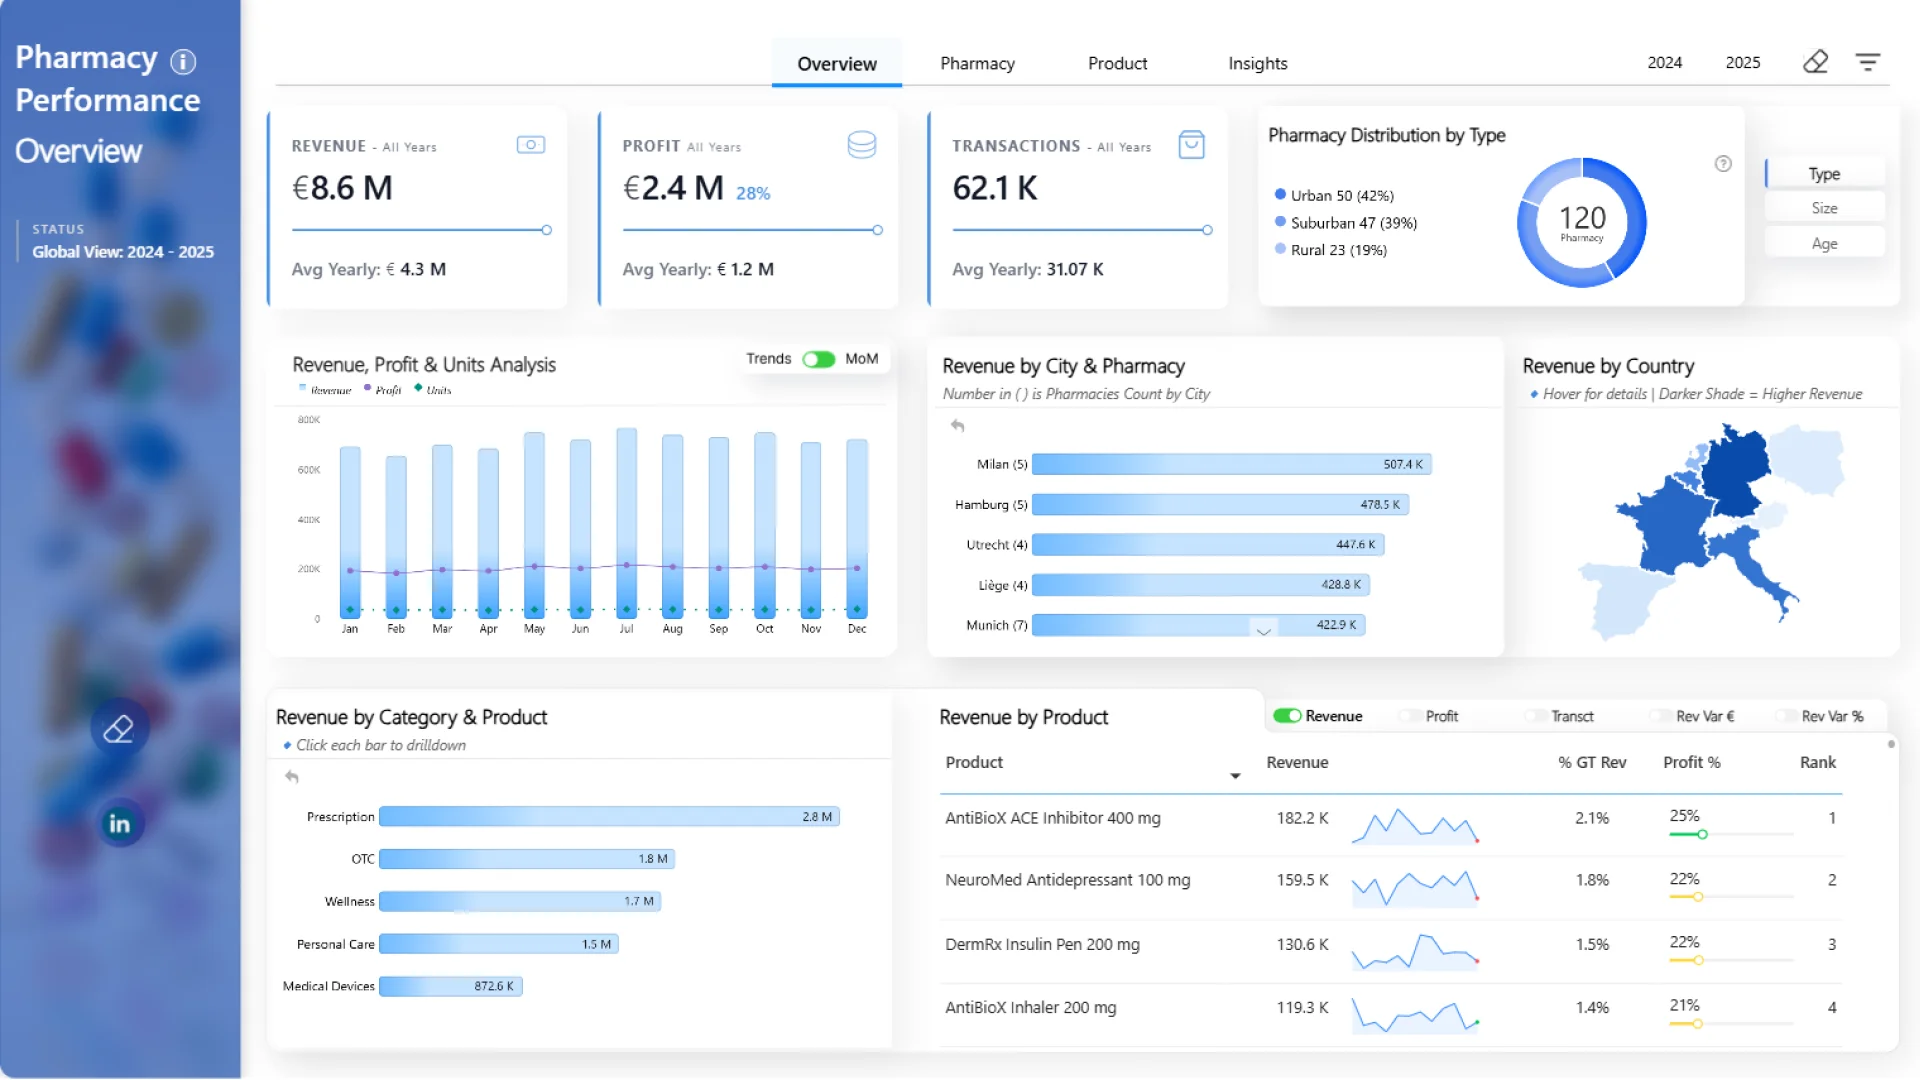
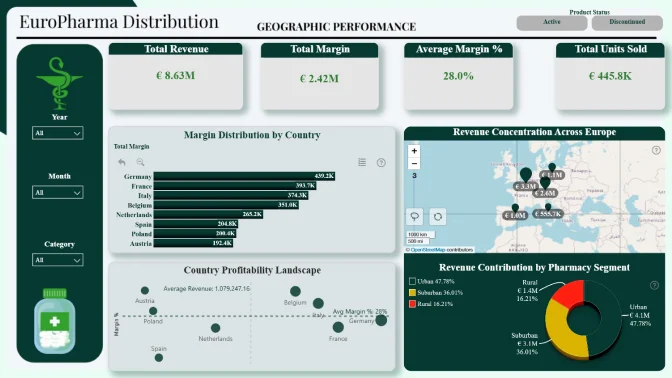
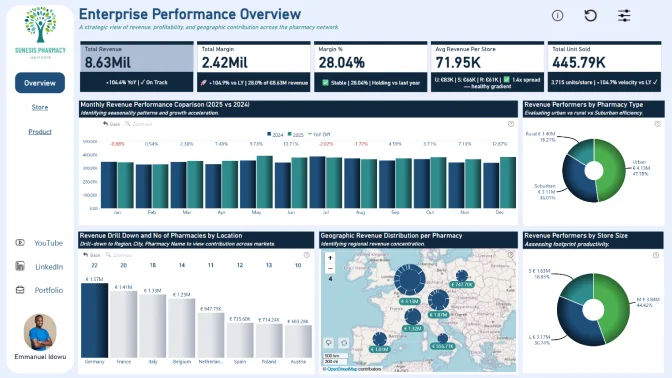
This Power BI report uses the Pharmacy Sales and Profitability dataset. The report features ZoomCharts Drill Down PRO custom visuals for Power BI. It was submitted to the Onyx Data DataDNA ZoomCharts Mini Challenge in January - February 2026.
Author’s Description:
Key Highlights: Granular Drill-Downs: Navigating performance from national trends down to individual pharmacy locations. Profitability Insights: Comparing Urban vs. Rural margins and identifying high-volume, low-margin outliers. Revenue Dynamics: Mapping how seasonality and promotional timing impact the bottom line.
4U Report Challenges
Participate in data challenges, build and submit reports to get free template downloads.
Join CommunityMobile view allows you to interact with the report. To Download the template please switch to desktop view.

Was this helpful? Thank you for your feedback!
Sorry about that.
How can we improve it?