This Power BI report uses the Pharmacy Sales and Profitability dataset. The report features ZoomCharts Drill Down PRO custom visuals for Power BI. It was submitted to the Onyx Data DataDNA ZoomCharts Mini Challenge in January - February 2026.
Author’s Description:
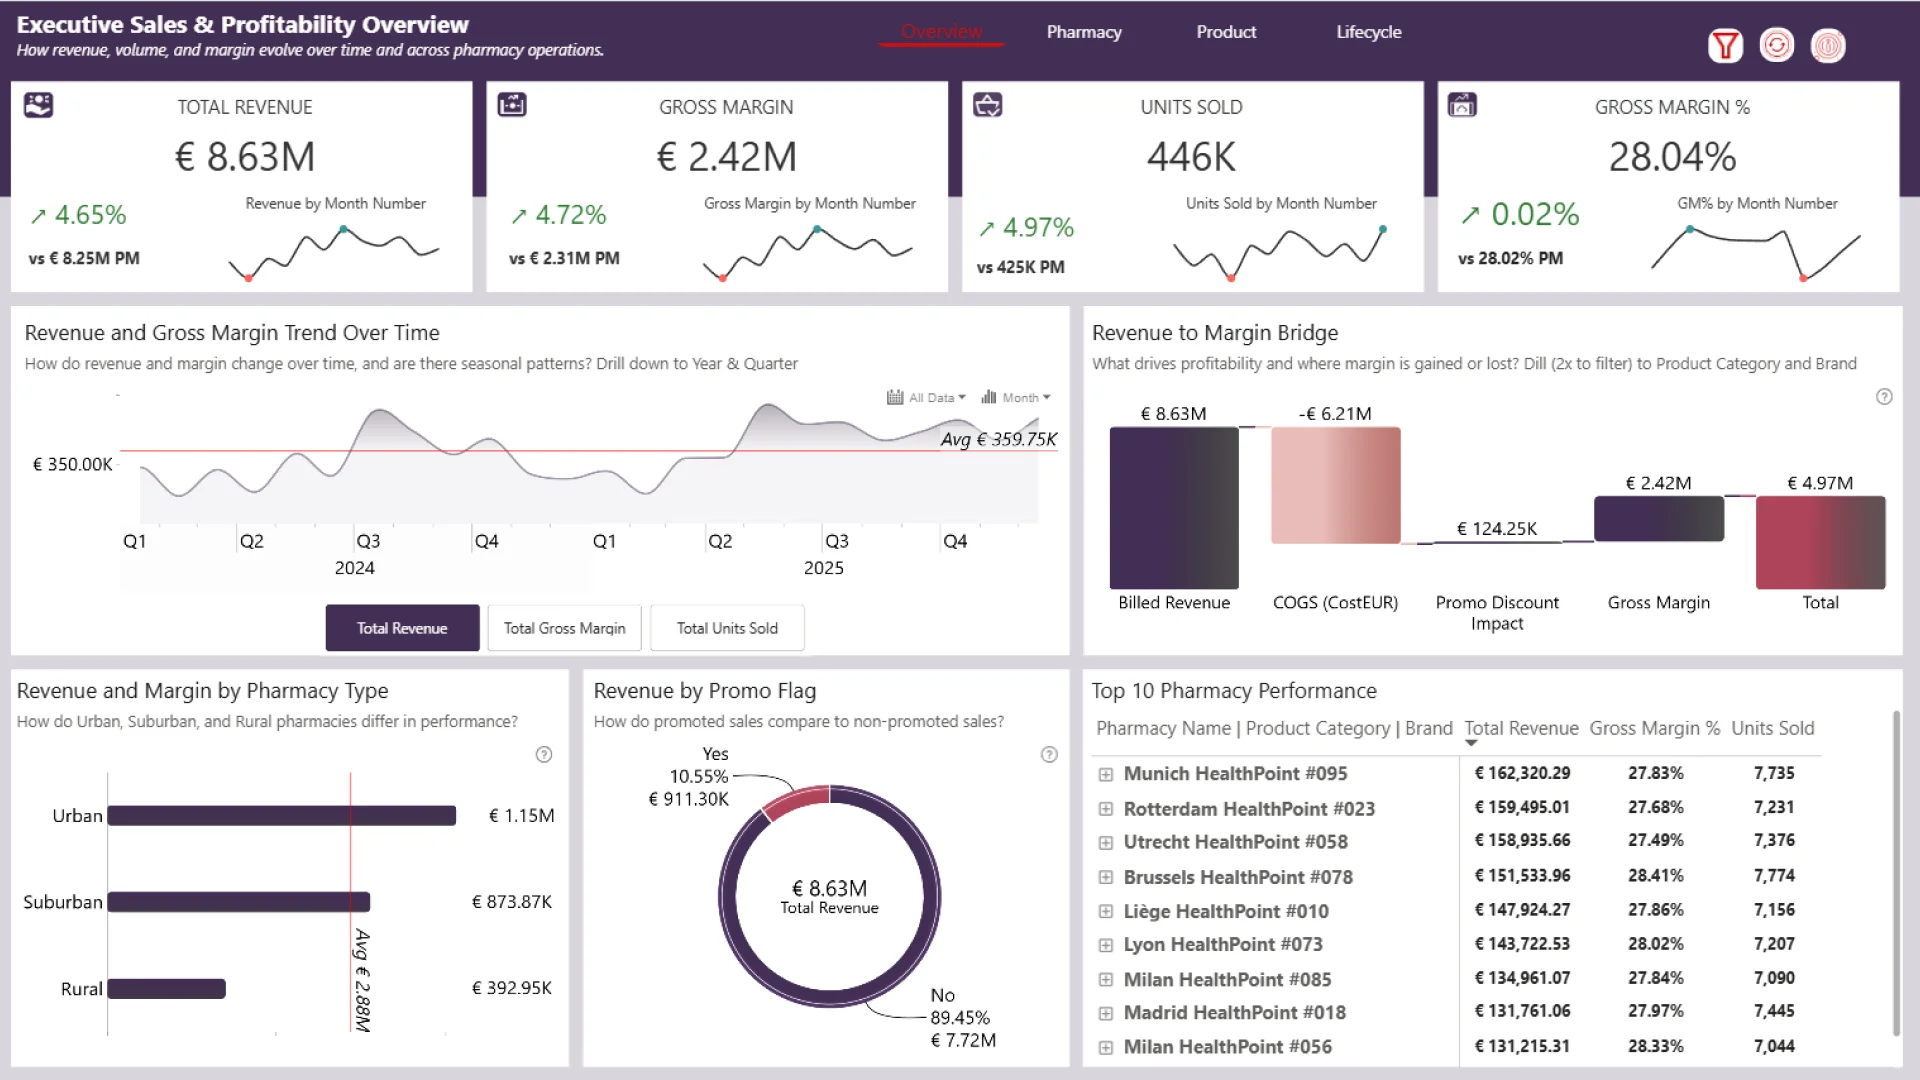
This report consists of four structured pages designed to analyze sales and profitability from multiple business perspectives. The Overview page presents executive KPIs, month-over-month trends, margin drivers, promotional impact, and performance comparisons across pharmacy types. The Pharmacy page evaluates geographic contribution, benchmarks top and bottom performers, and identifies regional performance gaps across countries and individual stores. The Product page analyzes category and brand profitability, volume–margin trade-offs, and pricing dynamics, while the Lifecycle page examines product launch timing, age performance, and portfolio sustainability to assess long-term value creation. Together, these pages provide a comprehensive, data-driven view of revenue drivers, operational efficiency, and profitability optimization opportunities.