692
Pharma Sales Power BI Dashboard 13
Pharma Sales Power BI Dashboard 13
Report Author: Admire Masaga
692
Share template with others
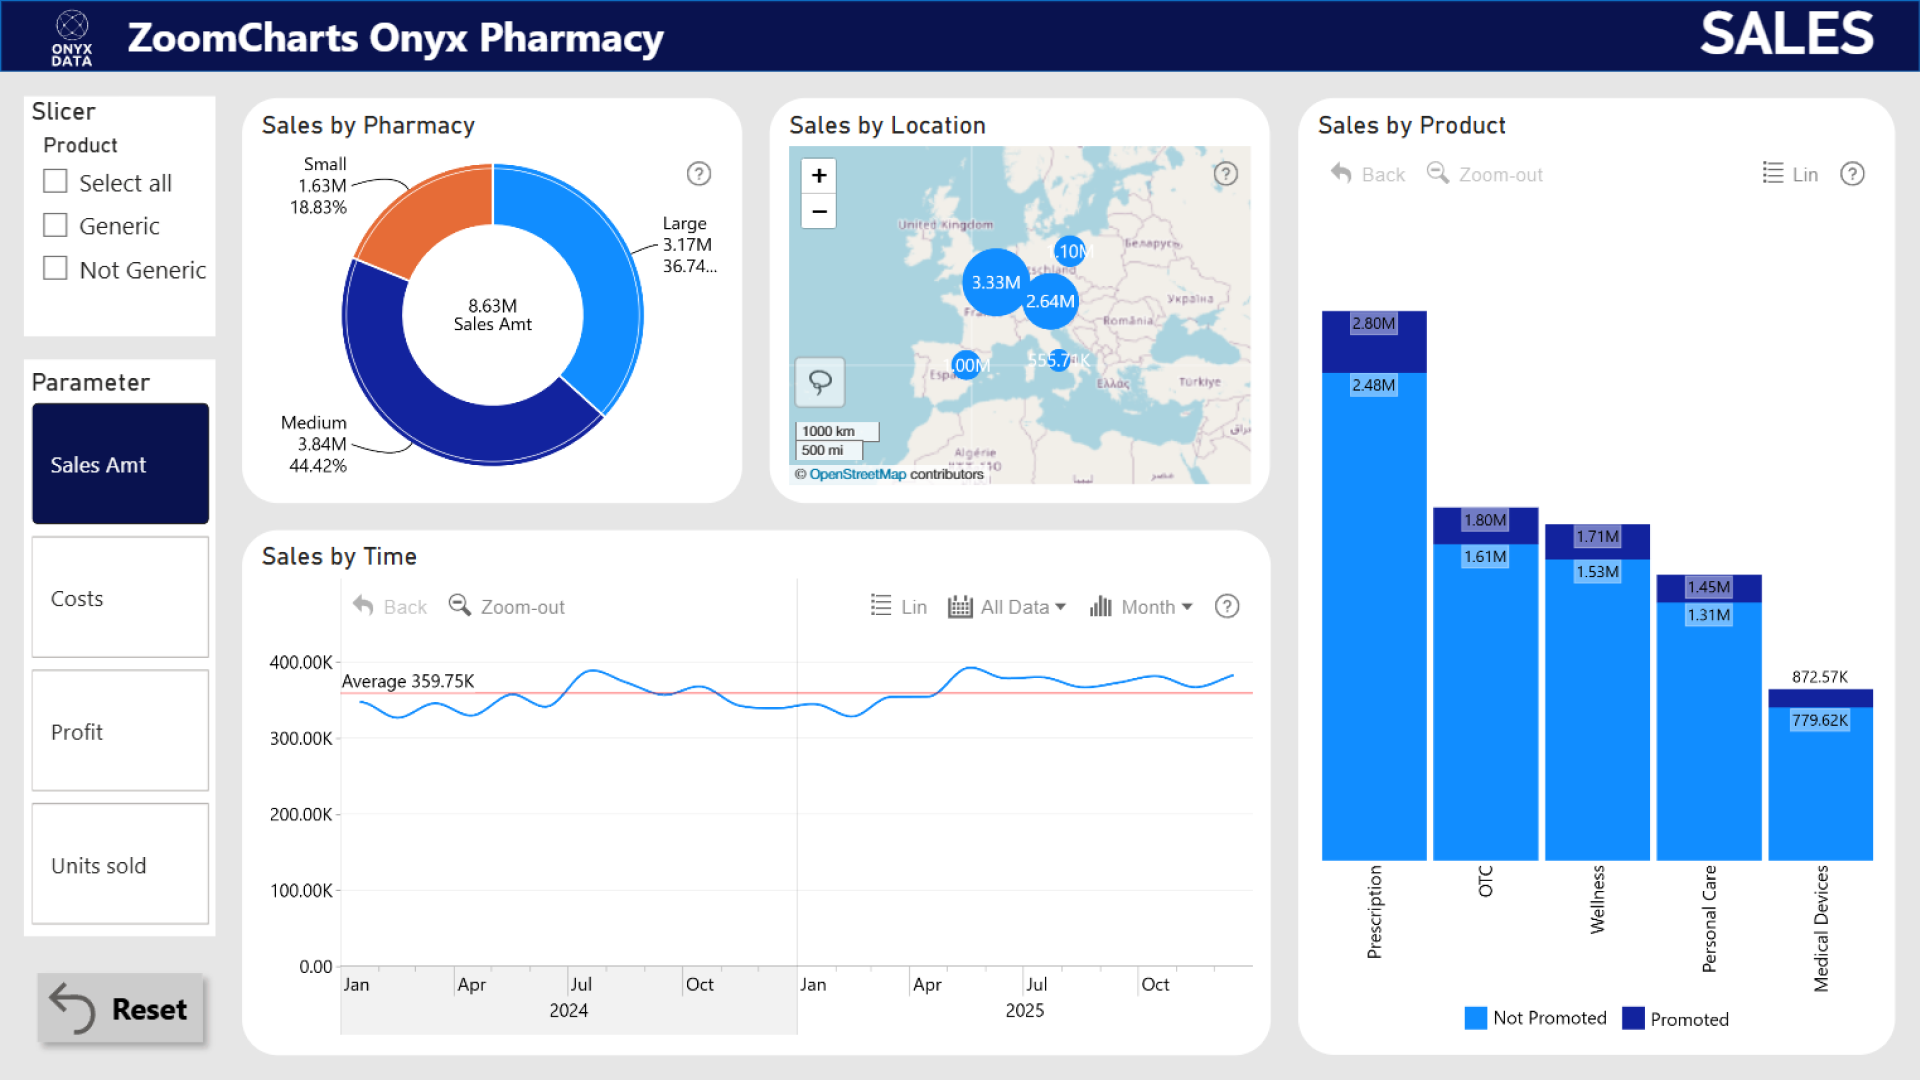
This Power BI report uses the Pharmacy Sales and Profitability dataset. The report features ZoomCharts Drill Down PRO custom visuals for Power BI. It was submitted to the Onyx Data DataDNA ZoomCharts Mini Challenge in January - February 2026.
Author’s Description:
Pharmacy operations generate large volumes of data, but the real challenge lies in identifying what truly drives profitability. This dashboard acts as a strategic compass, transforming raw sales data into a clear and actionable visual narrative across revenue, inventory, costs, and profitability for a multi-country European distributor. By combining high-level KPIs with ZoomCharts drill-down visuals and detailed interactive analysis, stakeholders can seamlessly move from executive summaries to granular insights across pharmacies, regions, products, and time. The analysis highlights that medium-sized pharmacies generate 44.42% of total €8.63M revenue, Prescription products lead sales with strong non-promoted demand, and performance is concentrated in Central Europe, particularly in Germany and France. Built using Power BI, Power Query, DAX, and ZoomCharts custom visuals, the report supports a shift from static reporting to dynamic, insight-driven decision-making.
ZoomCharts visuals used
4U Report Challenges
Participate in data challenges, build and submit reports to get free template downloads.
Join CommunityMobile view allows you to interact with the report. To Download the template please switch to desktop view.

Was this helpful? Thank you for your feedback!
Sorry about that.
How can we improve it?