567
Operations Analytics Report for an Animal Shelter 4
Operations Analytics Report for an Animal Shelter 4
Report Author: Shivani Nirmal
567
Share template with others
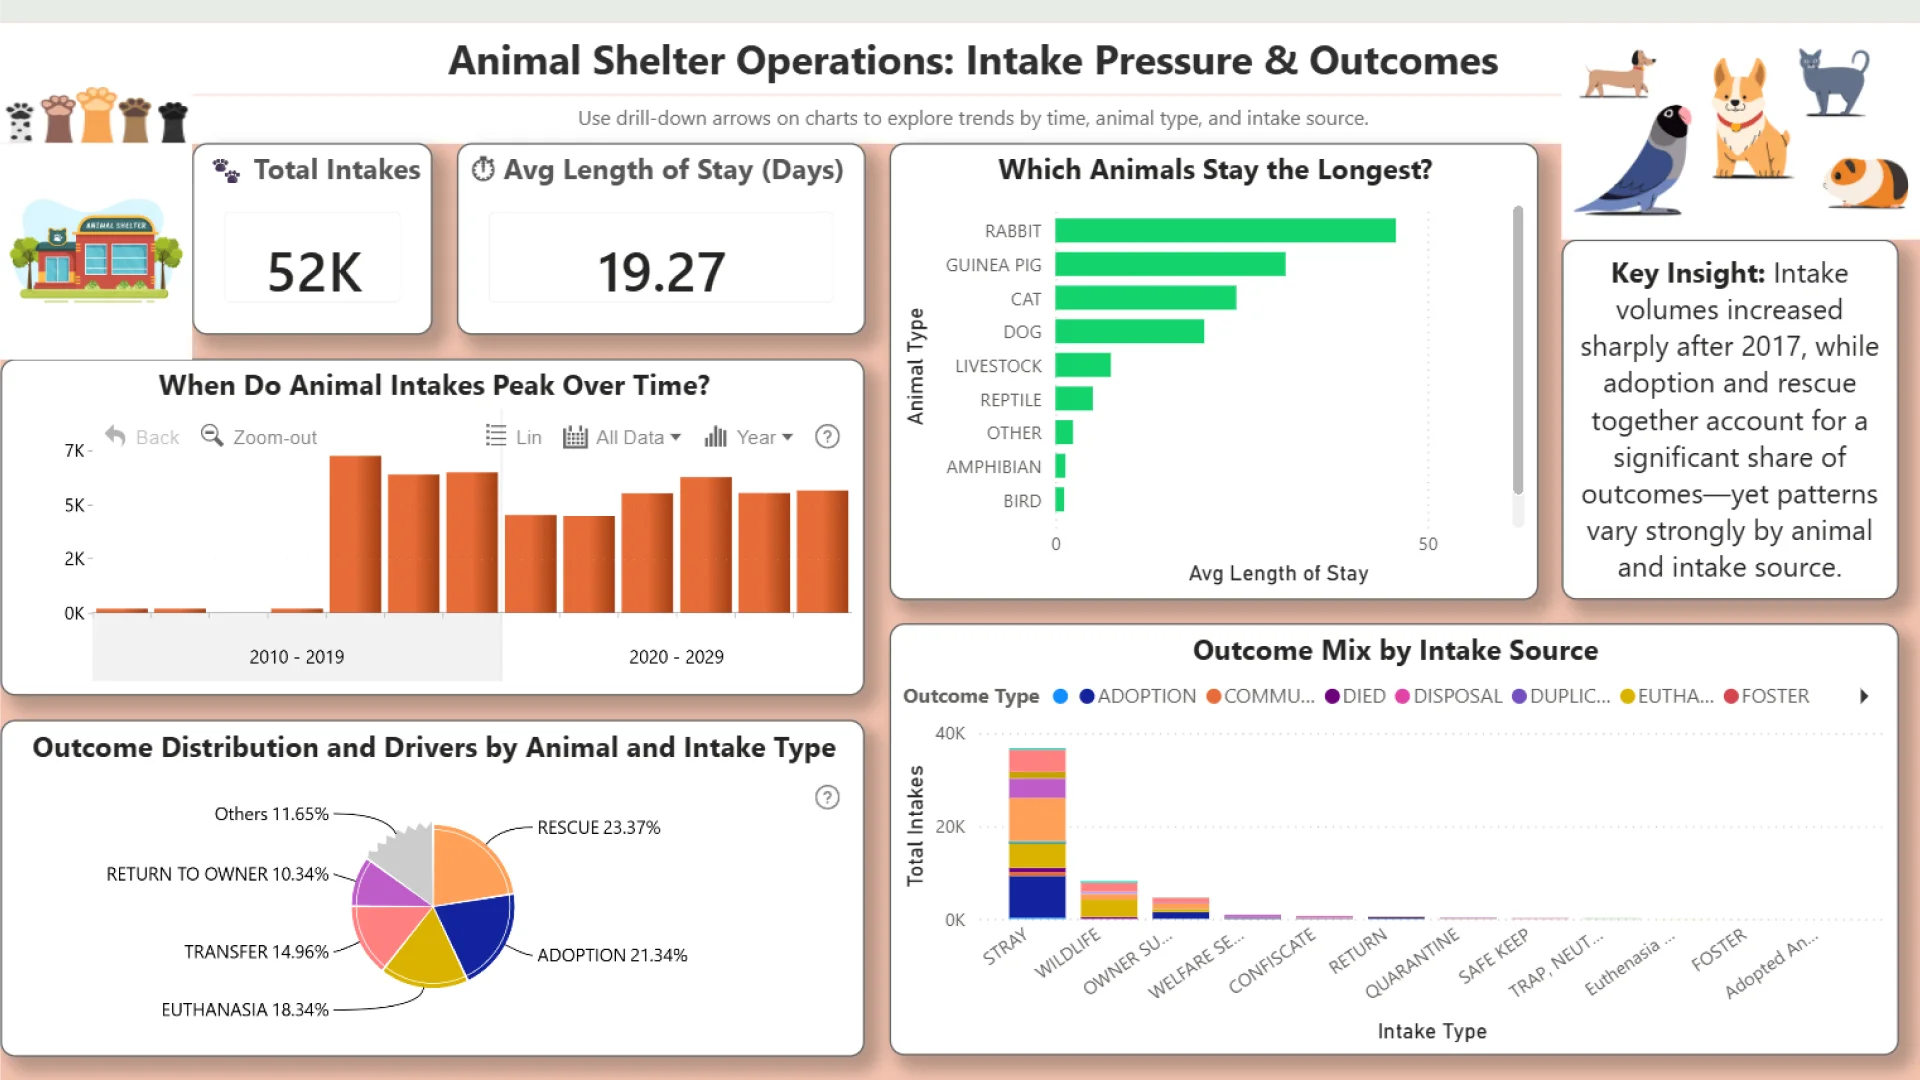
This Power BI report uses the Animal Shelter Operations dataset from the City of Long Beach Animal Care Services, US. The report features ZoomCharts Drill Down PRO custom visuals for Power BI. It was submitted to the Onyx Data DataDNA ZoomCharts Mini Challenge in December 2025.
Author's Description:
This Power BI report analyzes animal shelter operations with a focus on intake trends, length of stay, and outcome distributions. Using interactive ZoomCharts visuals, the dashboard explores seasonal intake patterns, long-stay animal profiles, and how intake sources influence adoption, rescue, and risk outcomes. The report supports data-driven insights to improve shelter capacity planning and animal welfare outcomes.
4U Report Challenges
Participate in data challenges, build and submit reports to get free template downloads.
Join CommunityMobile view allows you to interact with the report. To Download the template please switch to desktop view.

Was this helpful? Thank you for your feedback!
Sorry about that.
How can we improve it?