logo
For Power BI
  • Products
    • Custom Visuals for Power BI
    • Report Templates
  • Resources

      Resources

    • Documentation
    • Report Examples
    • Blog
    • Webinars
    • Video Tutorials
    • Visuals Gallery

    Support

    • ZoomCharts Assistance
    • Contact Sales
    • Contact Support
    • FAQ

    Challenges

    Challenges

    Improve your report creation skills by participating in free challenges for report creators.

    Learn more
    Get Developer License
  • Services
    • Power BI Report Development
    • Custom Visual Development
  • Challenges
  • Pricing
    • Custom Visuals for Power BI
    • Report Templates
Subscribe
Subscribe
Get it now
Go back

Contents

Contest logo
Contest logo
Contest logo
Contest logo
Try Free Now
Go back

Onyx Data May 2024 Challenge

Report Author: Maria Neves

218

Onyx Technical Support Analysis Maria Neves

Report
Report Interact

Combo Combo Bar Timeline Map Donut Support Customer experience Project Management

Share template with others

Report submitted for Onyx Data DataDNA ZoomCharts Mini Challenge, May 2024. The report was built based on Tech Support Analysis dataset and includes ZoomCharts custom Drill Down PRO visuals for Power BI. 

Author's description:
Insights:
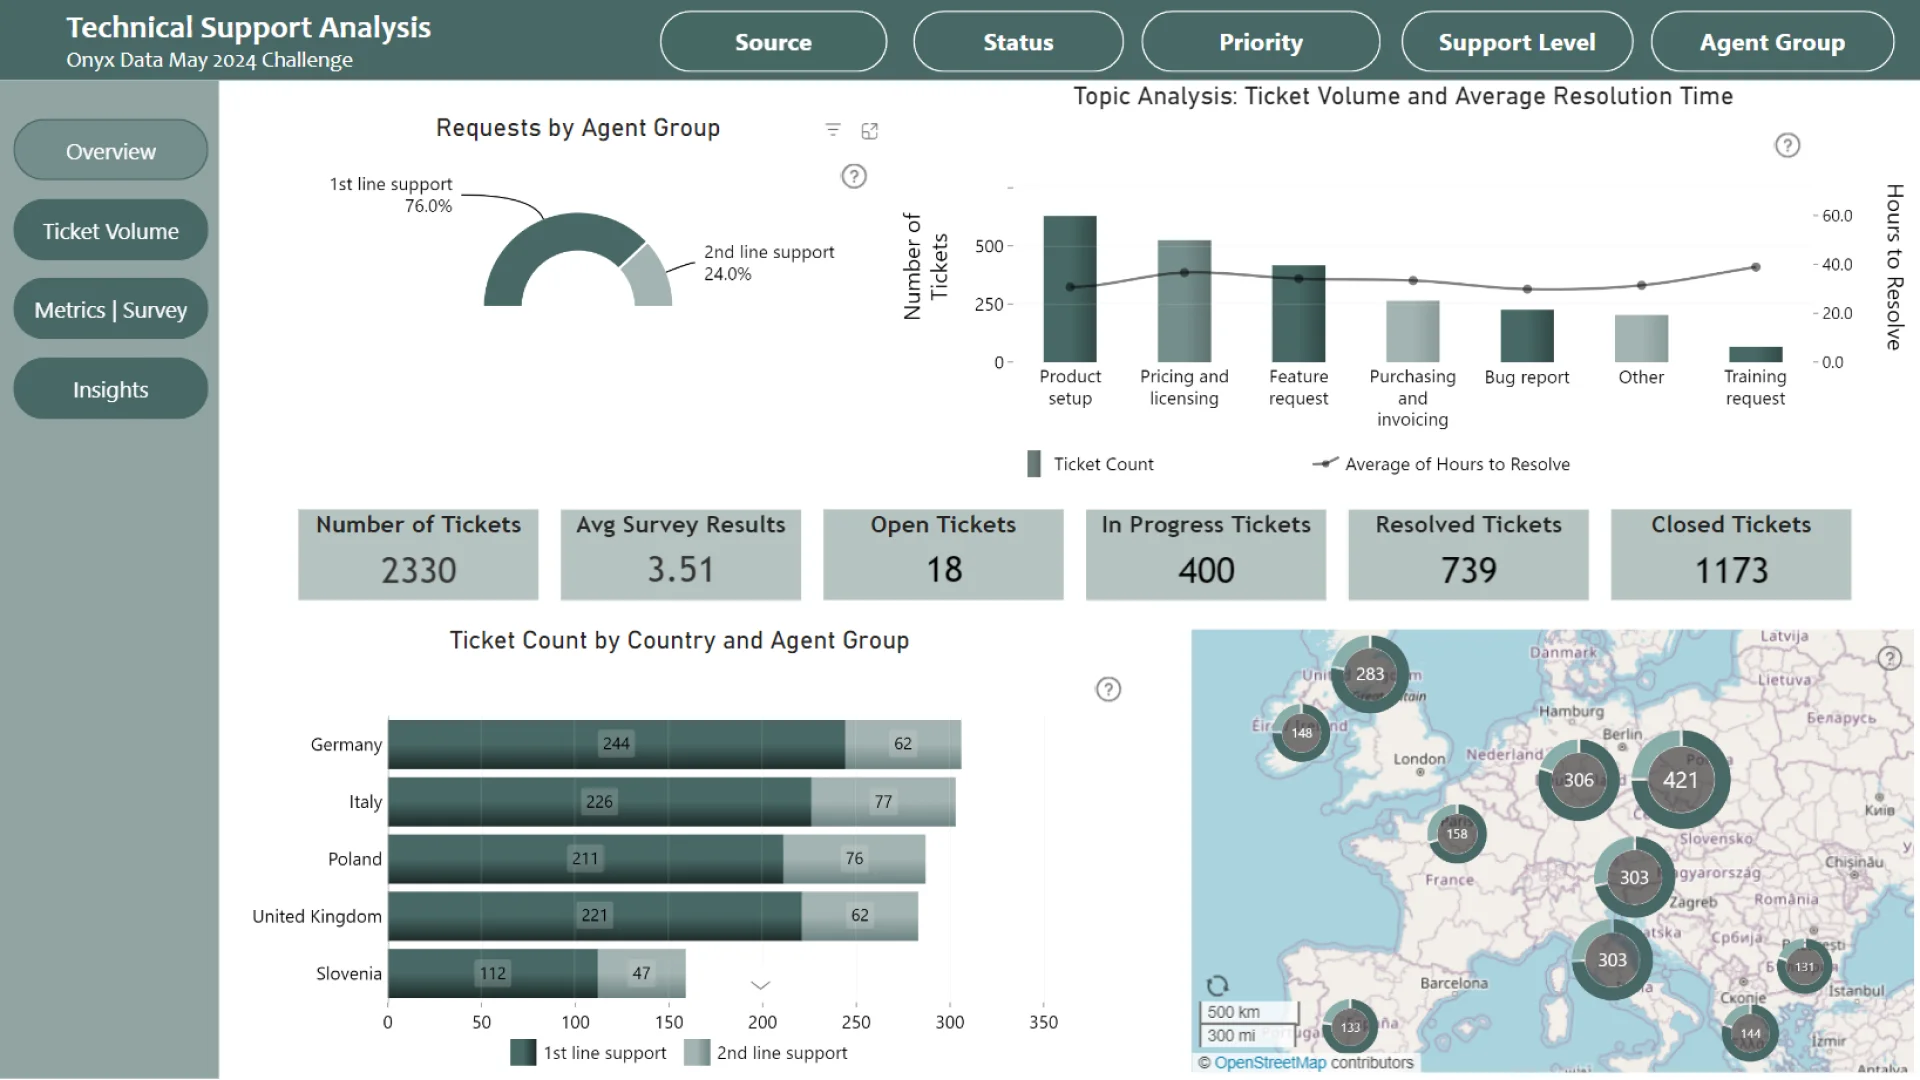
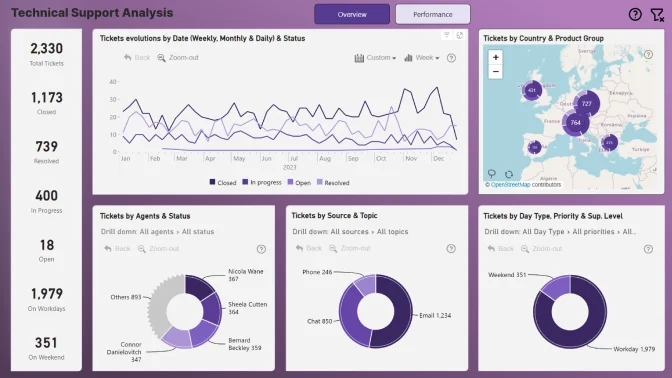
Ticket Analysis: The highest number of tickets are for "Product Setup", "Pricing and Licensing", as well as "Feature Requests". The largest proportion of ticket submissions originated from Germany, Italy, and Poland. Email and chat have the highest number of ticket submissions, suggesting a need for optimizing resources and specialization, particularly in service reception support by phone. Tickets requiring more time to resolve are related to "Training Requests" and "Pricing and Licensing".

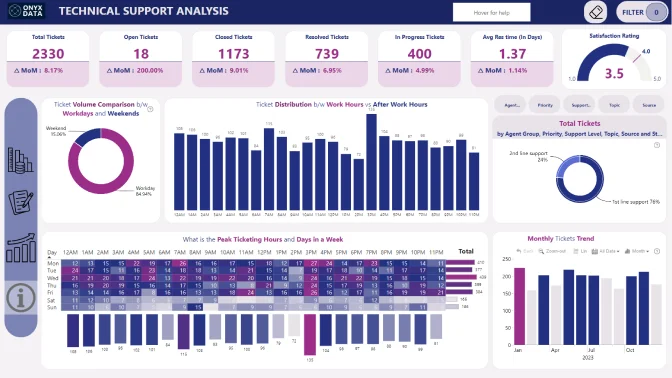
Customer Satisfaction and Agent Performance: The average customer satisfaction score is 3.51, indicating a need for improvement. Customers are most satisfied with resolutions related to "Purchasing and invoicing" and "Bug report" topics. Agents in 1st-line support have received the highest customer satisfaction ratings. Some agents, like Michele Whyatt, have a better performance rate for first response, while others like Connor Danielovitch, Kristos Westoll, Bernard Beckly, and Nicola Wane, need to improve their resolution rate or the agents could be overloaded since they have a high number of tickets.

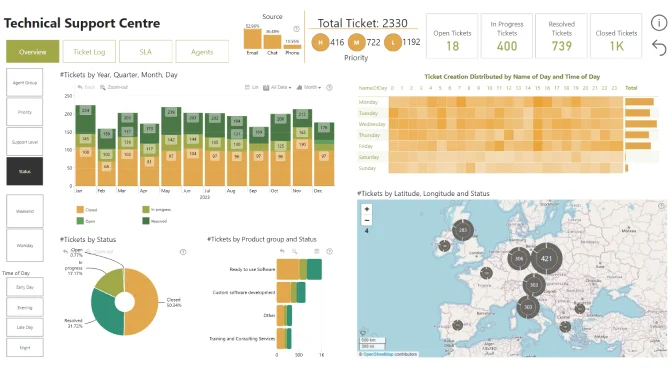
Ticket Lifecycle: Most tickets are closed or resolved, with only 0.8% remaining open and 17.2% in progress. January, May, and November are the months with the highest ticket volume, while February and September have the lowest. The peak hours of ticket creation are at 3 pm and 7 am, with a higher number of tickets after hours. Weekends have fewer tickets compared to weekdays, with Wednesday having the highest ticket volume.

SLA Performance: The difference between the real-time and expected time for the first response is lower, about 7 minutes per month. The resolution time has a difference of about 6 hours. There is a higher percentage of SLA violations in the resolution time than in the SLA first response. The real-time response times are close to the expected times, which is good. However, there are more SLA violations for resolution times, showing a problem in closing tickets. To fix this, we should make the resolution process more efficient and consider giving more help to agents with heavy workloads. This could improve our overall SLA compliance.

ZoomCharts visuals used

Drill Down Combo PRO Drill Down Combo PRO
Drill Down Combo Bar PRO Drill Down Combo Bar PRO
Drill Down Map PRO Drill Down Map PRO
Drill Down Timeline PRO Drill Down Timeline PRO
Drill Down Donut PRO Drill Down Donut PRO

Need help?

Send your question to ZoomCharts assistant, and we will respond to you as soon as possible.

Contact Us

Mobile view allows you to interact with the report. To Download the template please switch to desktop view.

Report Overhaul

ZoomCharts Academy

Learn ZoomCharts with experts and become certified!

Go to Academy!
Report Overhaul

Was this helpful? Thank you for your feedback!

Sorry about that.

How can we improve it?

Onyx Technical Support Analysis Maria Neves

Share

ZoomCharts

Welcome to ZoomCharts

You’re almost there! Create an account to keep your saved reports.

or
Sign up with Microsoft

Verify your email address

We have sent a code to your email address. Please input the code below.

Didn't receive code? Request again (after 30 seconds)

Already have an account? Log in

ZoomCharts

Log in to your ZoomCharts account

Log in with Microsoft
or
Forgot password?

Reset your password

We'll email you instructions on how to reset your password

Don't have an account? Sign up

Please add credits

You have 0 available downloads.
Get more credits or upgrade your plan to continue.

View pricing
logo
[email protected]
+44 204 577 3993
logo

Products

Drill Down Network PRO Drill Down Waterfall PRO Drill Down Graph PRO Drill Down Combo PRO Drill Down Combo Bar PRO Drill Down Donut PRO Drill Down Pie PRO Drill Down TimeSeries PRO Drill Down Timeline PRO Drill Down Map PRO Drill Down Scatter PRO All Visuals

Resources

Report Examples Webinars Blog ZoomCharts Academy Visuals Gallery Documentation Custom Visual Development Subscribe to News

Solutions

Custom Visual Development

Company

Pricing About Us Partners Leave feedback Join PowerGroup EU Funding

Help

ZoomCharts Assistance Contact Sales Contact Support FAQ

Drill Down Network PRO Drill Down Waterfall PRO Drill Down Graph PRO Drill Down Combo PRO Drill Down Combo Bar PRO Drill Down Donut PRO Drill Down Pie PRO Drill Down TimeSeries PRO Drill Down Timeline PRO Drill Down Map PRO Drill Down Scatter PRO All Visuals

Report Examples Webinars Blog ZoomCharts Academy Visuals Gallery Documentation Custom Visual Development Subscribe to News

Custom Visual Development

Pricing About Us Partners Leave feedback Join PowerGroup EU Funding

ZoomCharts Assistance Contact Sales Contact Support FAQ
+44 204 577 3993
[email protected]

Ready to get in touch?

Contact our experts with any question about Power BI and ZoomCharts for Free!

Contact us

© 2025, Data Visualization Software Lab

U.S. Patents No. 11,645,343; 11,921,804; 12,346,389

Cookies
Privacy Policy
Global
Legal
Patent
warning

Error message

success

Success info: Done!

ZoomCharts AI Assistant

We noticed you're using an old OS version.

For the best experience, we recommend upgrading to ensure that all website features display correctly.

Cookie settings

We use necessary cookies for site functionality, as well as statistic, marketing, and preference cookies to enhance your experience. For more information and to manage your preferences, please visit our Cookie policy