96
Oil & Gas Business Performance Dashboard
Oil & Gas Business Performance Dashboard
More Report pages
Report Author: Zaher Mahyoub
96
Share template with others
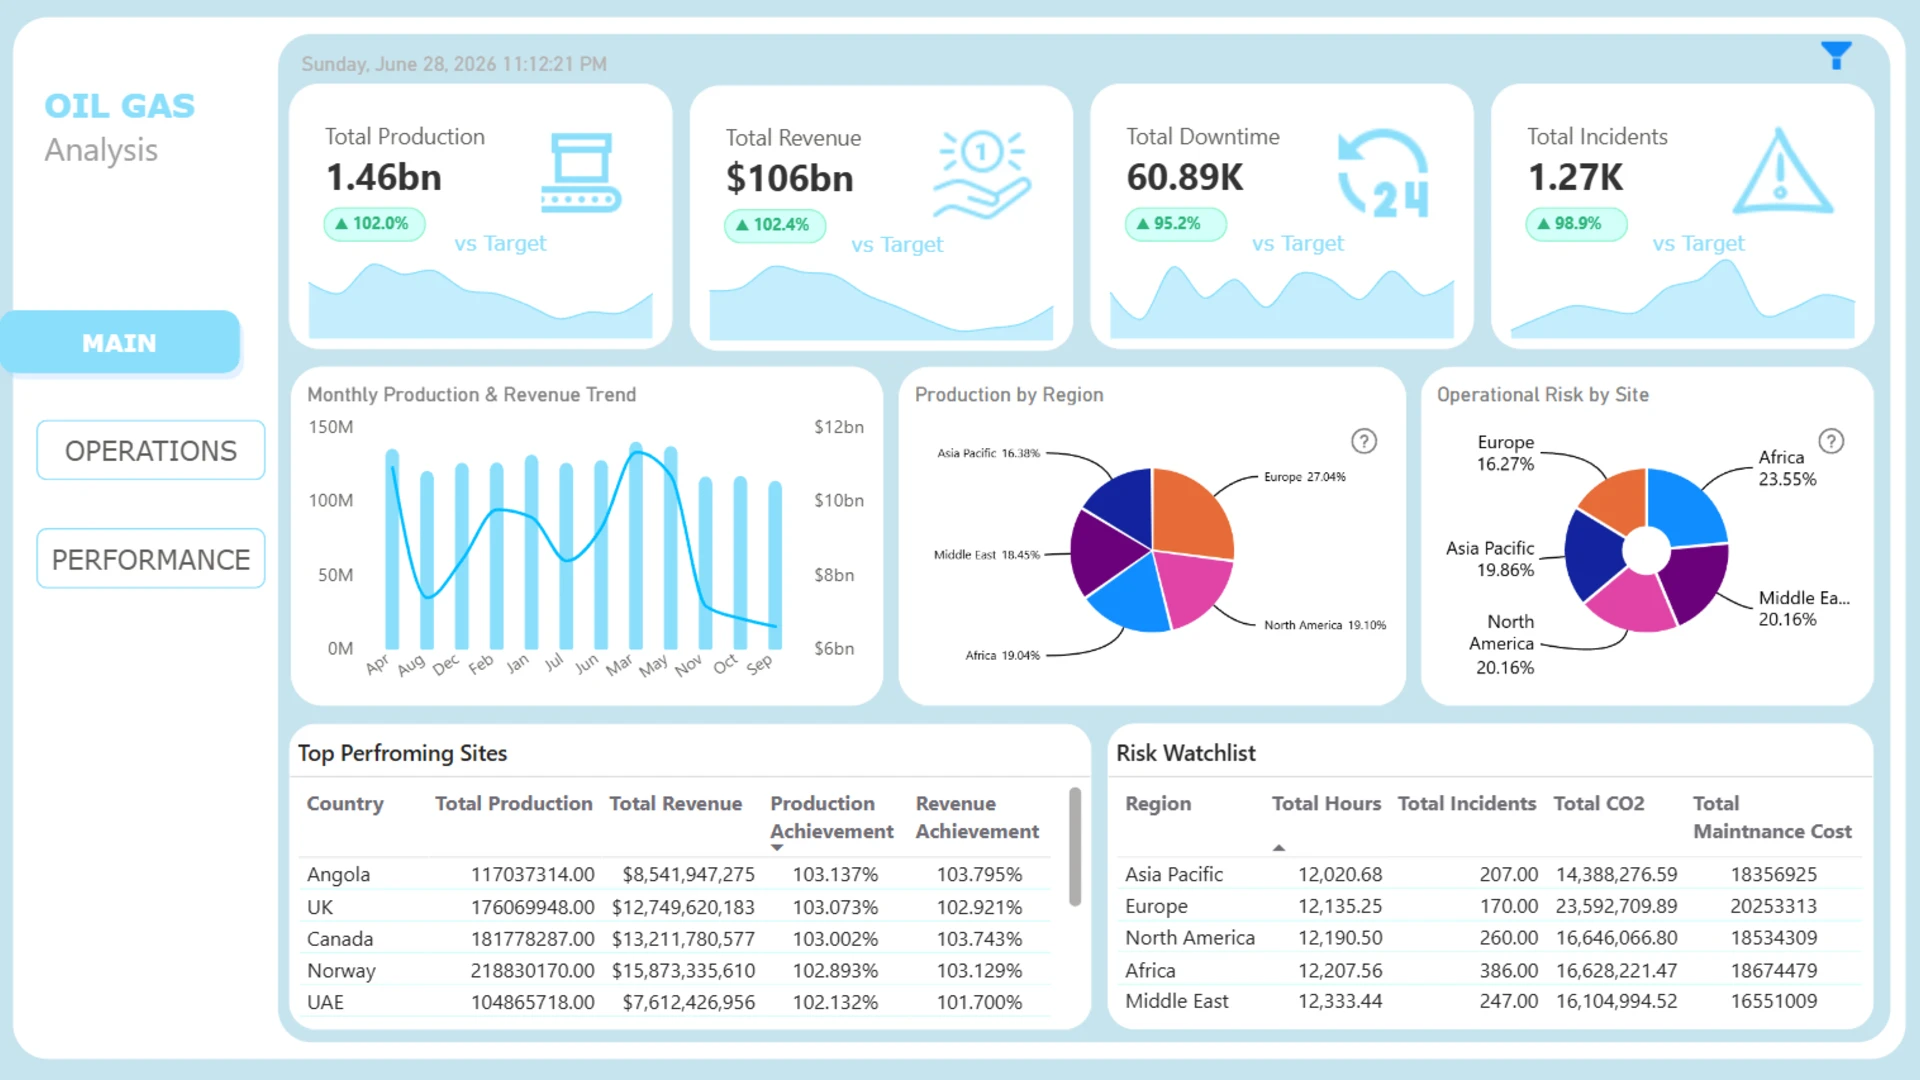
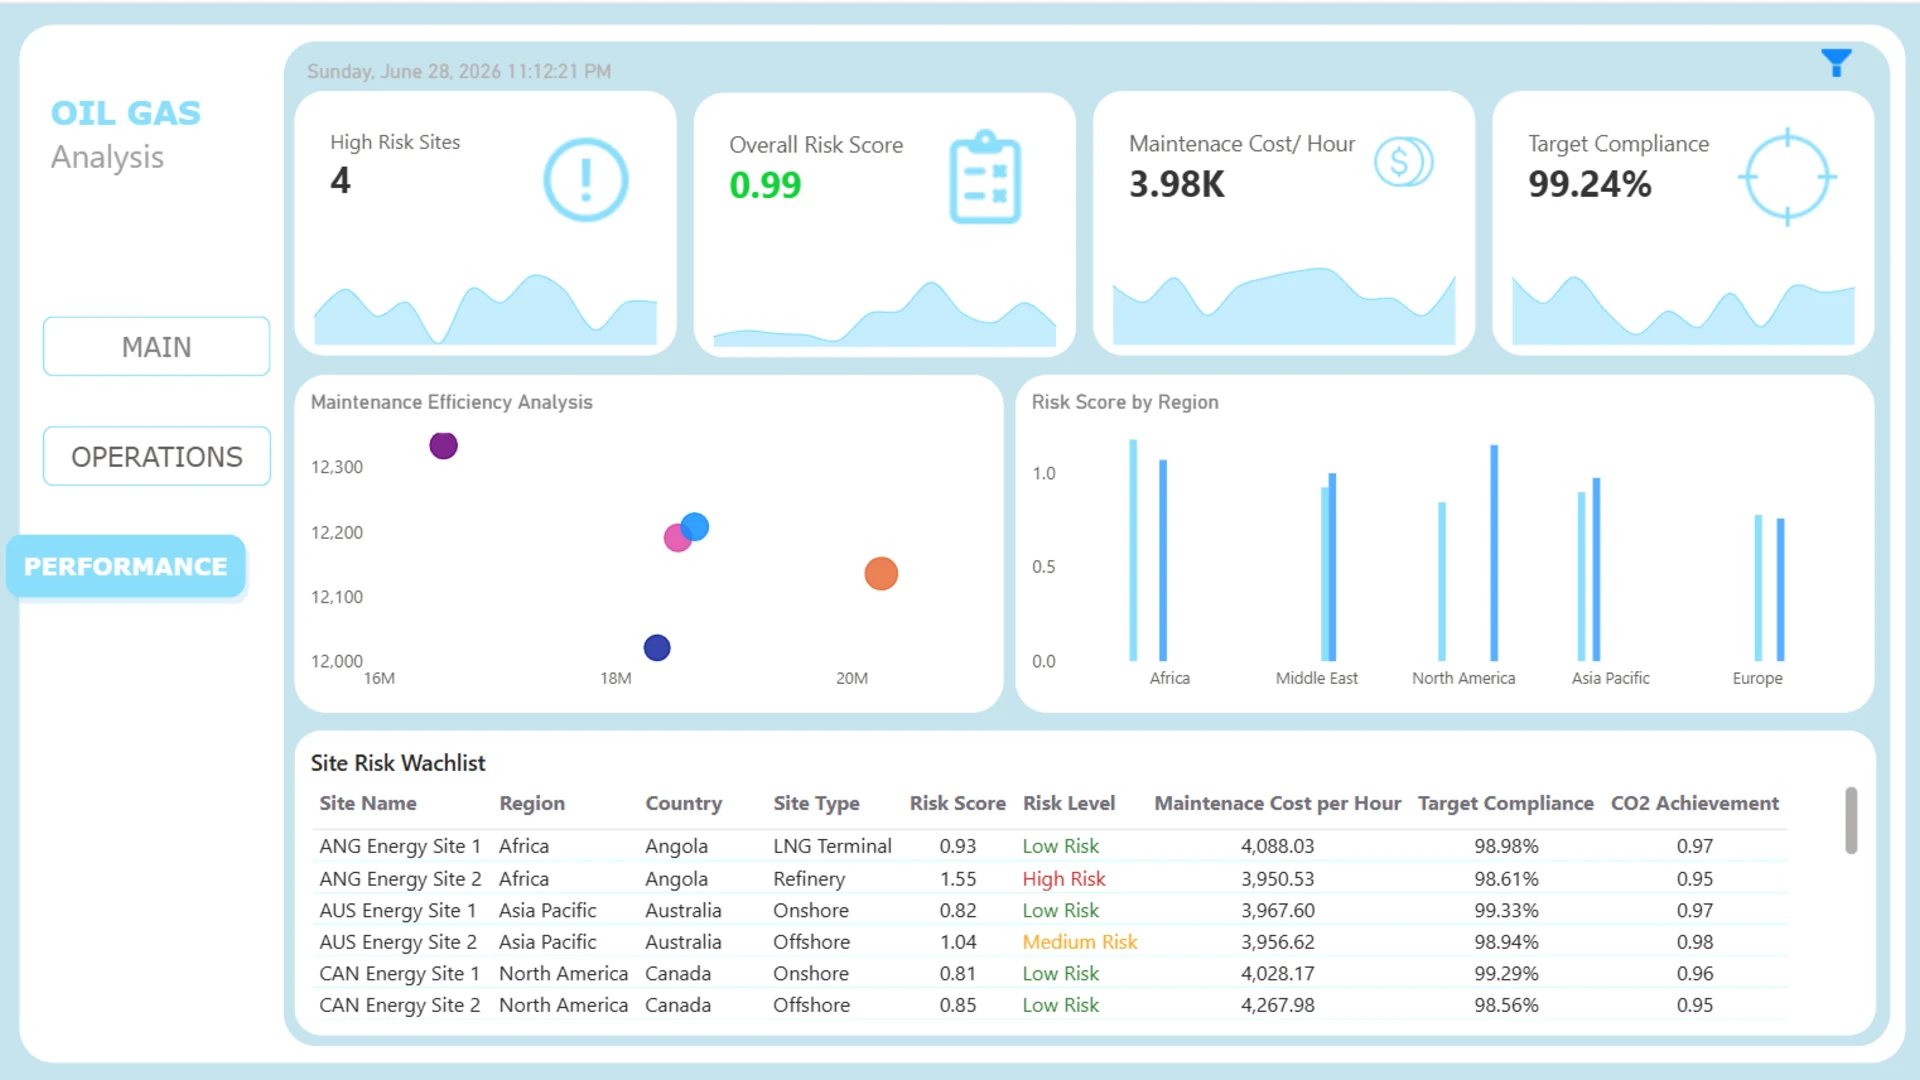
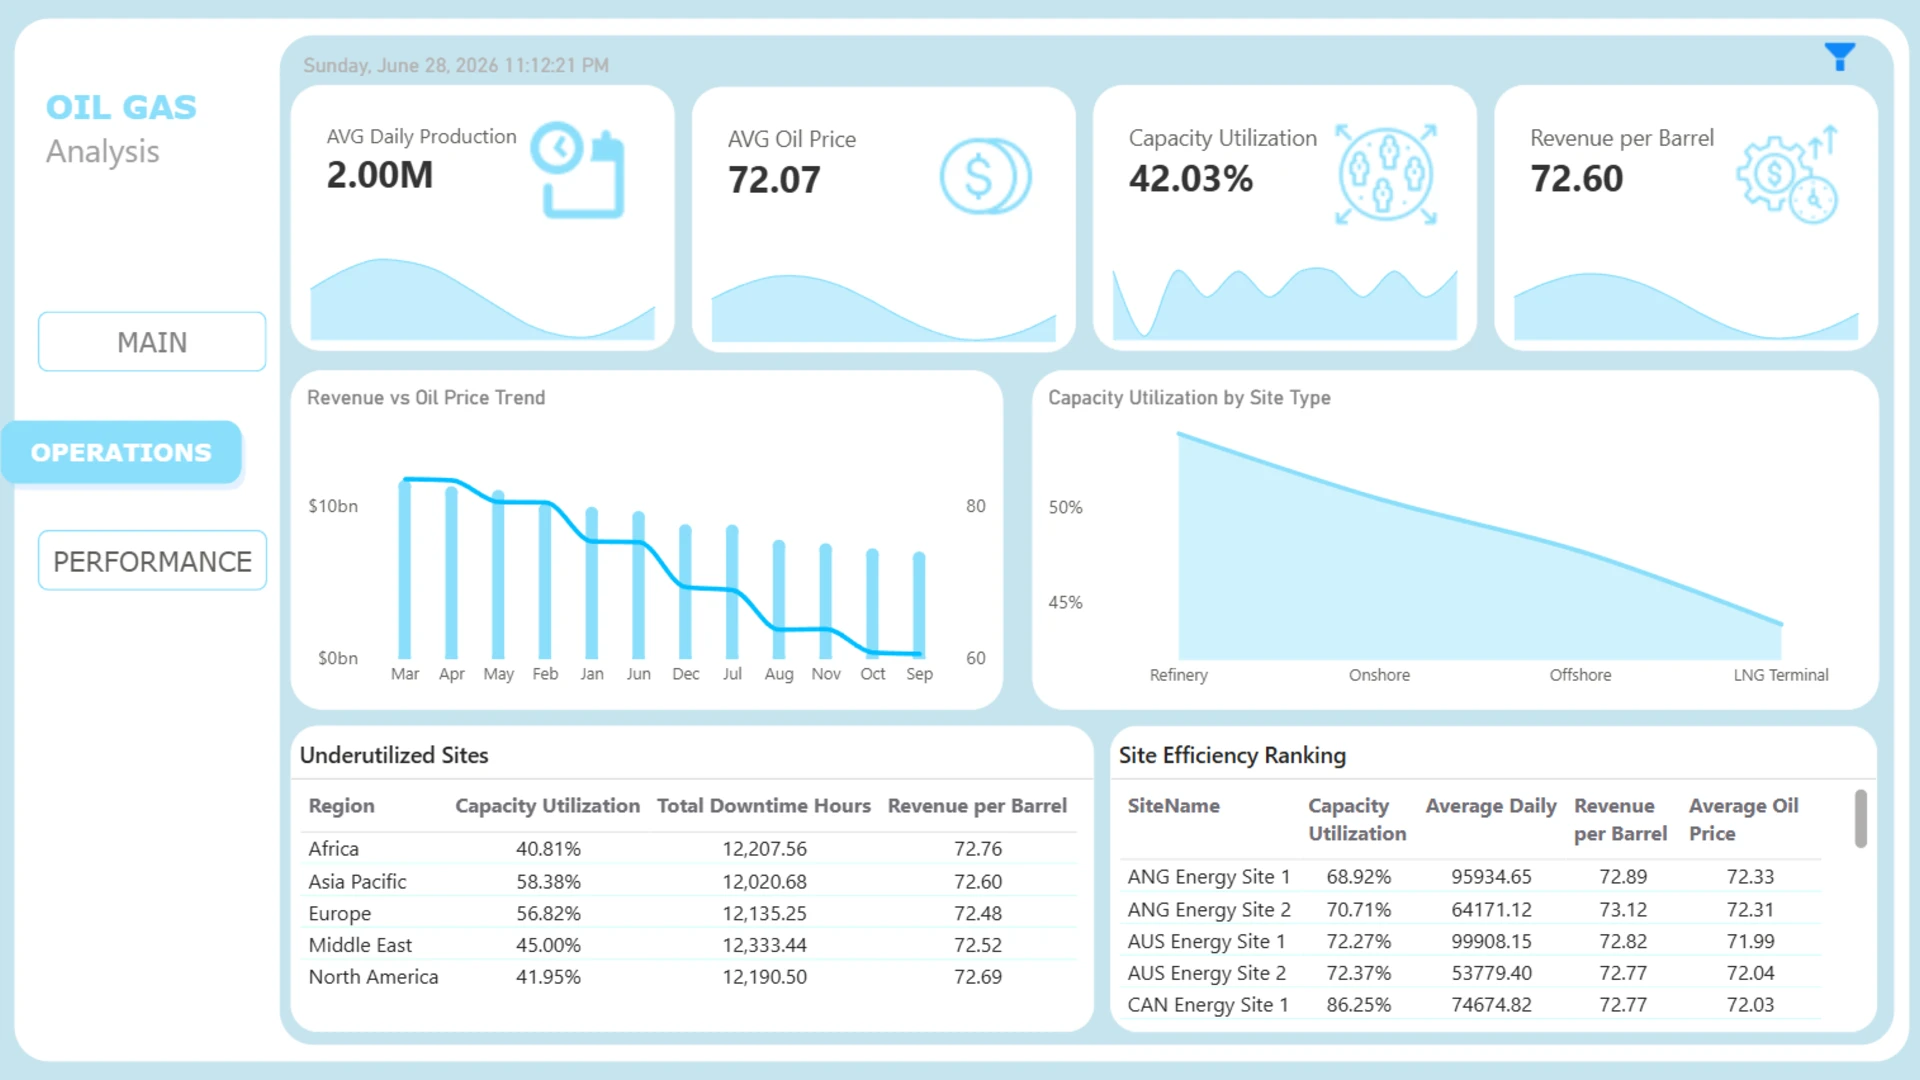
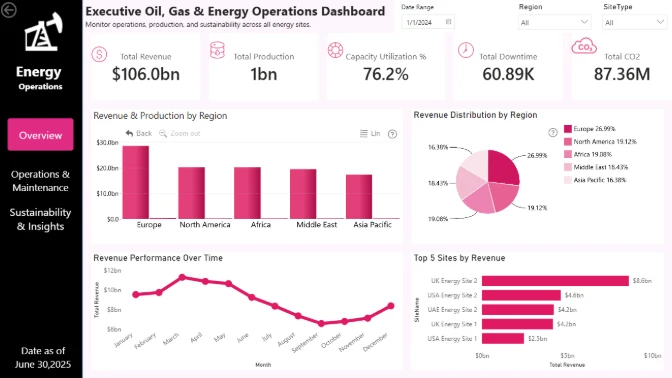
Oil & Gas Energy Business Performance Control Center is an interactive Power BI dashboard that analyzes global energy operations across oil and gas sites. It provides executive insights into production, revenue, operational efficiency, capacity utilization, downtime, safety, emissions, maintenance efficiency, target achievement, and site-level risk. The dashboard helps decision-makers identify high-performing sites, underutilized assets, operational risks, and areas requiring management attention.
This report was created for the ZoomCharts 4U Report Challenge June 2026, where Power BI developers showcase their data visualization expertise by solving real-world business use cases using native Power BI visuals together with ZoomCharts Drill Down Visuals.
4U Report Challenges
Participate in data challenges, build and submit reports to get free template downloads.
Join CommunityMobile view allows you to interact with the report. To Download the template please switch to desktop view.
Was this helpful? Thank you for your feedback!
Sorry about that.
How can we improve it?