224
Interactive Oil & Gas Operations Report
Interactive Oil & Gas Operations Report
More Report pages
Report Author: Ruchitha Sukka
224
Share template with others
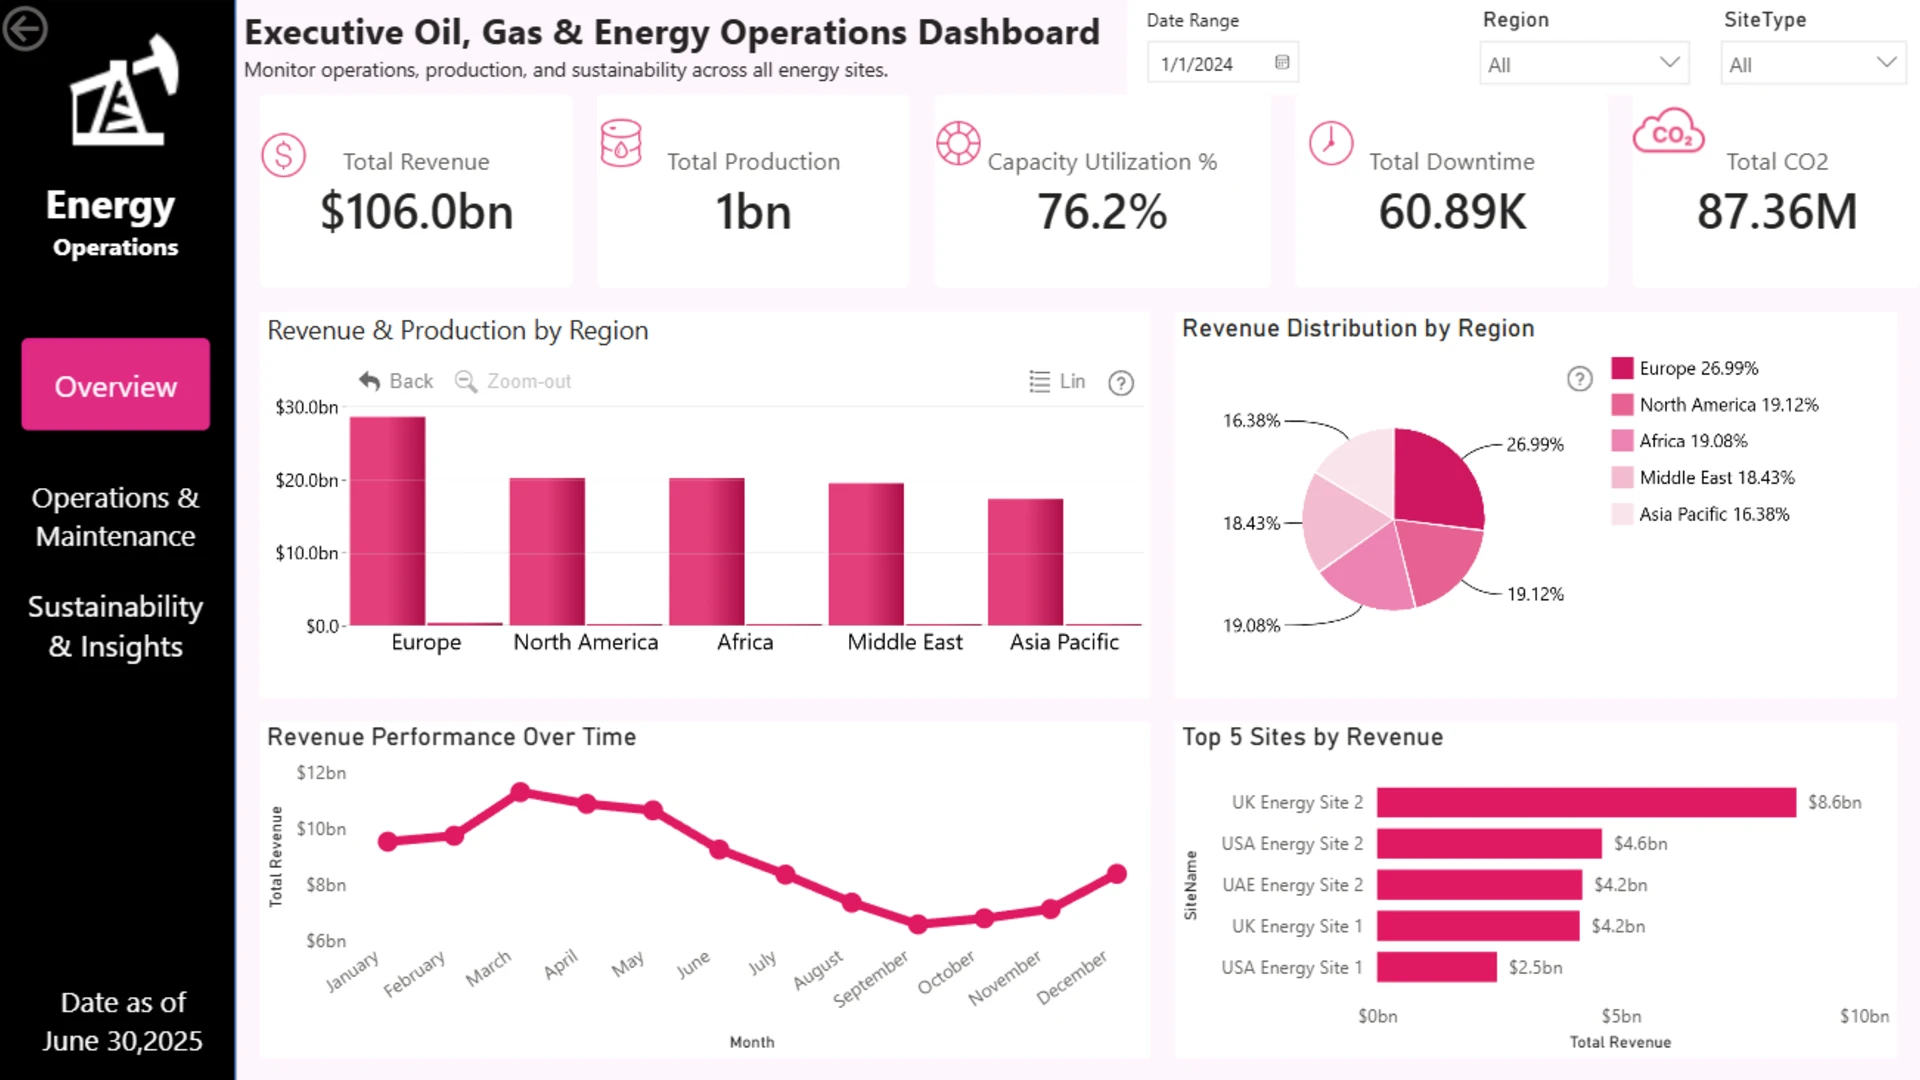
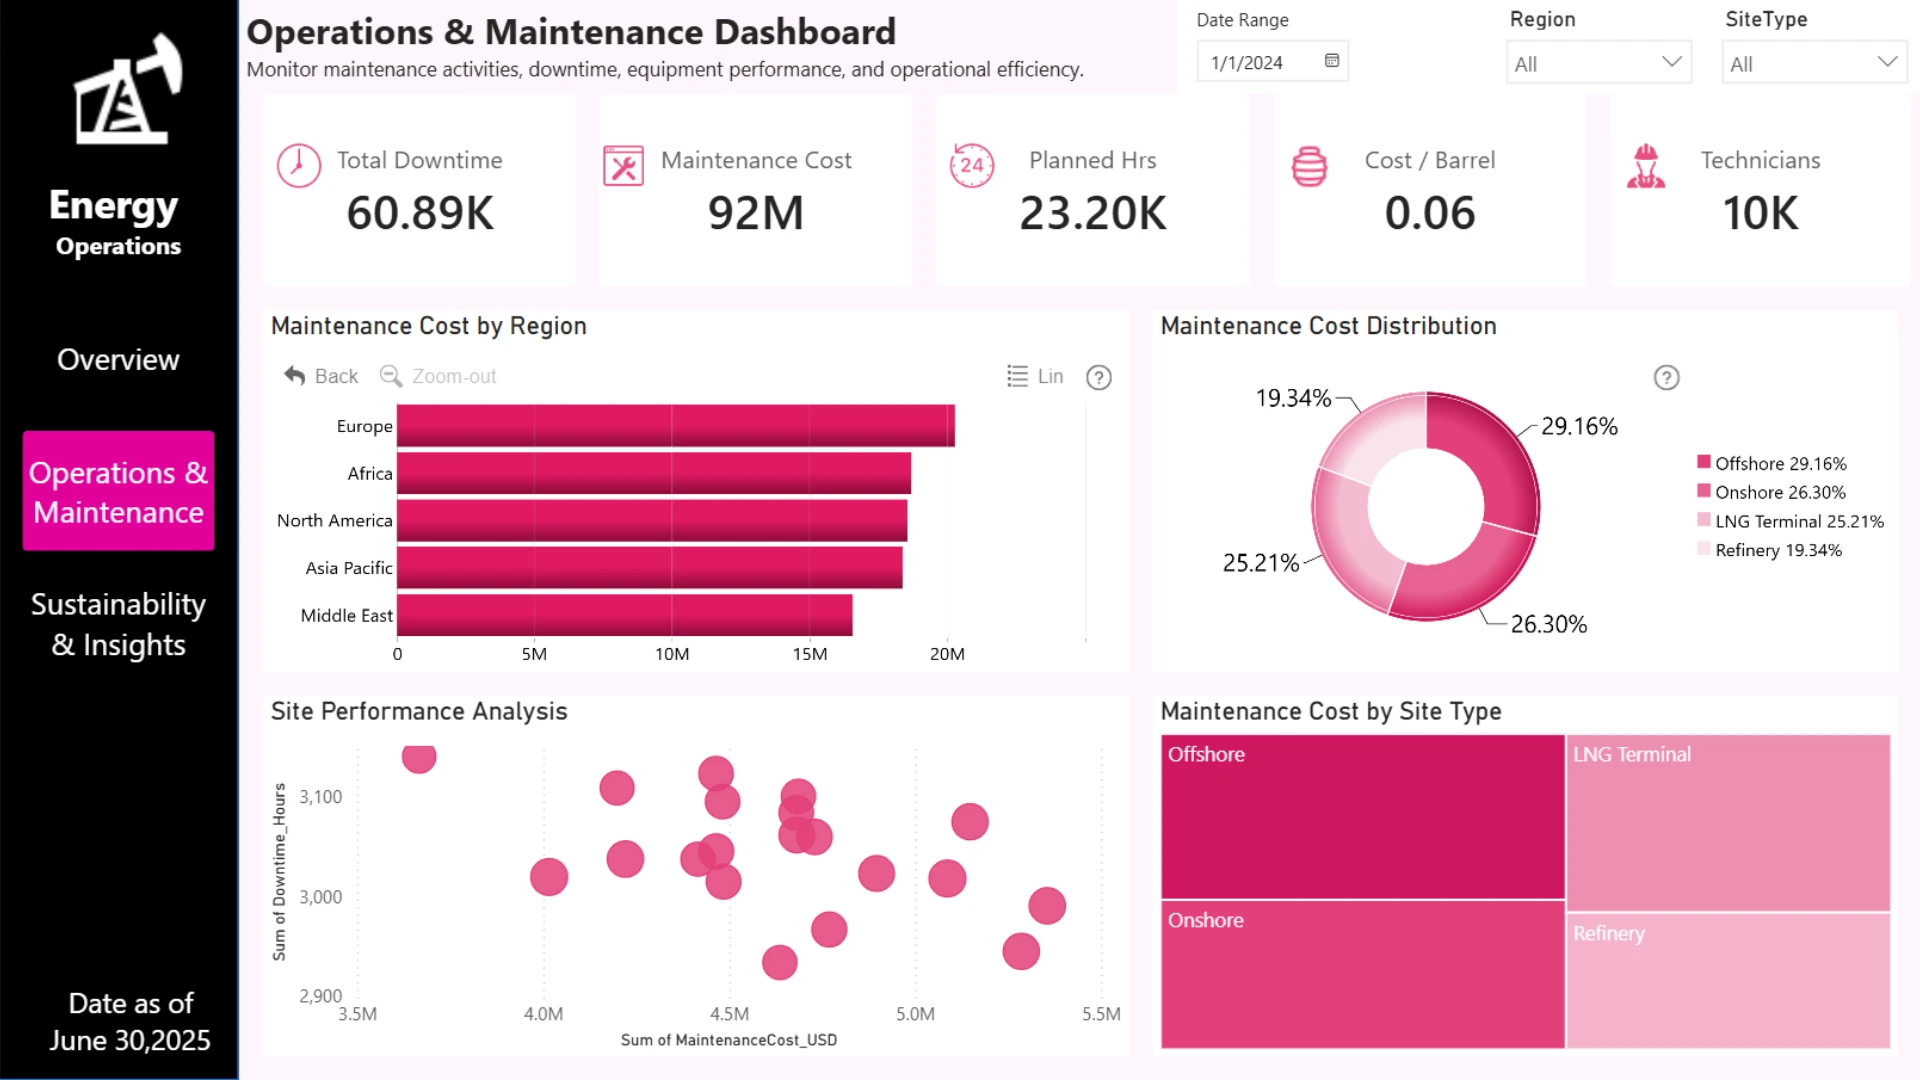
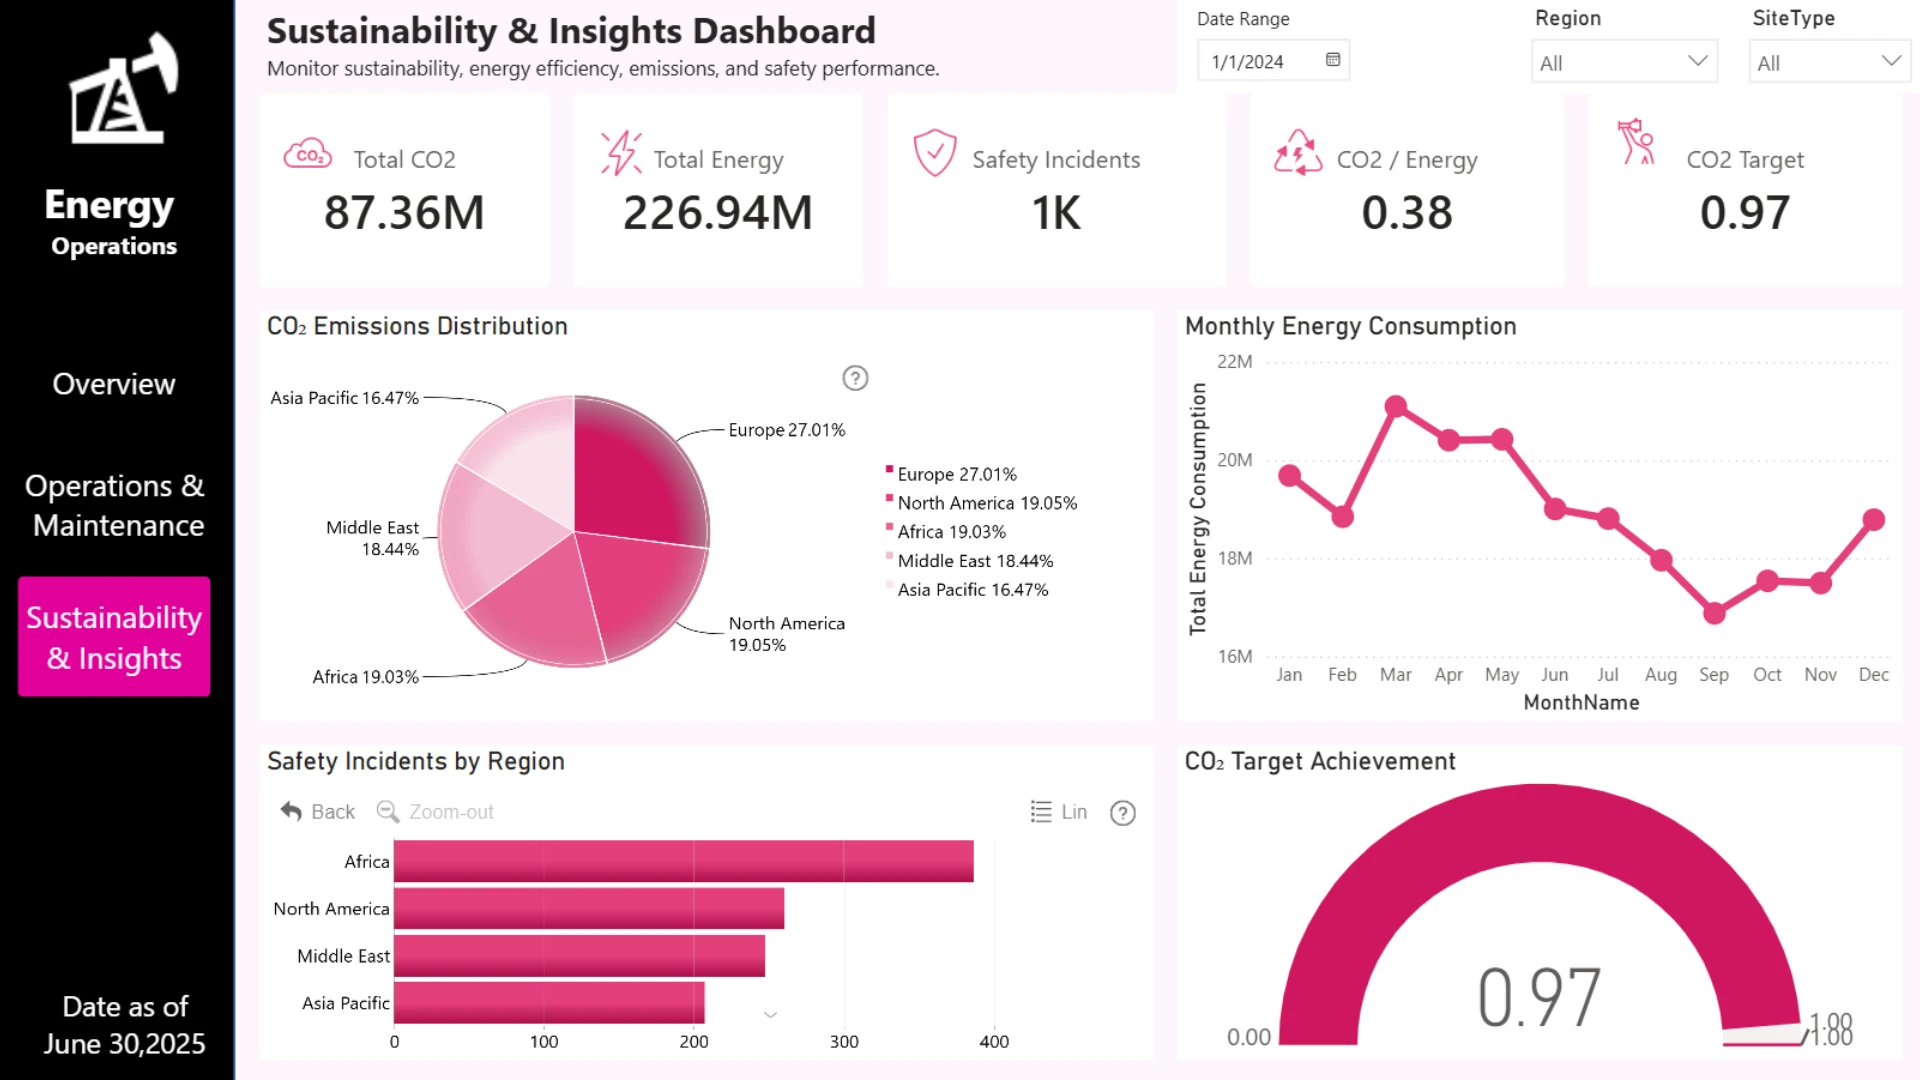
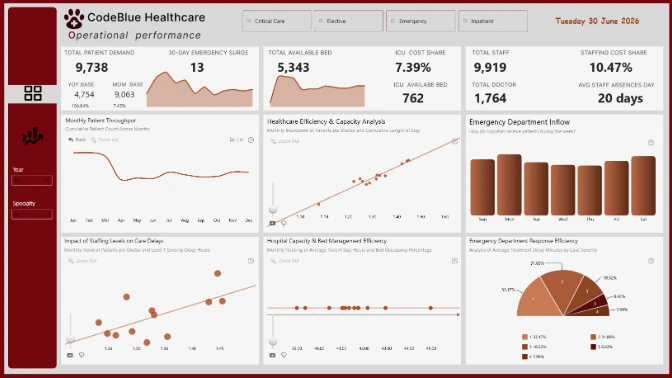
Explore an interactive Power BI dashboard for interactive operations analysis. Built with native Power BI visuals and ZoomCharts Drill Down Visuals, the report helps analyze production, maintenance, downtime, safety, sustainability, operational performance, and financial KPIs to support better business decisions. This report was created for the ZoomCharts 4U Report Challenge June 2026, where Power BI developers showcase their data visualization expertise by solving real-world business use cases using native Power BI visuals together with ZoomCharts Drill Down Visuals.
Author's description: An interactive Power BI dashboard designed to monitor operational performance, maintenance activities, and sustainability metrics across oil, gas, and energy sites. The report includes executive KPIs, drill-down visualizations, trend analysis, maintenance cost distribution, safety insights, and CO₂ emissions monitoring. Users can filter data dynamically by date, region, and site type for detailed analysis.
ZoomCharts visuals used
4U Report Challenges
Participate in data challenges, build and submit reports to get free template downloads.
Join CommunityMobile view allows you to interact with the report. To Download the template please switch to desktop view.

Was this helpful? Thank you for your feedback!
Sorry about that.
How can we improve it?