1037
Holiday Retail Analytics in Power BI 3
Holiday Retail Analytics in Power BI 3
More Report pages
Report Author: Aman Sharma
1037
Share template with others
This Power BI report is built using the Omnichannel Holiday Retail Sales dataset and features ZoomCharts Drill Down PRO custom visuals for Power BI. It was submitted to the FP20 Analytics ZoomCharts Data Challenge #33 (December 2025 – January 2026).
Author's Description:
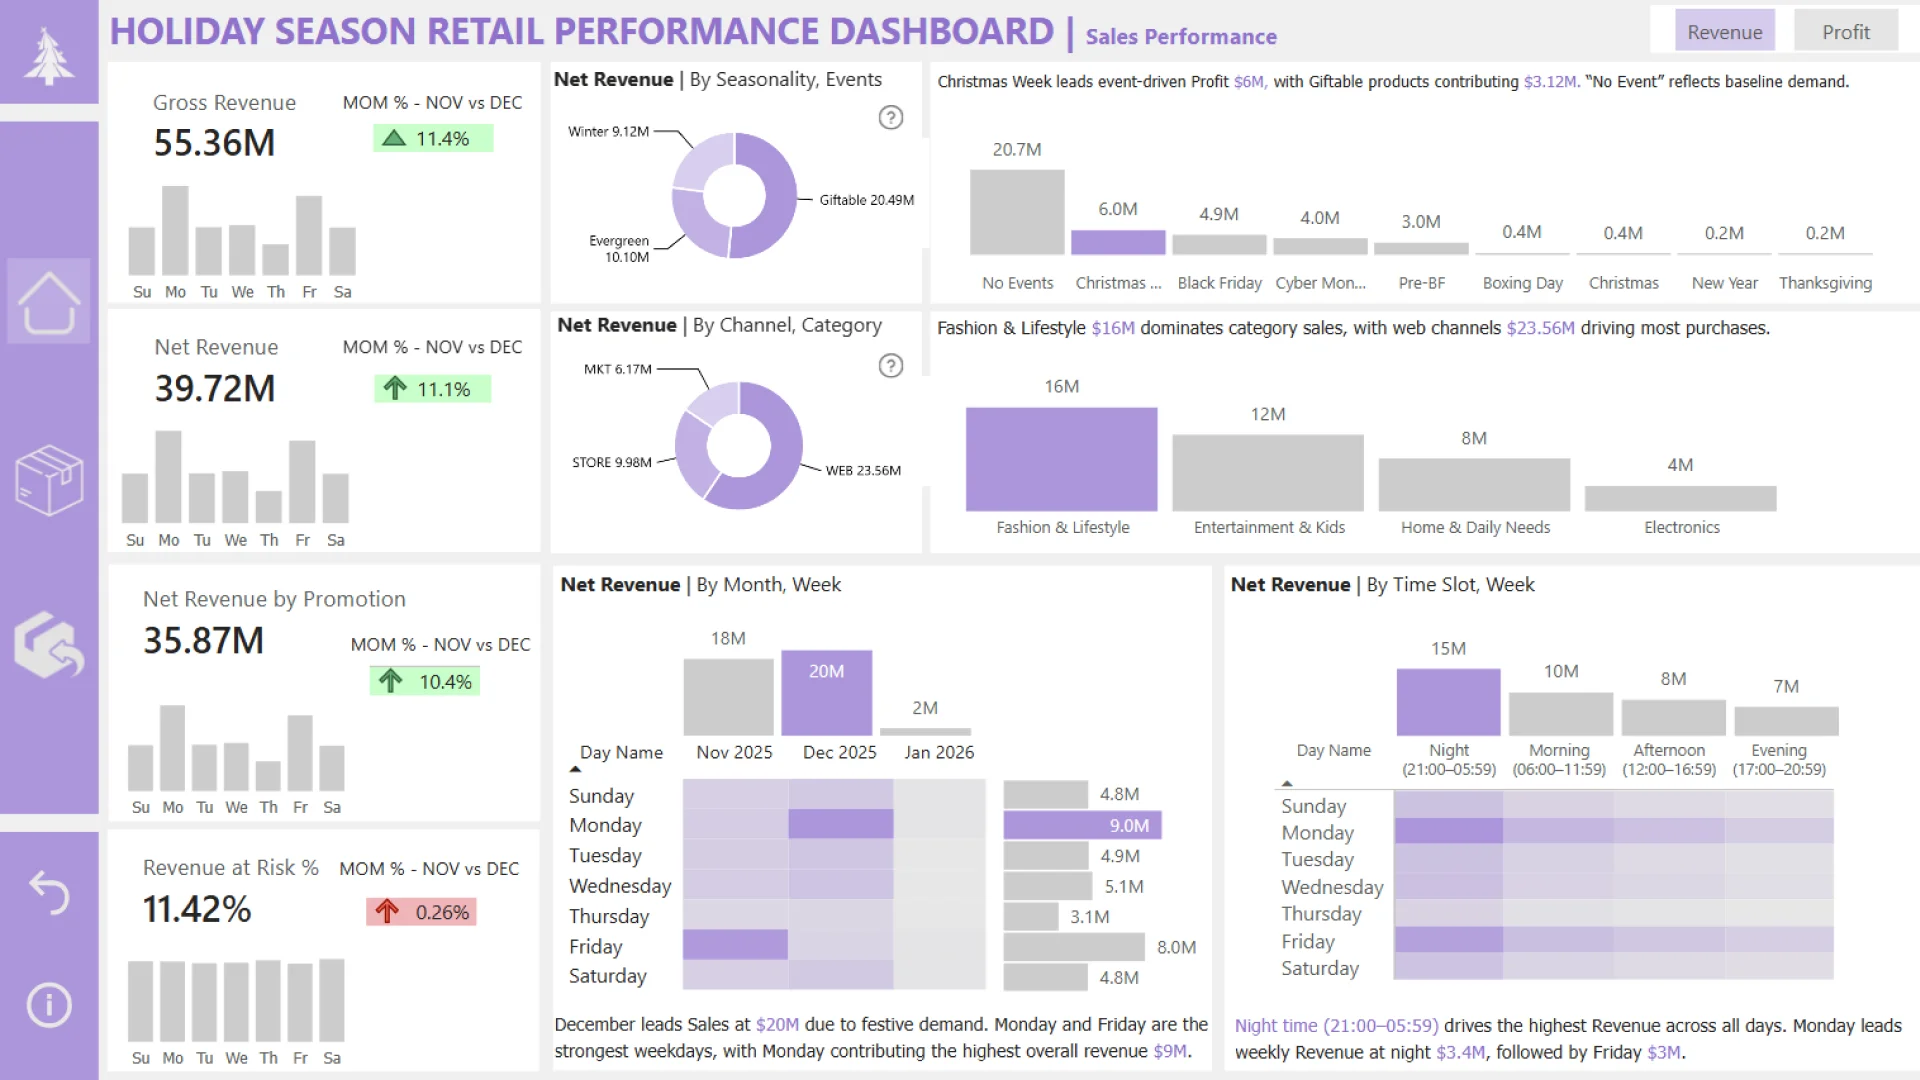
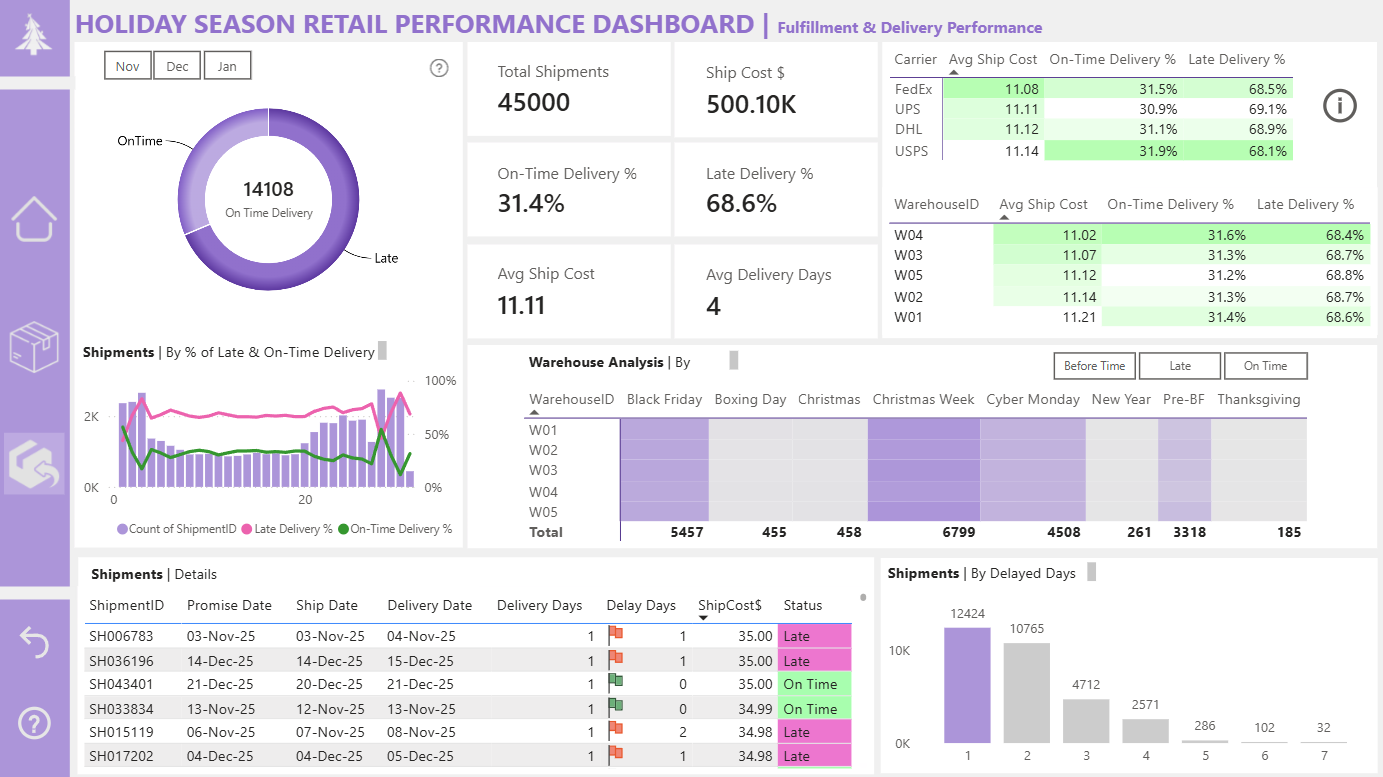
This dashboard analyzes retail performance across the holiday season (Nov–Jan), focusing on revenue, profit, returns, and fulfillment efficiency. It highlights how festive events, customer behavior, and delivery performance impact net revenue and profit margins. The analysis identifies key drivers such as high-return products, vendor quality issues, peak shopping time slots, and late deliveries, providing actionable insights to reduce return costs, improve fulfillment performance, and protect profitability during peak demand periods.
ZoomCharts visuals used
4U Report Challenges
Participate in data challenges, build and submit reports to get free template downloads.
Join CommunityMobile view allows you to interact with the report. To Download the template please switch to desktop view.

Was this helpful? Thank you for your feedback!
Sorry about that.
How can we improve it?