607
Holiday Campaign Performance – Power BI 2
Holiday Campaign Performance – Power BI 2
More Report pages
Report Author: Victor Ademola
607
Share template with others
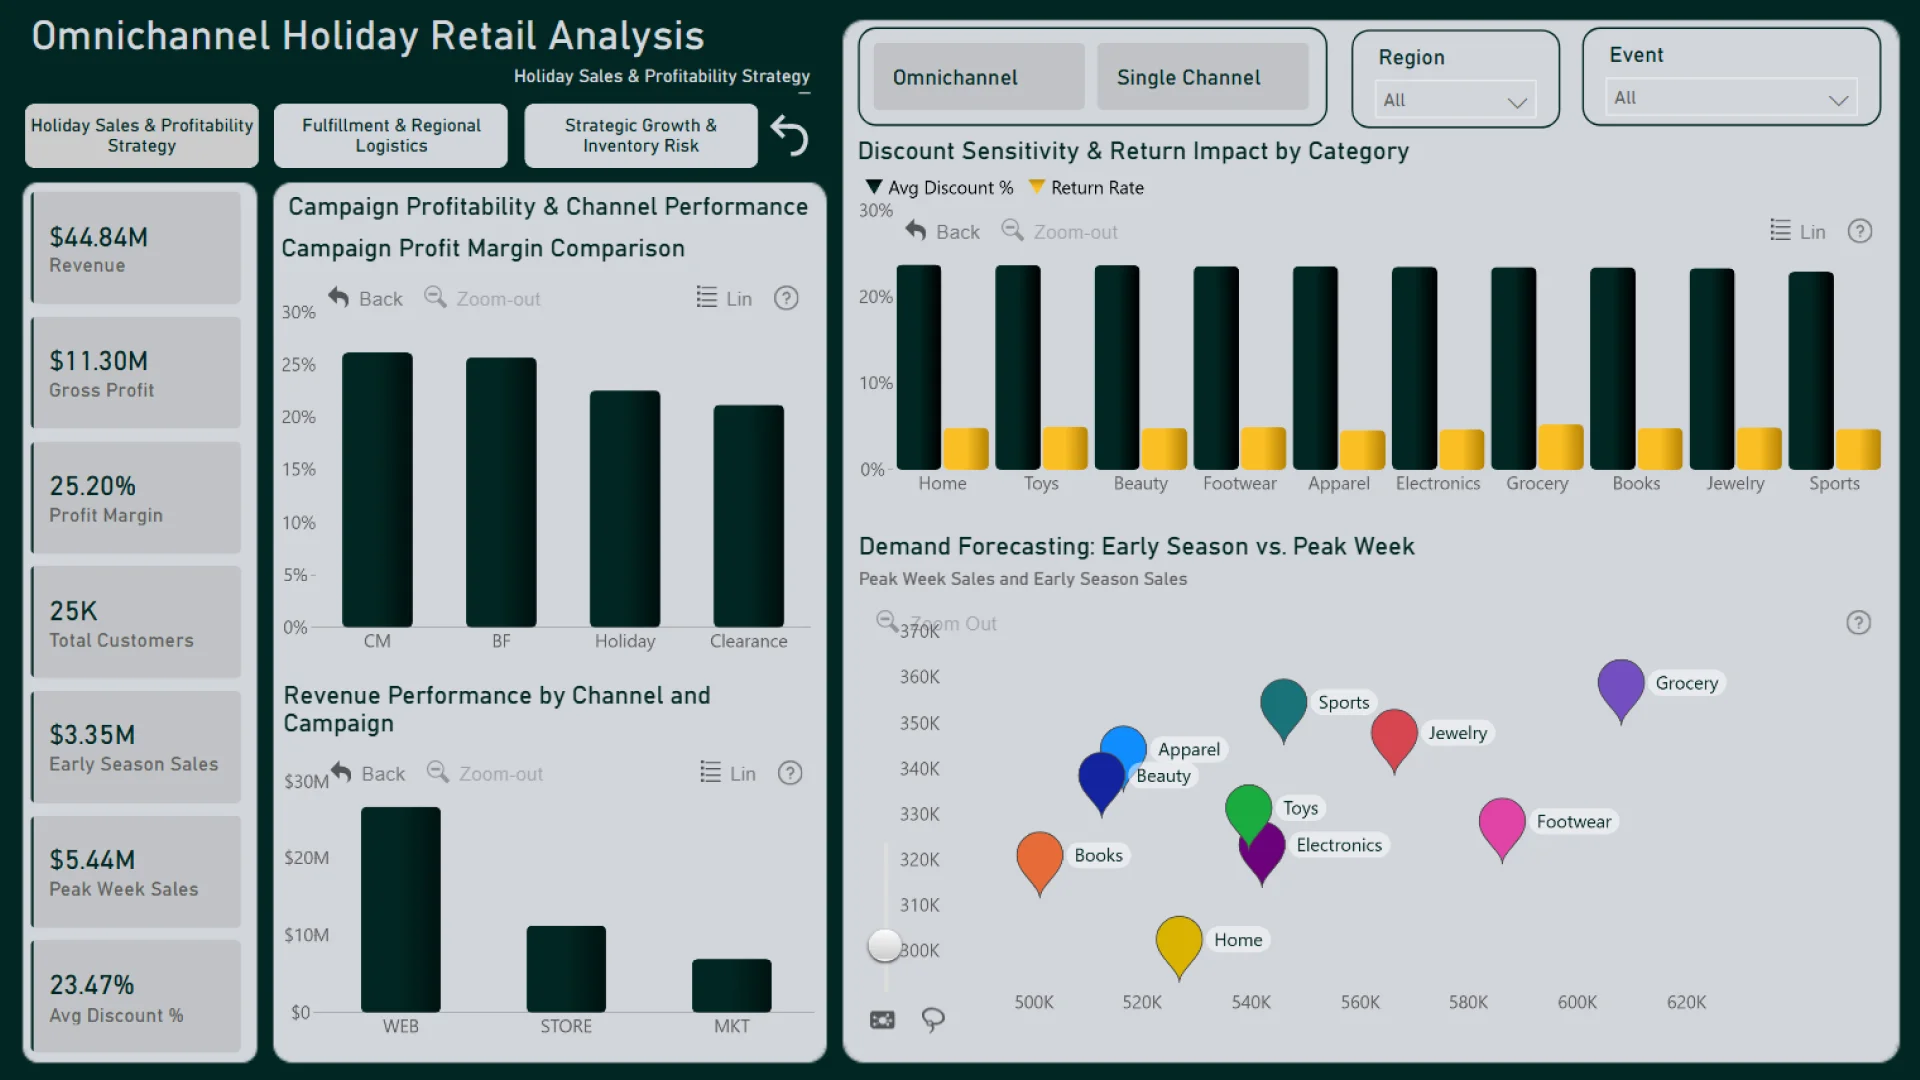
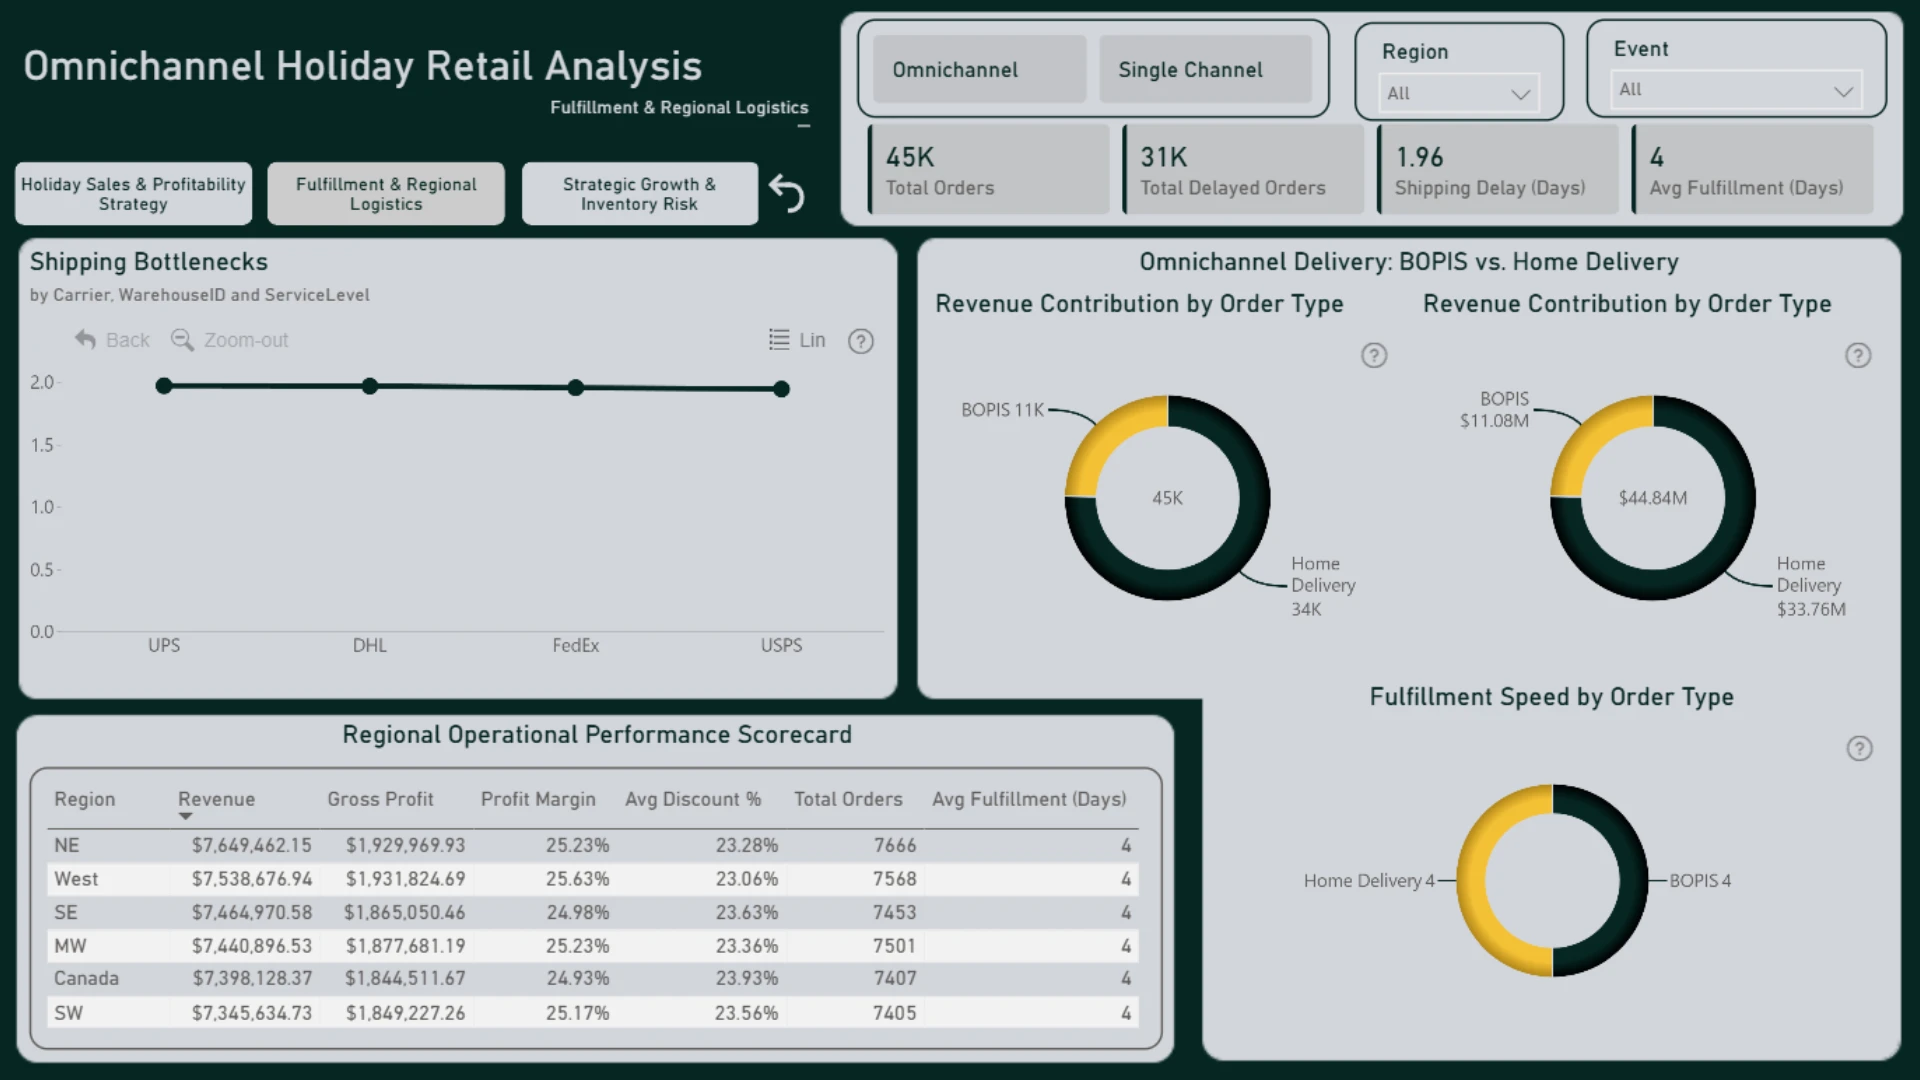
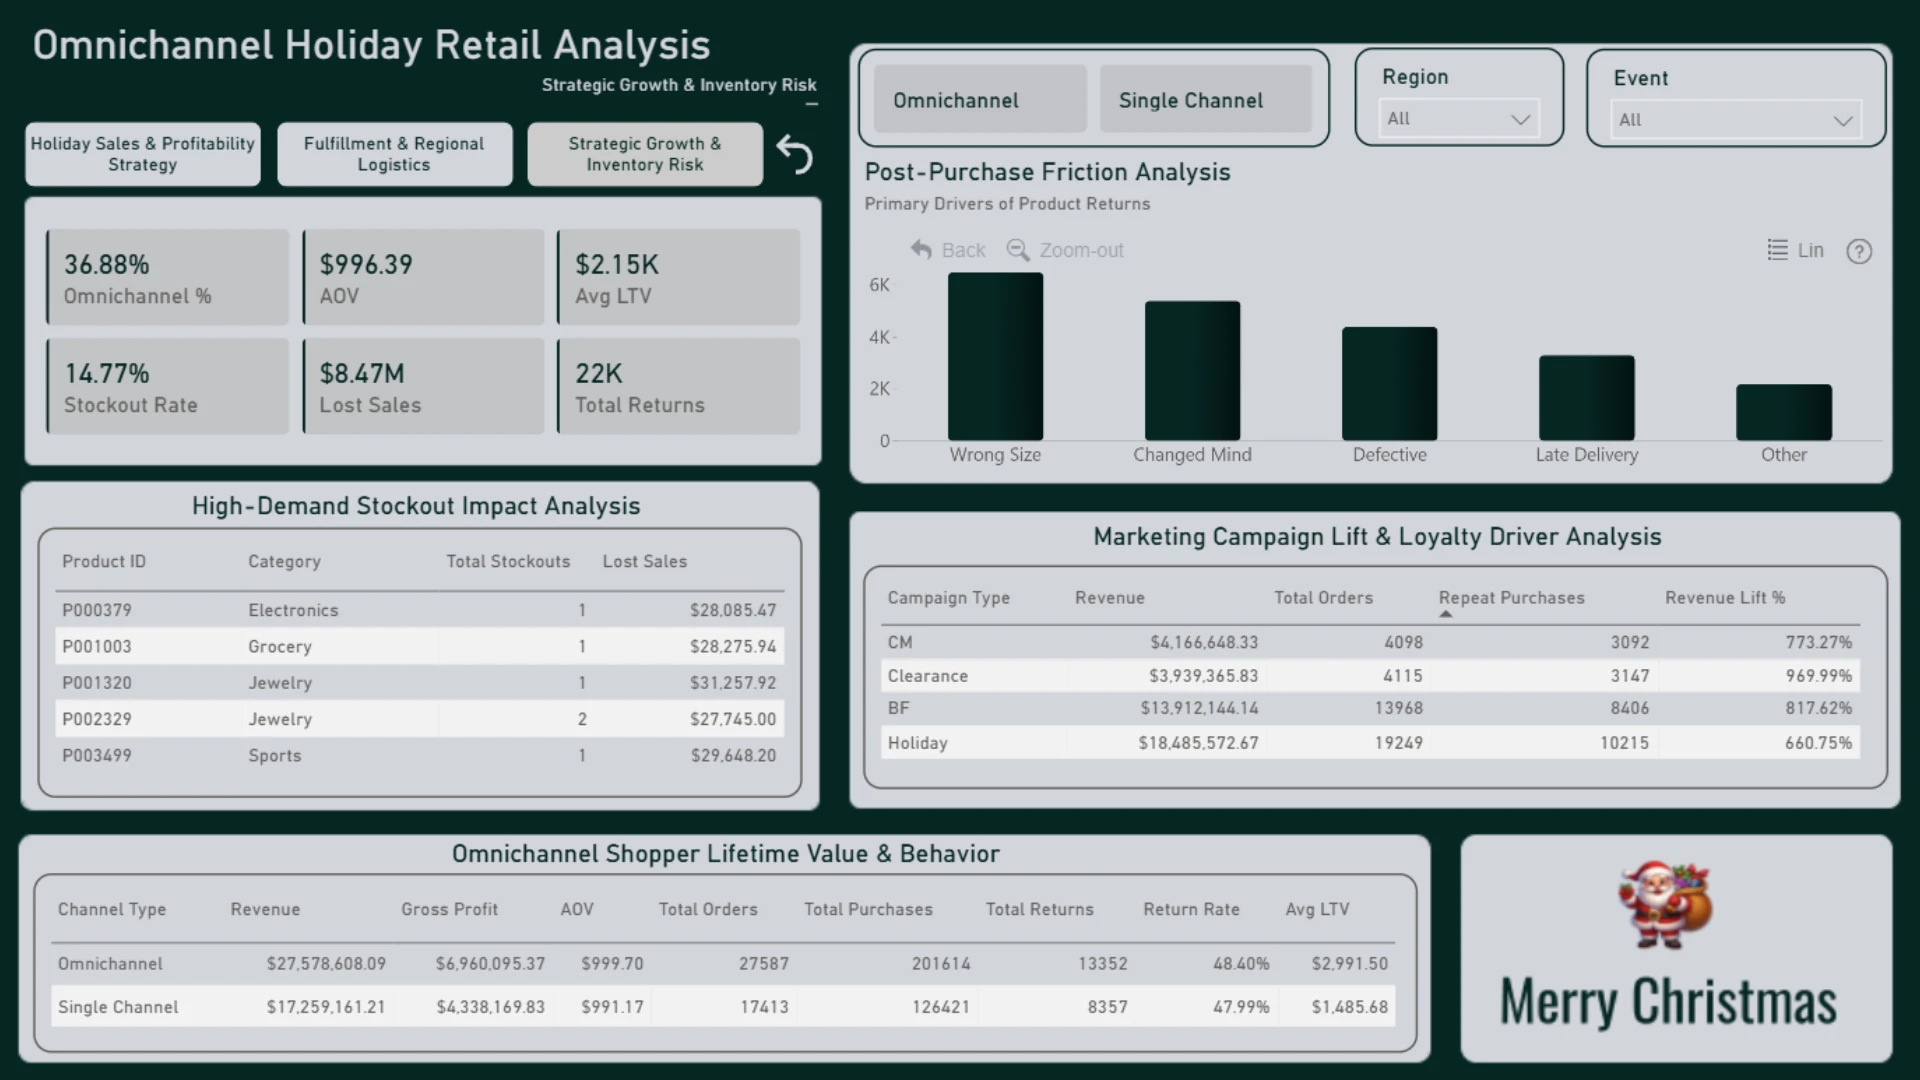
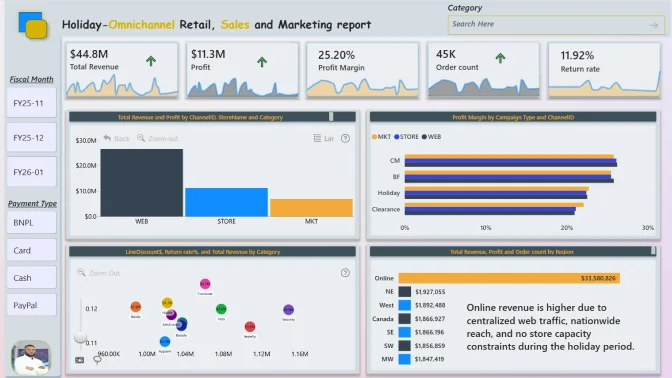
This Power BI report is built using the Omnichannel Holiday Retail Sales dataset and features ZoomCharts Drill Down PRO custom visuals for Power BI. It was submitted to the FP20 Analytics ZoomCharts Data Challenge #33 (December 2025 – January 2026).
Author's Description:
Analyze holiday retail trends with this Power BI dashboard. It features a Midnight Green & Light Silver theme, tracking $44.84M in revenue. Key insights include $8.47M in stockout losses, omnichannel LTV analysis ($2,991.50), and logistics performance across 45k orders.
ZoomCharts visuals used
4U Report Challenges
Participate in data challenges, build and submit reports to get free template downloads.
Join CommunityMobile view allows you to interact with the report. To Download the template please switch to desktop view.
Was this helpful? Thank you for your feedback!
Sorry about that.
How can we improve it?