4471
Power BI Fitness Company Financial Performance Dashboard
Power BI Fitness Company Financial Performance Dashboard
More Report pages
Report Author: Divya Pardeshi
4471
Share template with others
Summary
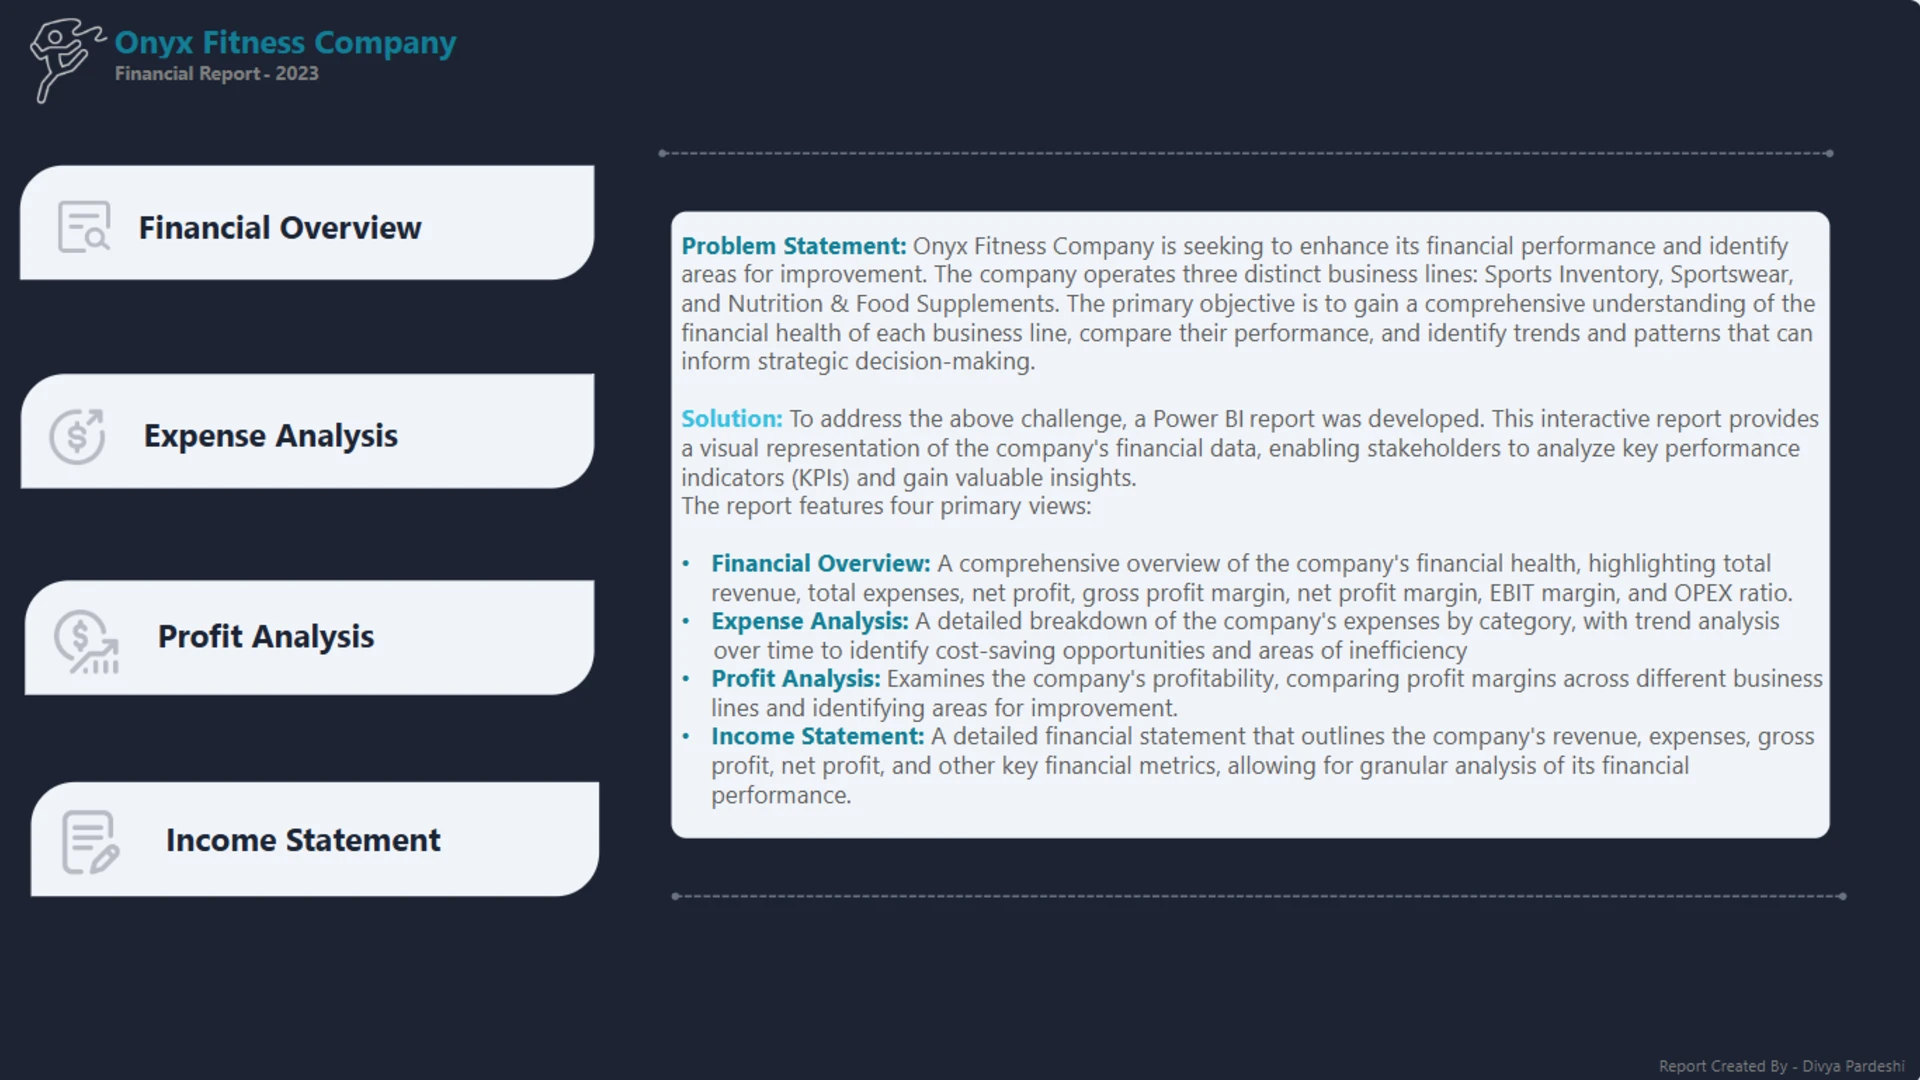
This Power BI financial dashboard analyzes the performance of a fitness company across three business lines: Sports Inventory, Sportswear, and Nutrition & Food Supplements. It helps users monitor revenue, expenses, profit, and income-statement results from both company-wide and business-line perspectives.
Created by Divya Pardeshi, the report contains a Home Page and four primary analytical views: Financial Overview, Expense Analysis, Profit Analysis, and Income Statement.
Key Insights of the Power BI Fitness Company Financial Performance Dashboard
The report provides a structured path from high-level financial results to more detailed analysis. Its main areas of analysis include:
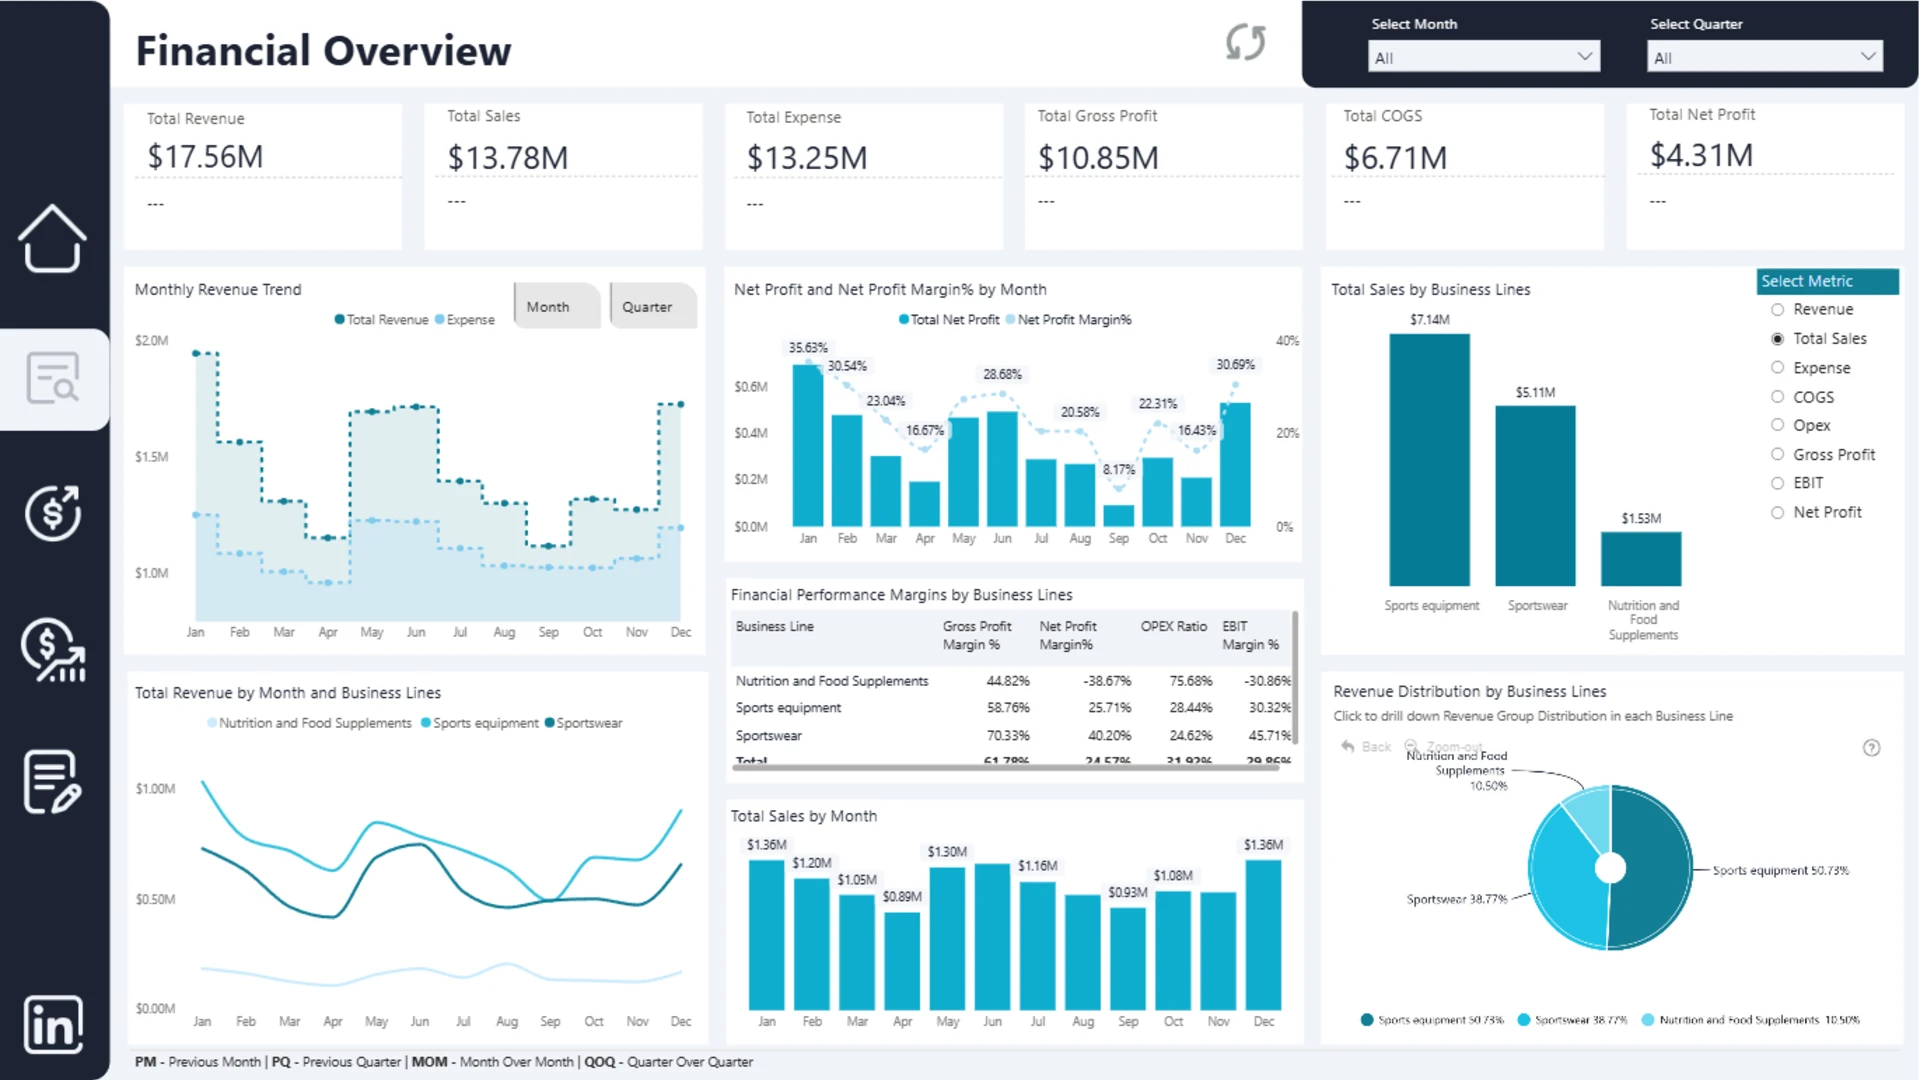
- Financial overview: review core revenue, expense, and profit indicators in one view
- Business-line performance: compare results across Sports Inventory, Sportswear, and Nutrition & Food Supplements
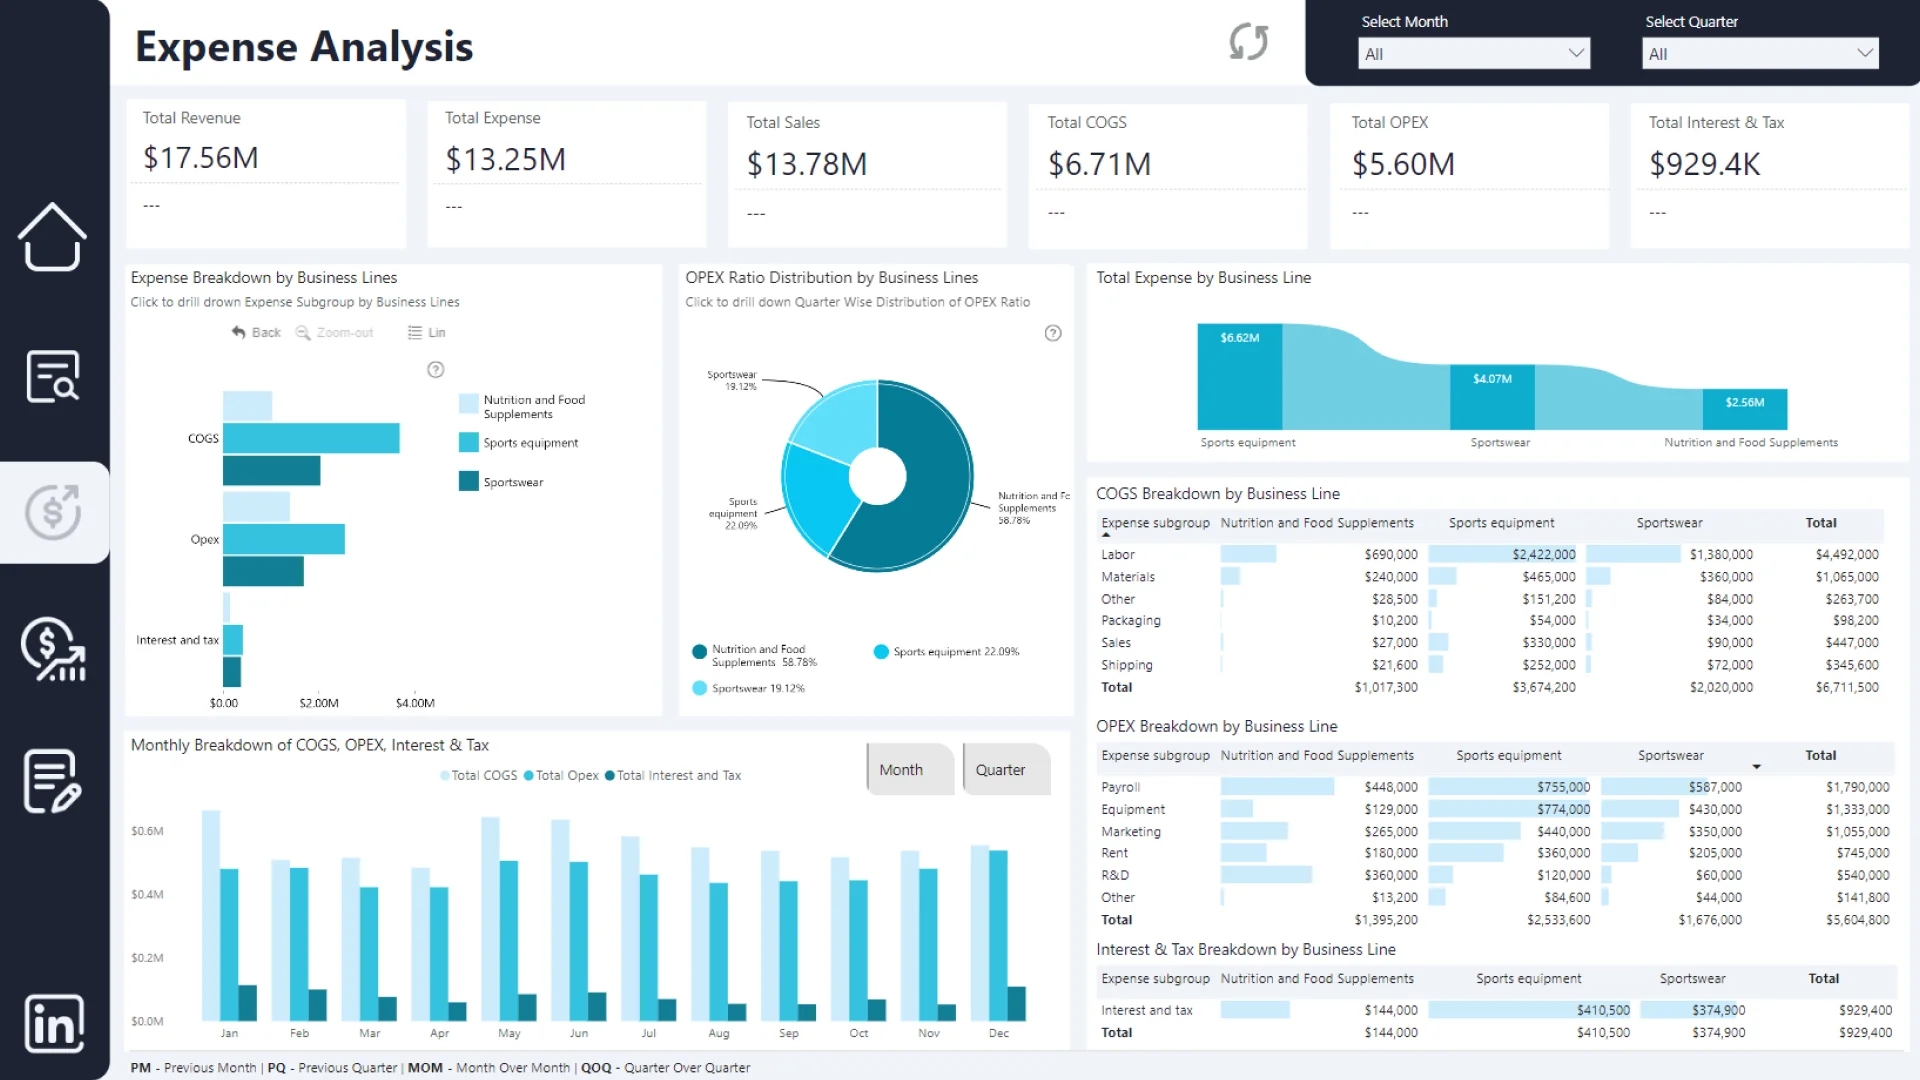
- Expense analysis: examine how costs are distributed and how they change across reporting periods and business areas
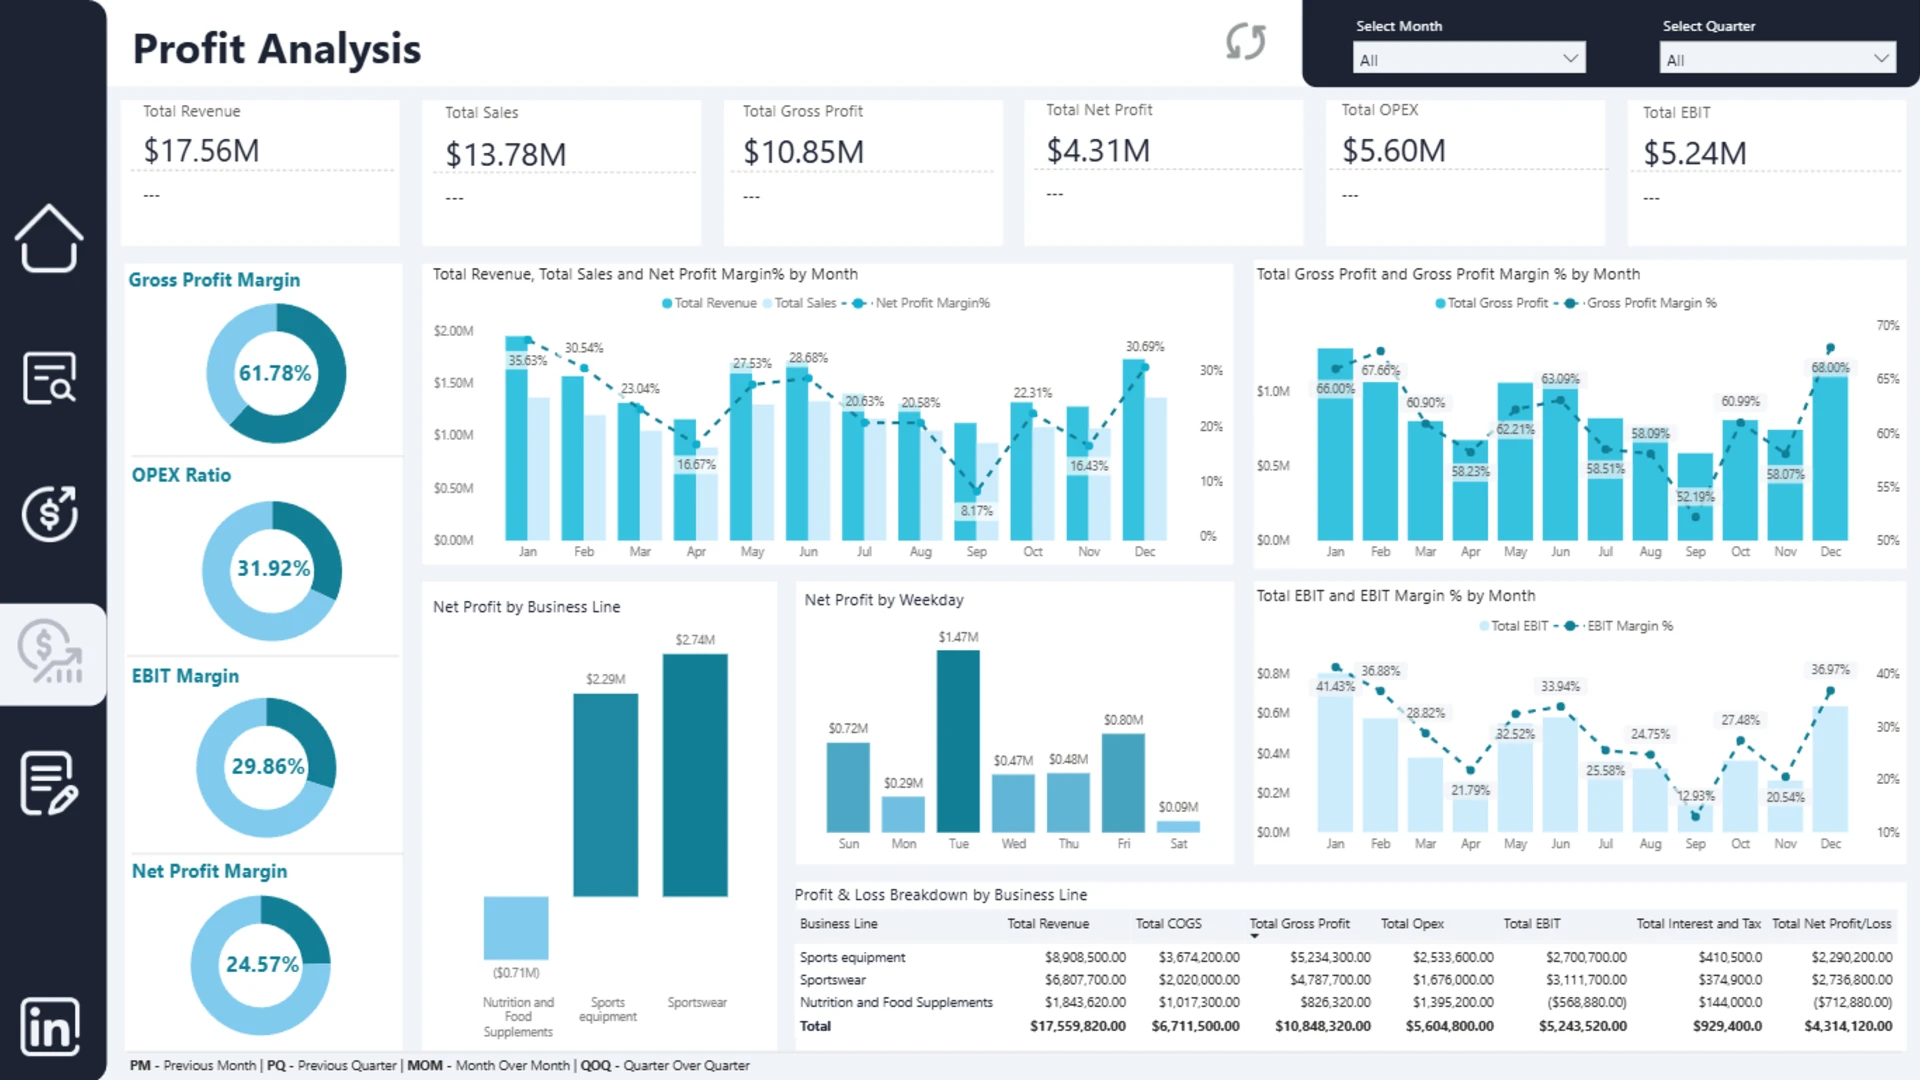
- Profit analysis: explore profit performance and the financial components contributing to the reported result
- Income statement: follow the progression from revenue through expenses to the final profit result
The dashboard uses Drill Down Combo, Waterfall, and Donut PRO visuals. The waterfall view helps explain changes between financial statement components, while the combo and donut charts support trend analysis and comparisons between business lines.
This report was submitted to the Onyx Data DataDNA ZoomCharts Mini Challenge in August 2024.
How to Use This Power BI Fitness Company Financial Dashboard
Use the report navigation to move between the Financial Overview, Expense Analysis, Profit Analysis, and Income Statement views. Click active chart elements to filter the page, compare business lines, and drill into financial results in greater detail.
Download the PBIX template to review the report structure, calculations, visual settings, and financial reporting logic in Power BI Desktop. Replace the sample connection to adapt the dashboard for your own company, products, or business units.



4U Report Challenges
Participate in data challenges, build and submit reports to get free template downloads.
Join CommunityMobile view allows you to interact with the report. To Download the template please switch to desktop view.
How to use a PBIX template
Preview the interactive report, download the PBIX file, open it in Power BI Desktop, and replace the same data connection with your own dataset.
Preview and download
Explore the report online and download the PBIX template file.
Open in Power BI Desktop
Open the downloaded PBIX file in Power BI Desktop.
Connect your data
Replace the sample data source with your own dataset.
Refresh and adjust
Refresh the model and update fields or visual were needed.
Save and share
Save your report and publish it for your audience.


