3317
Fintech Project Management Dashboard in Power BI
Fintech Project Management Dashboard in Power BI

More Report pages
Report Author: Nina Ikpe
3317
Share template with others
This fintech project management dashboard example shows how Power BI can be used to analyze project health, budget utilization, task progress, resource efficiency, and portfolio risk in one interactive report.
Built with the Fintech Project Management dataset, this report features both ZoomCharts Drill Down PRO custom visuals for Power BI and native Power BI visuals. It was built during the FP20 Analytics ZoomCharts Data Challenge 32 in November 2025.
The report is designed for project managers, PMO teams, business analysts, and operations leaders who need a practical way to monitor project delivery. Users can explore portfolio-level performance and drill into details by project, task, country, department, employee, and risk level.
What you can analyze
Use this Power BI project management dashboard to track:
- Planned vs. actual budget
- Budget variance and budget utilization
- Planned vs. actual hours
- Hours variance and hours utilization
- Project status and risk level
- Task priority and completion rate
- Milestone delays
- Labor cost and average hourly rate
- Resource utilization by country, department, and experience level
Report pages
The report includes three interactive pages:
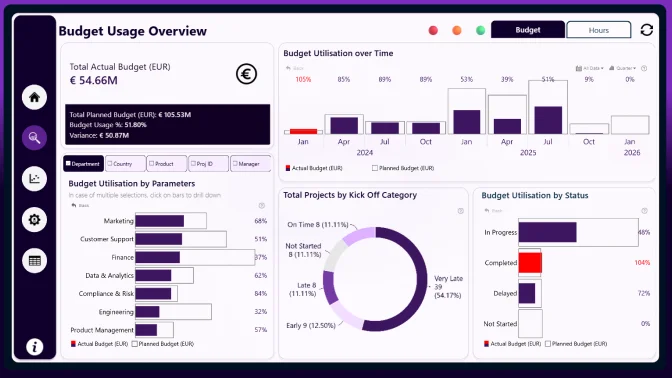
- Portfolio overview: monitor project health, financial performance, hours usage, project status, and risk distribution.
- Project and task performance: review project execution, task efficiency, budget variance, completion rates, and milestone delays.
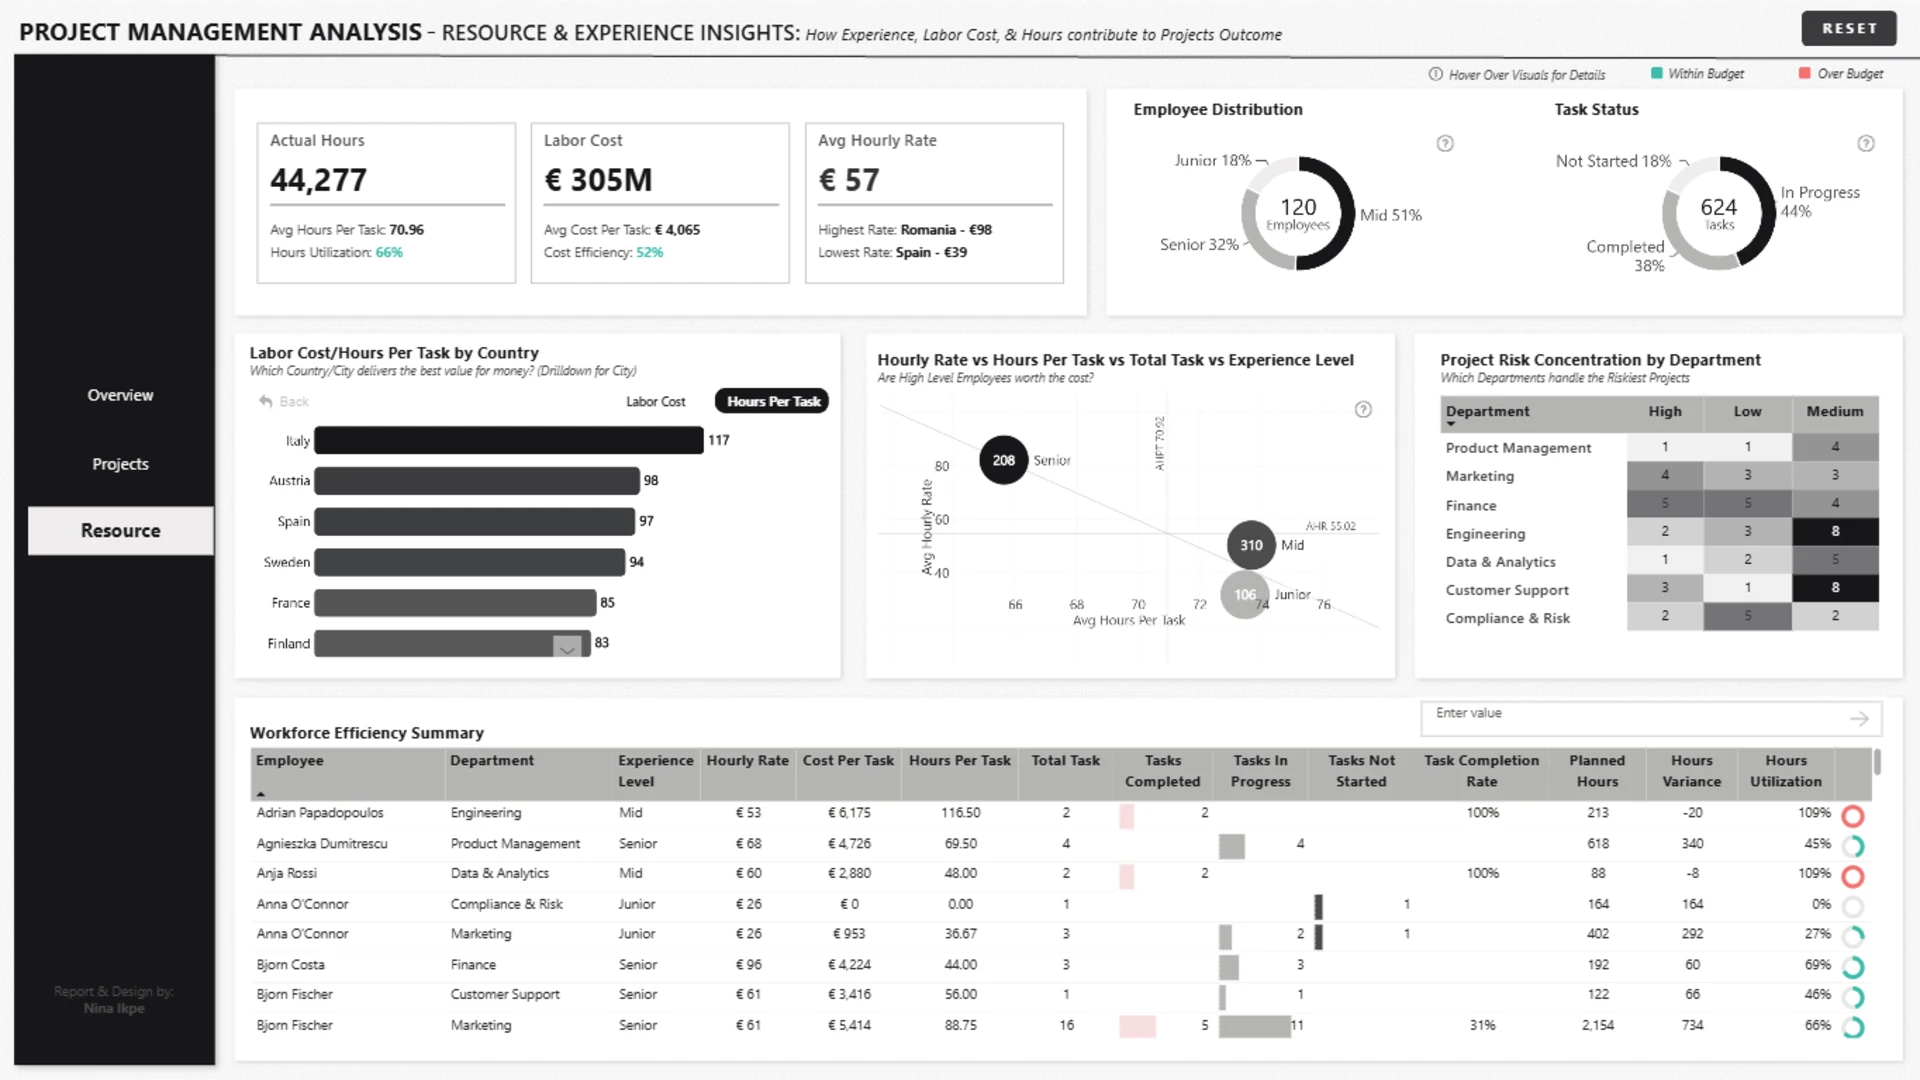
- Resource and experience insights: analyze labor cost, hourly rates, employee experience, task status, and resource utilization.
Interactive features
This report combines ZoomCharts Drill Down PRO visuals with native Power BI visuals to support interactive project analysis. Users can click directly on visuals, drill down by country, city, project, department, and task, switch between financial and hours-based KPIs, and reset the dashboard with one click.
Download this free Power BI project management dashboard example to explore the full setup and adapt it to your own project management, PMO, fintech, operations, or resource planning data.
ZoomCharts visuals used
4U Report Challenges
Participate in data challenges, build and submit reports to get free template downloads.
Join CommunityMobile view allows you to interact with the report. To Download the template please switch to desktop view.

Was this helpful? Thank you for your feedback!
Sorry about that.
How can we improve it?