919
Fintech Project Delivery Analysis
Fintech Project Delivery Analysis

More Report pages
Report Author: Nnamdi Nwankwo
919
Share template with others
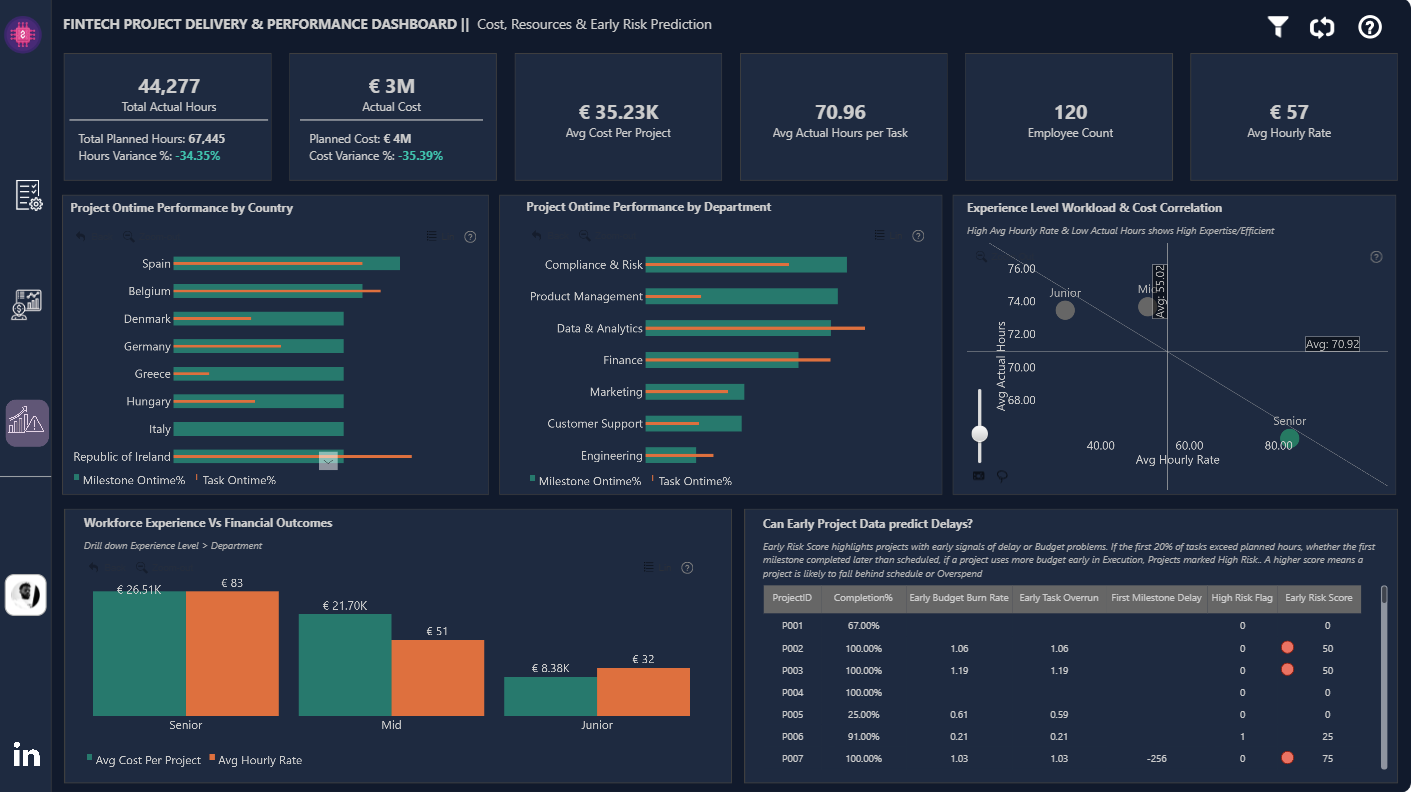
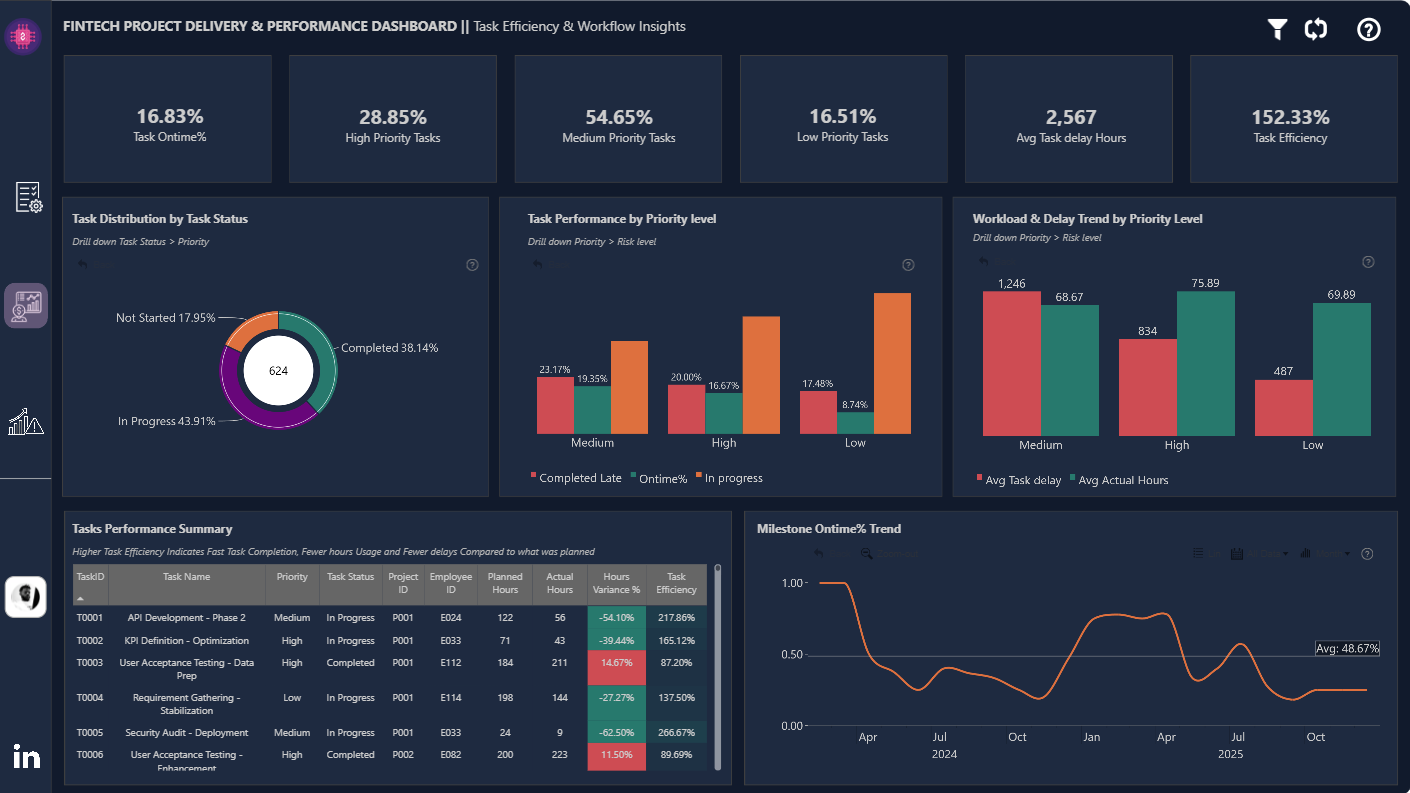
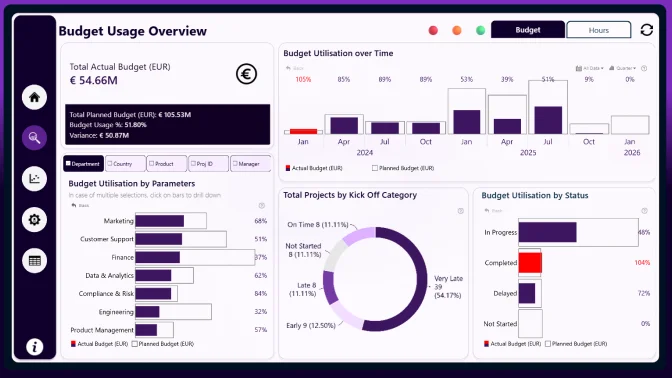
This Power BI report uses the Fintech Project Management dataset and features ZoomCharts Drill Down PRO custom visuals for Power BI. It was submitted to the FP20 Analytics ZoomCharts Data Challenge 32 in November 2025.
Author's Description:
A Power BI report designed to analyse fintech data and uncover insights that enhance project delivery efficiency, optimise resource allocation, and improve overall performance in payment solution development.
ZoomCharts visuals used
4U Report Challenges
Participate in data challenges, build and submit reports to get free template downloads.
Join CommunityMobile view allows you to interact with the report. To Download the template please switch to desktop view.
Was this helpful? Thank you for your feedback!
Sorry about that.
How can we improve it?