This interactive Power BI report explores the European Real Estate Market Analytics dataset using ZoomCharts Drill Down custom visuals for Power BI. It highlights property prices, price per square meter, listing activity, and property characteristics across countries and cities, helping users identify market trends, compare locations, and evaluate investment opportunities.
The report was submitted to the FP20 Analytics ZoomCharts Data Challenge #36 (March – April 2026).
Author’s Description:
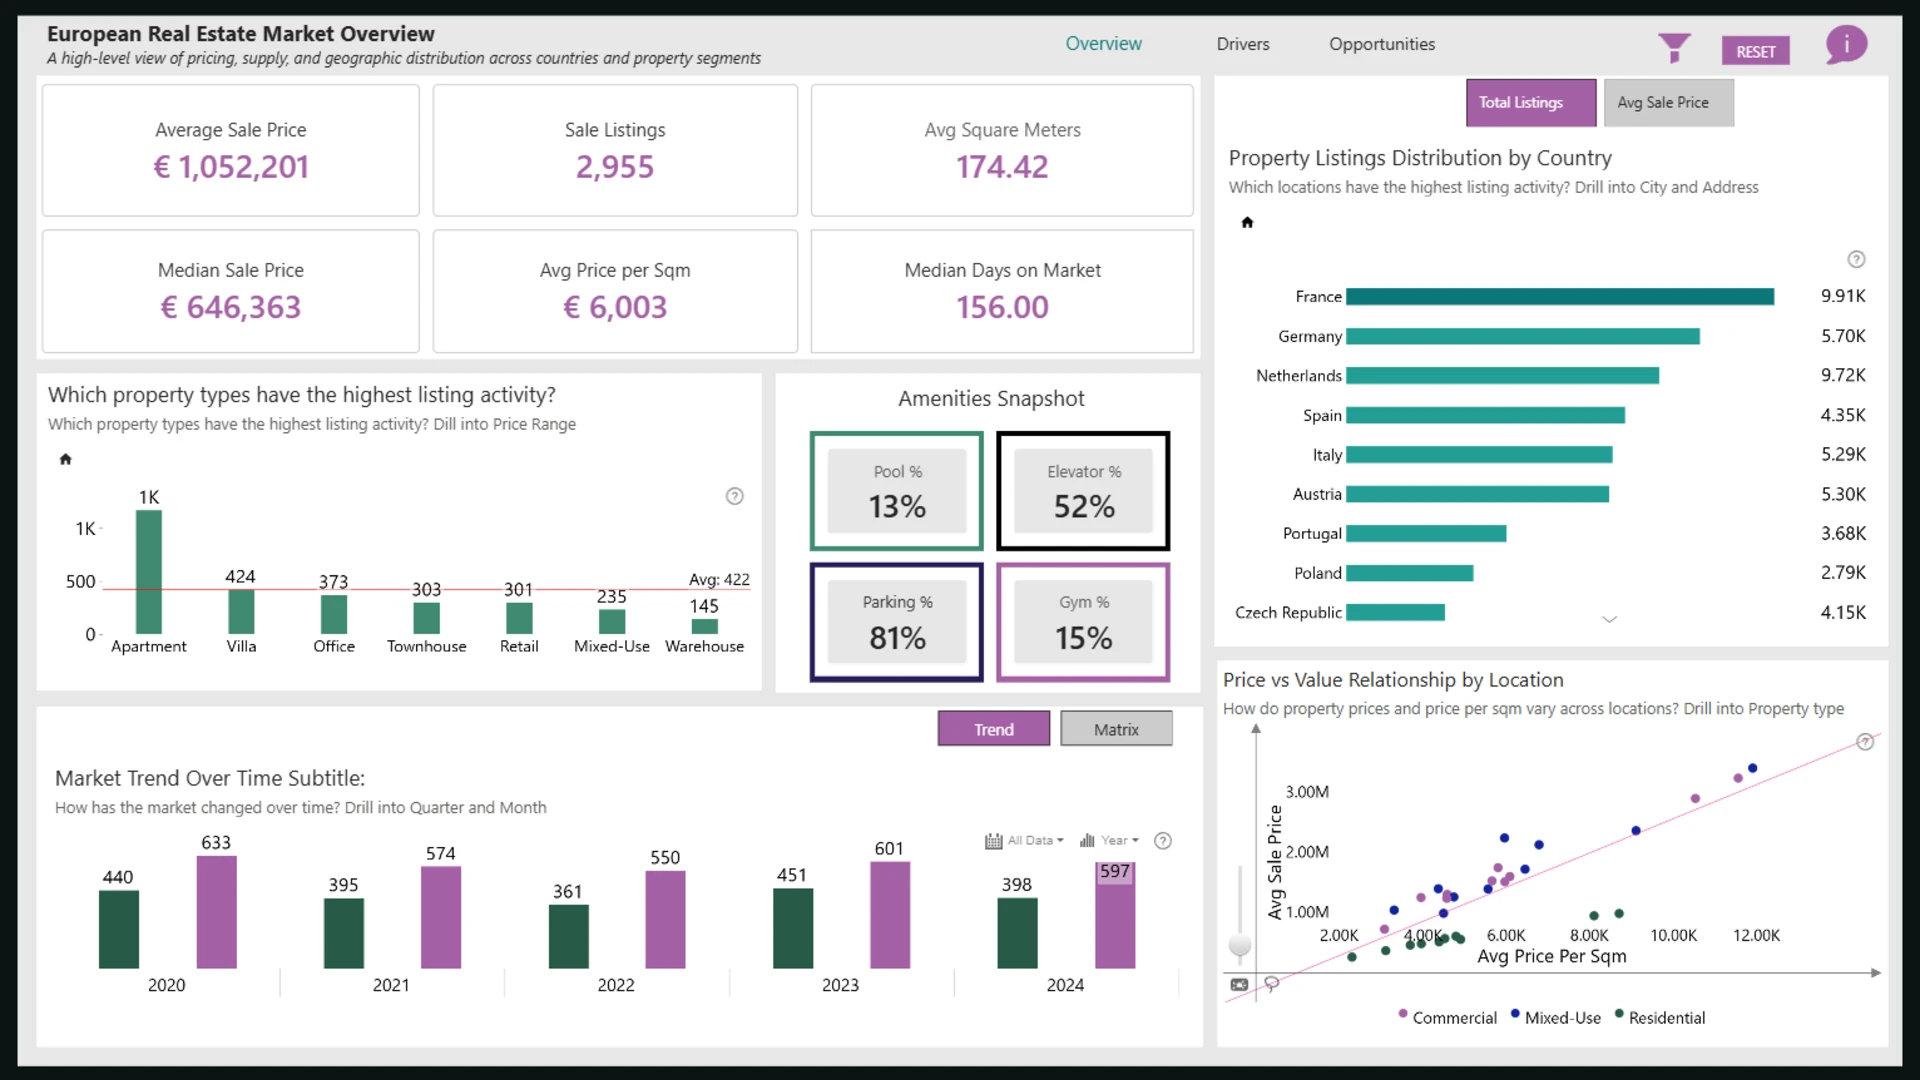
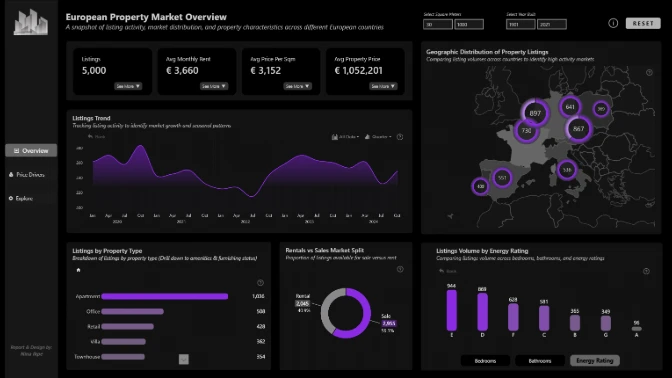
I recently developed an interactive Power BI dashboard analyzing real estate listings across multiple European cities, transforming raw data into actionable insights for market analysis and investment decisions. The report begins with a market overview, using key metrics such as average and median prices, price per square meter, and days on market to assess pricing and liquidity. It then explores the main drivers of value, including property size, amenities, age, and energy efficiency, to understand what influences pricing and performance. The final layer translates these insights into investment signals, using scores, price-to-rent ratios, and market activity to identify attractive and potentially undervalued opportunities. Overall, the dashboard provides a structured, data-driven view of the market to support informed decision-making.