902
Enterprise Data Governance Dashboard
Enterprise Data Governance Dashboard
More Report pages
Report Author: Suparna Chowdhury
902
Share template with others
This Power BI report is built using the Enterprise Data Governance Dataset and features ZoomCharts Drill Down PRO custom visuals for Power BI. It was submitted to the FP20 Analytics ZoomCharts Data Challenge #34 (January 2026 – February 2026).
Author's Description:
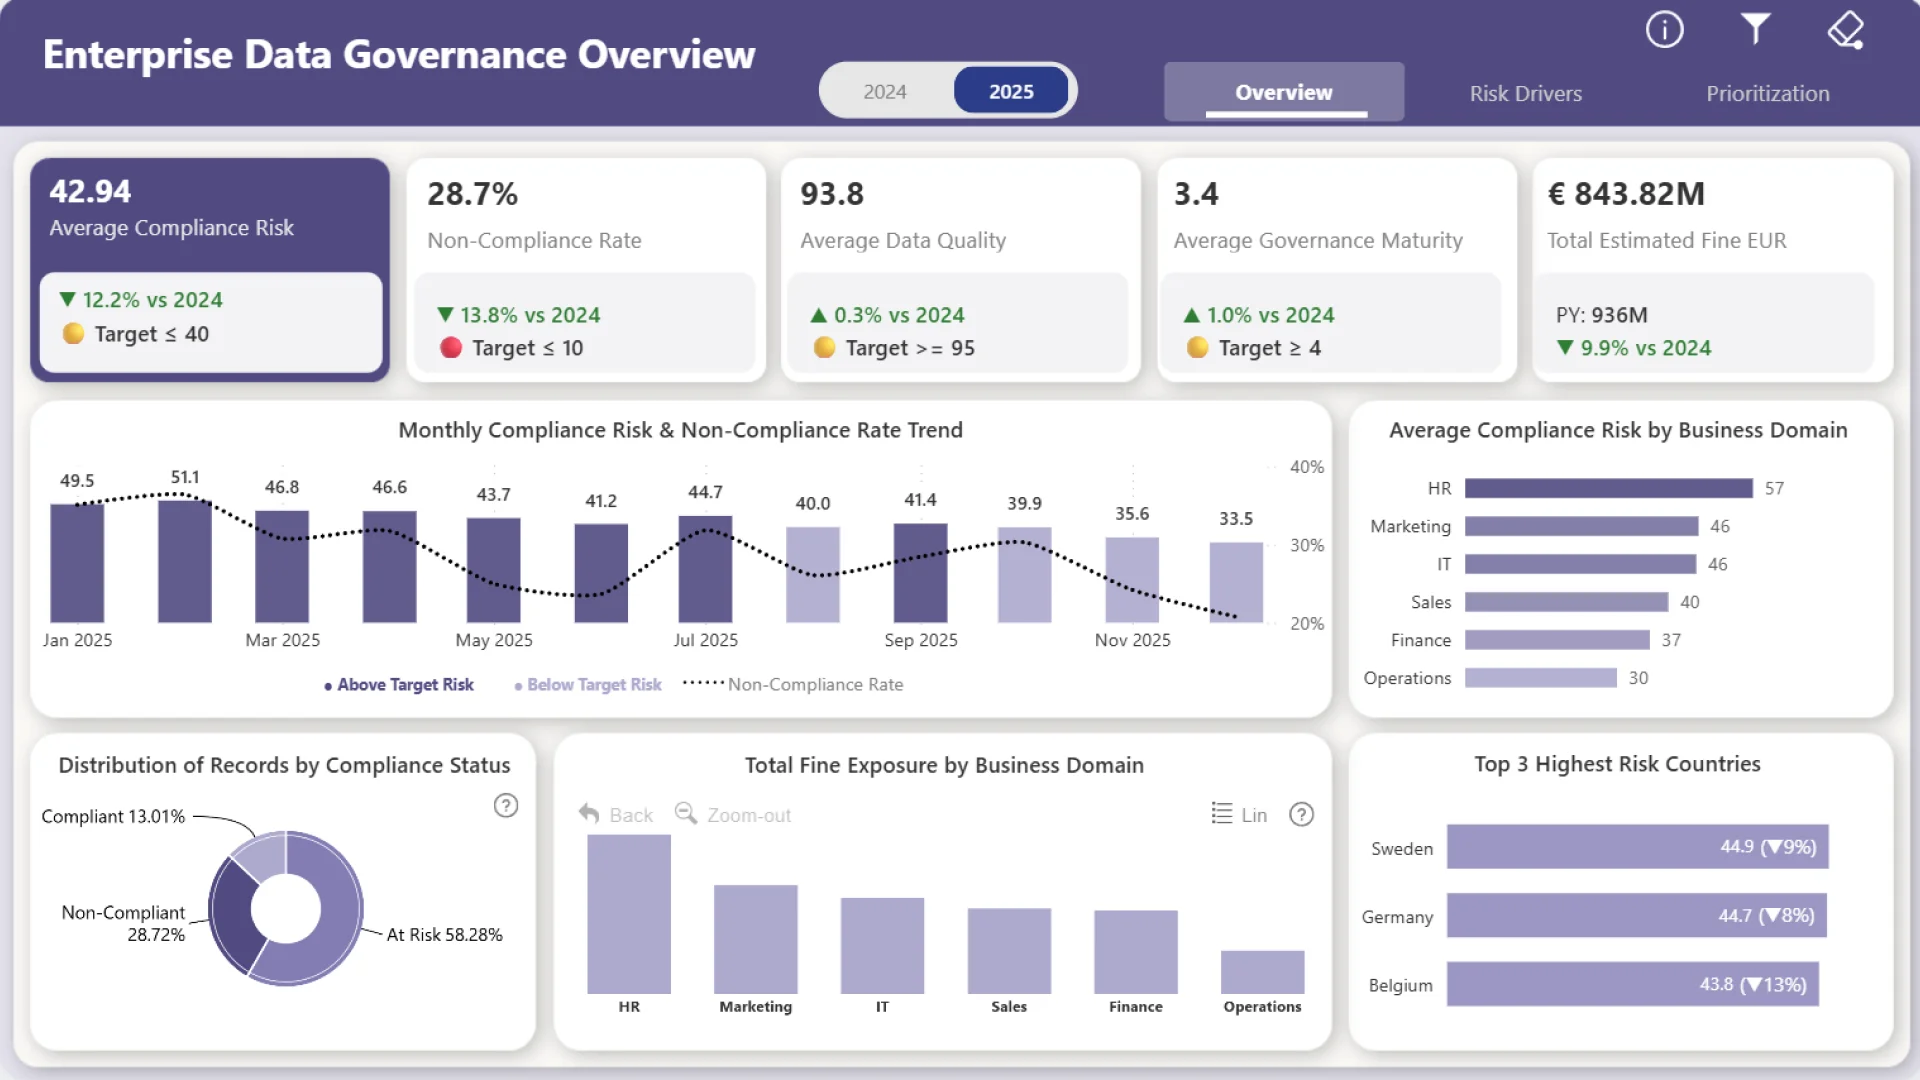
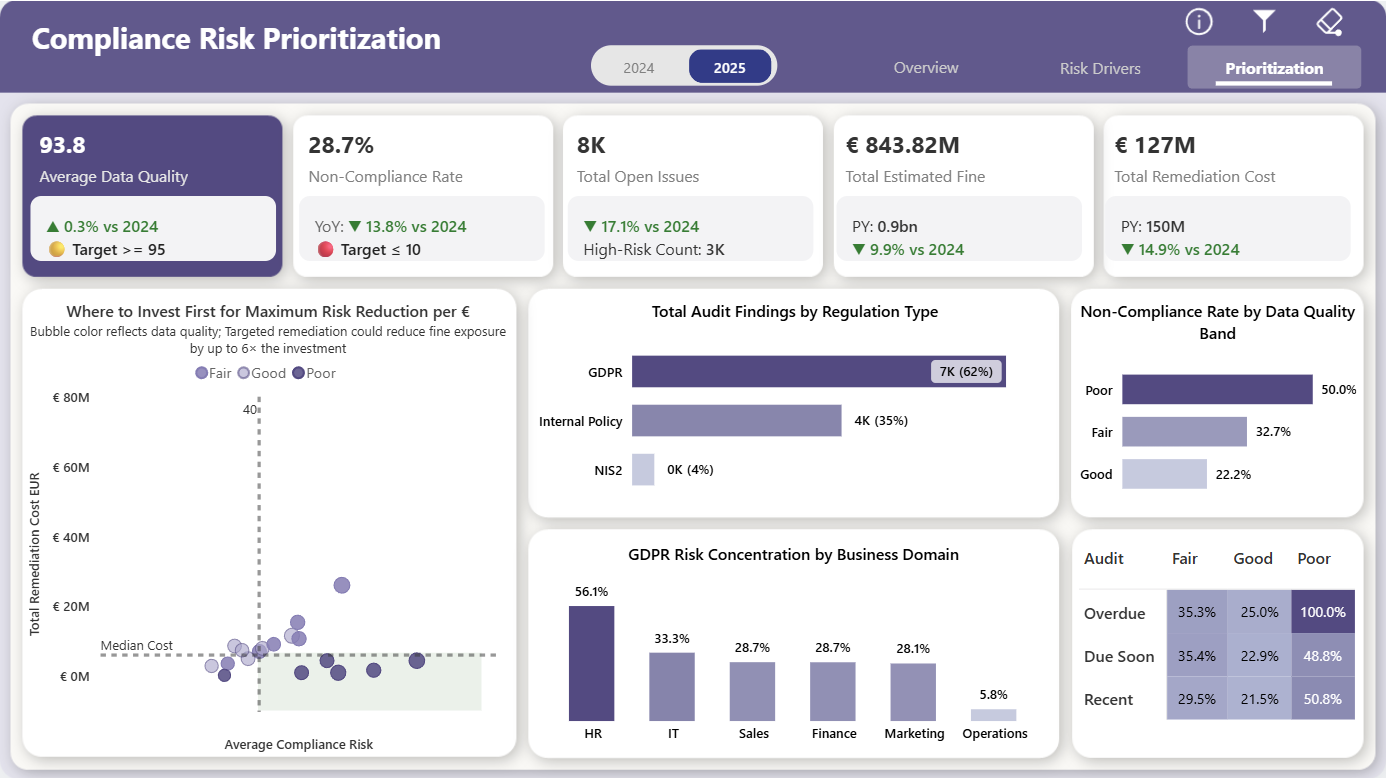
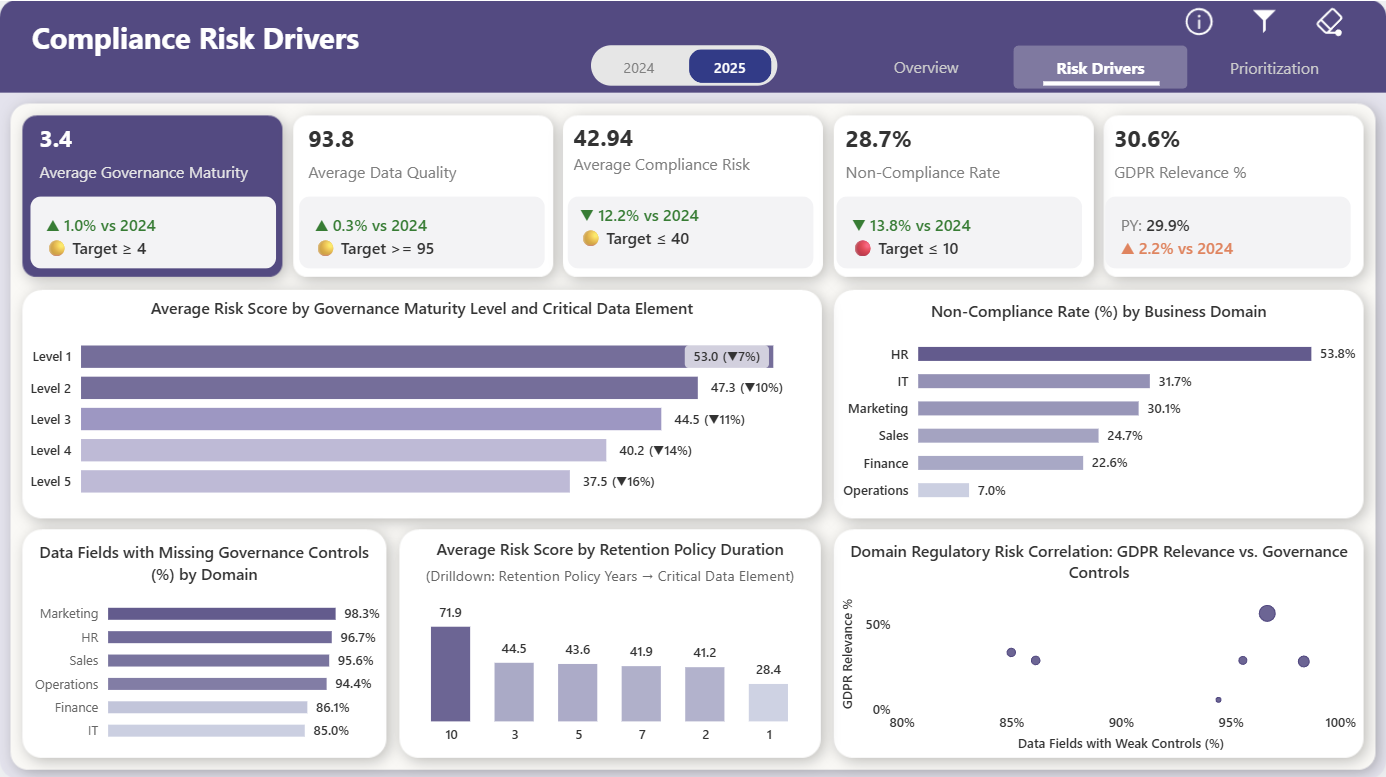
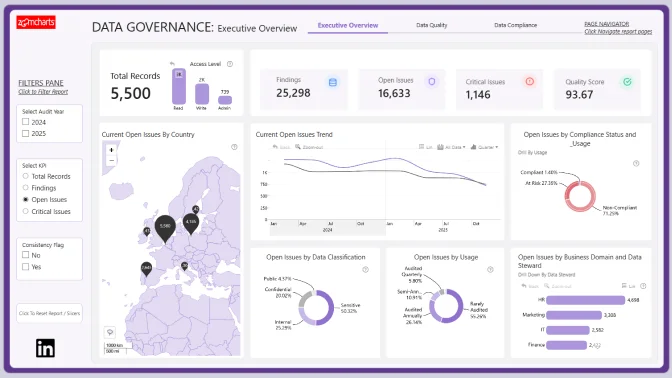
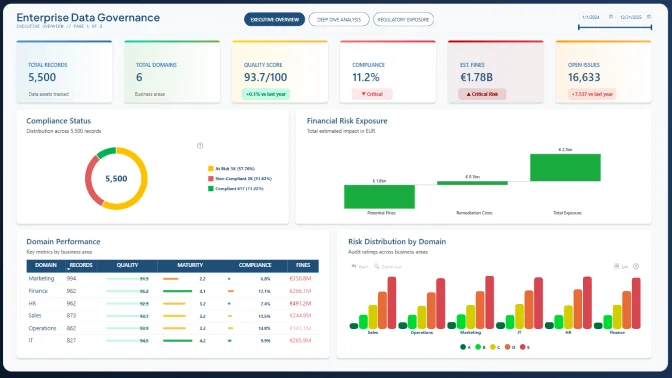
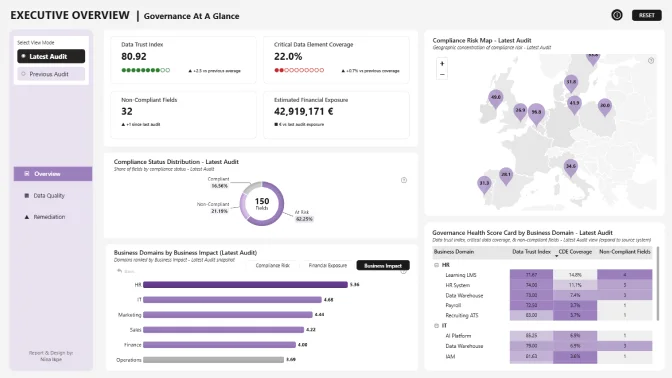
While year-over-year performance has improved (compliance risk down 12.2%, estimated fines down 9.9%), the organization is still operating 186% above the target non-compliance rate. At this exposure level, a single major audit failure or data breach could trigger regulatory penalties exceeding €800M. Leadership needs clear visibility into where risk is concentrated and where investment will deliver the greatest reduction fastest. For this challenge, I designed an executive compliance risk dashboard that connects data governance, regulatory exposure, and financial impact into a single decision-ready narrative.
4U Report Challenges
Participate in data challenges, build and submit reports to get free template downloads.
Join CommunityMobile view allows you to interact with the report. To Download the template please switch to desktop view.
Was this helpful? Thank you for your feedback!
Sorry about that.
How can we improve it?