26
Energy Industry Executive Dashboard
Energy Industry Executive Dashboard
More Report pages
Report Author: yasmeen amjad
26
Share template with others
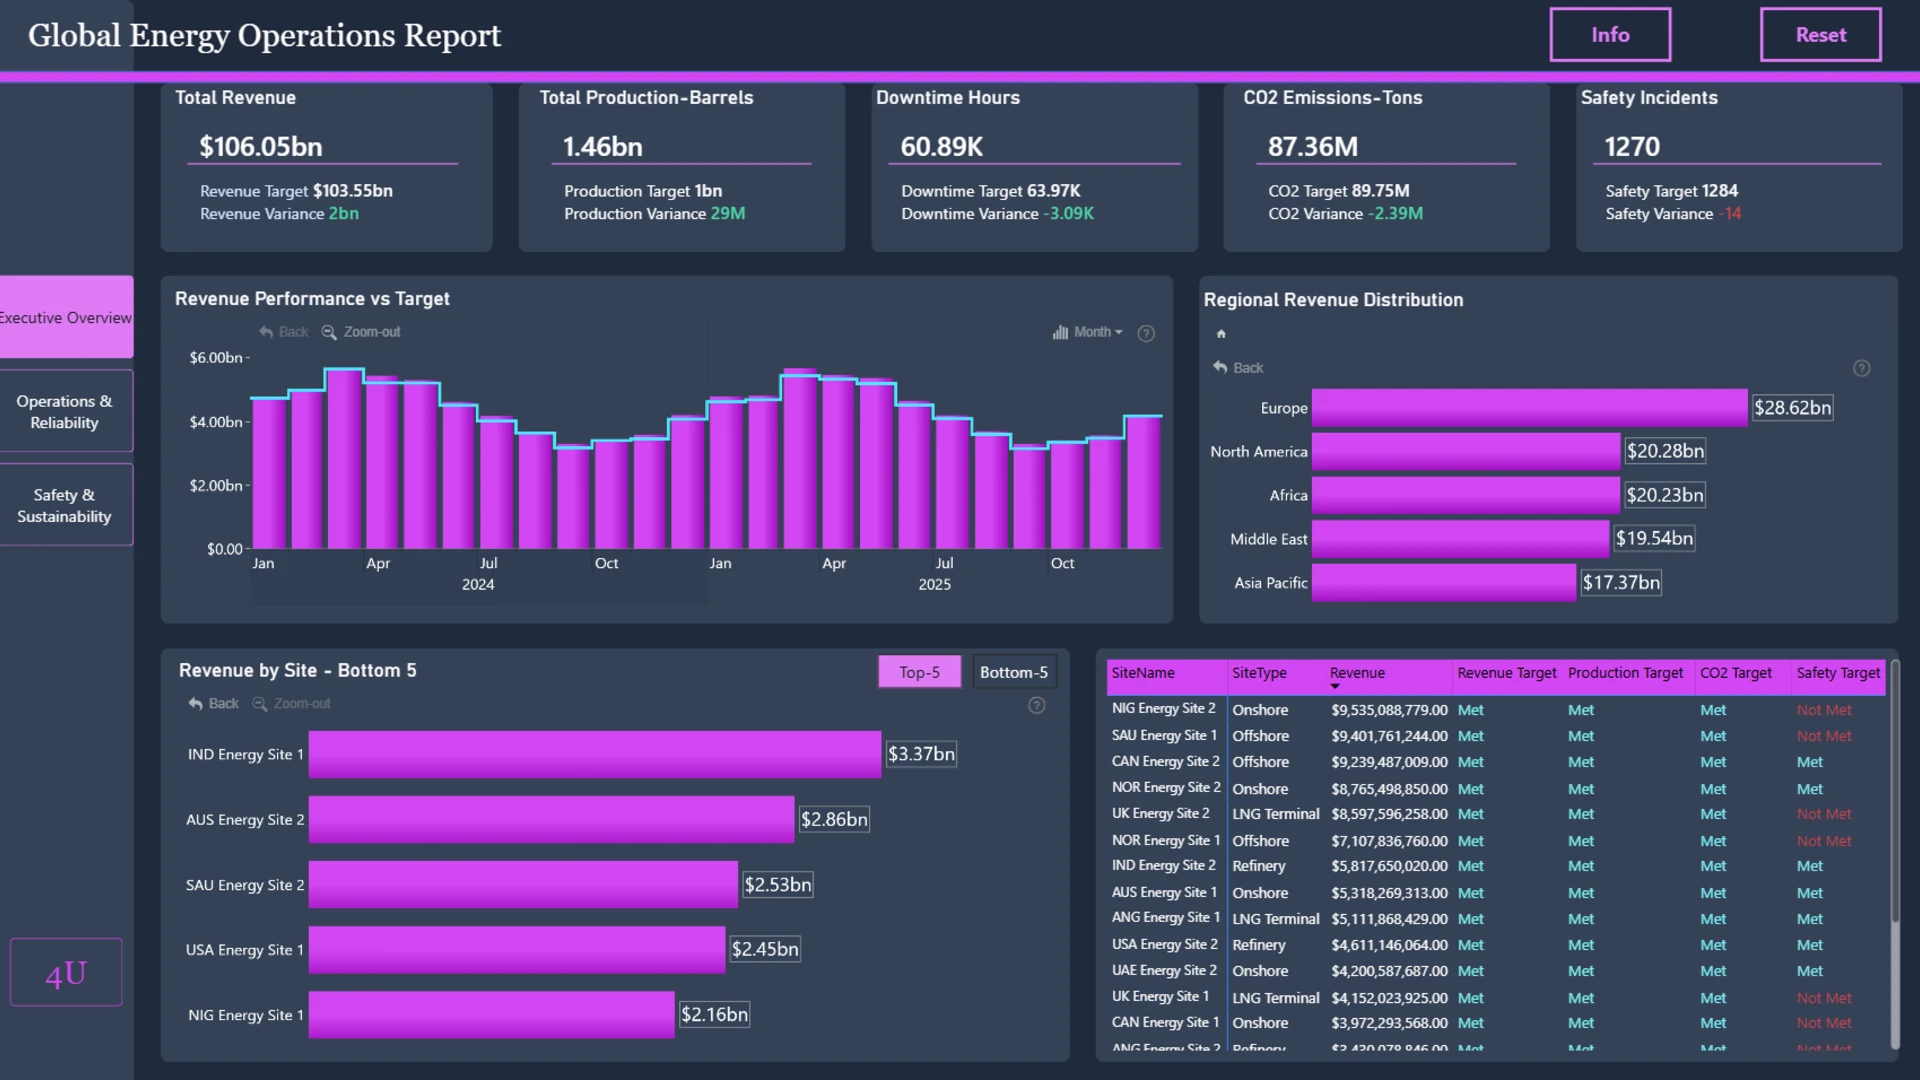
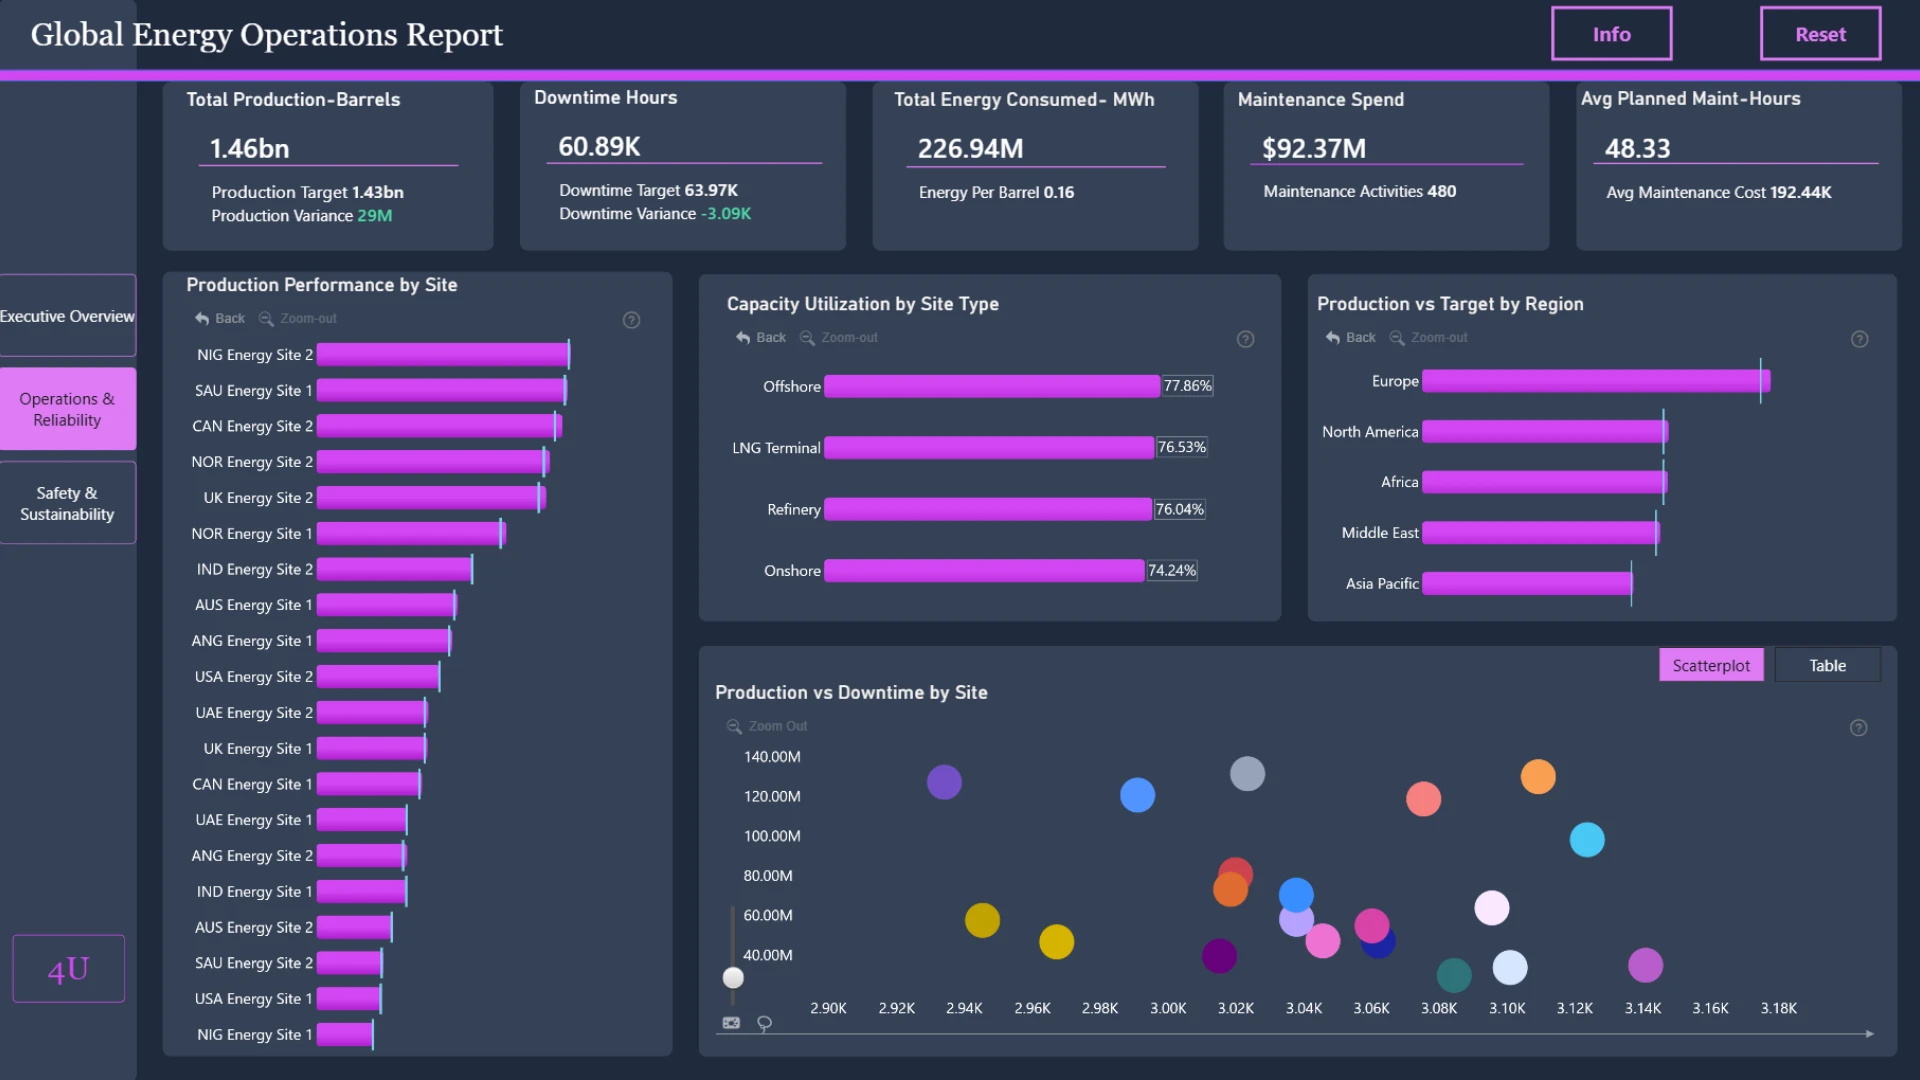
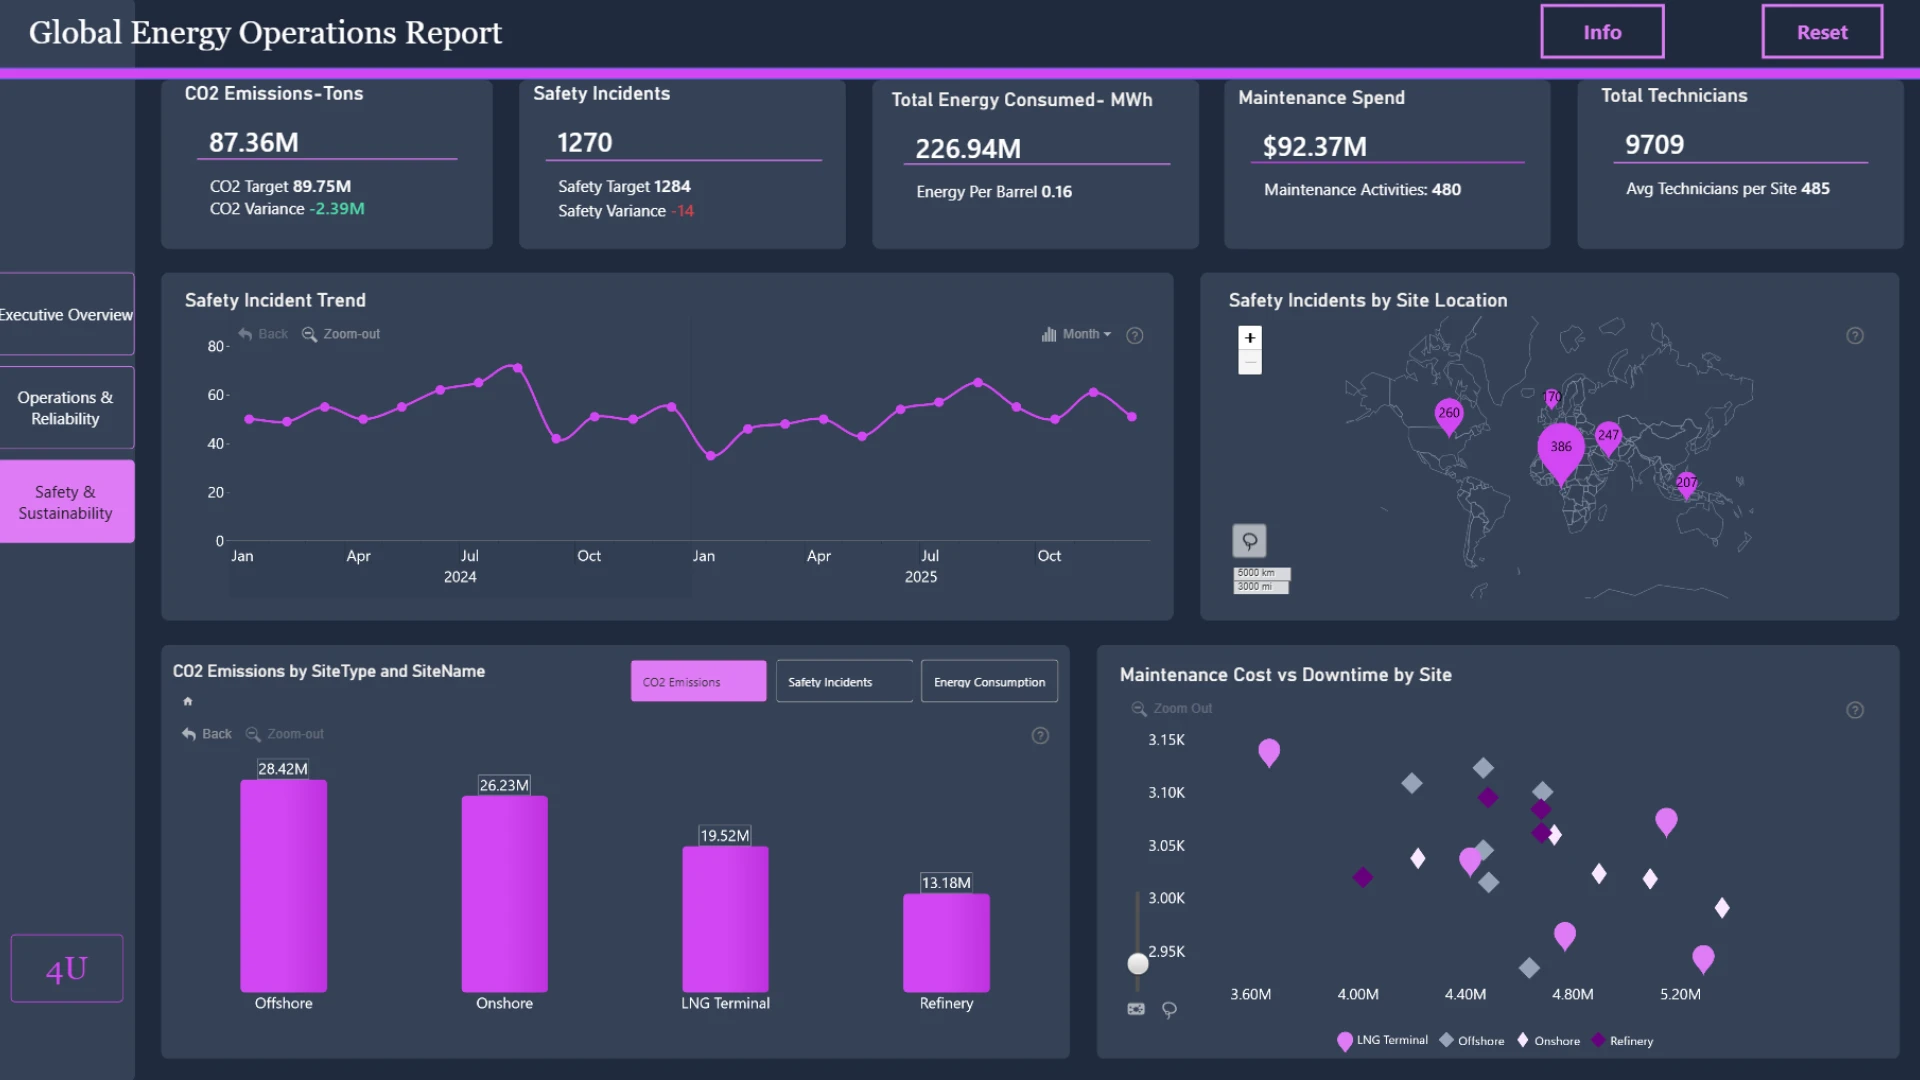
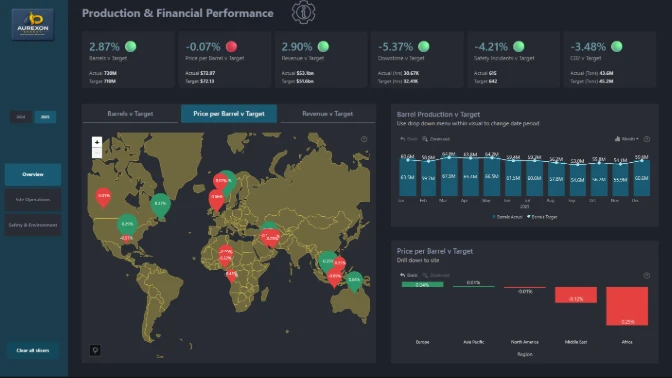
Explore an interactive Power BI dashboard for executive energy insights. Built with native Power BI visuals and ZoomCharts Drill Down Visuals, the report helps analyze production, maintenance, downtime, safety, sustainability, operational performance, and financial KPIs to support better business decisions. This report was created for the ZoomCharts 4U Report Challenge June 2026, where Power BI developers showcase their data visualization expertise by solving real-world business use cases using native Power BI visuals together with ZoomCharts Drill Down Visuals.
Author's description: Developed an interactive Oil, Gas & Energy Operations Report in Power BI to monitor production, revenue, maintenance, safety, and sustainability performance across multiple operational sites. The Report enables executives, operations managers, and plant leaders to track KPIS against targets, identify operational risks, and evaluate asset reliability. Advanced analytics were used to assess production efficiency, downtime impact, maintenance effectiveness, and environmental performance. The Report provides actionable insights through trend analysis, site-level benchmarking, and performance scorecards. This solution supports data-driven decision-making to improve operational efficiency, safety compliance, and sustainable energy operations.
ZoomCharts visuals used
4U Report Challenges
Participate in data challenges, build and submit reports to get free template downloads.
Join CommunityMobile view allows you to interact with the report. To Download the template please switch to desktop view.
Was this helpful? Thank you for your feedback!
Sorry about that.
How can we improve it?