769
Ecommerce Performance Analysis
Ecommerce Performance Analysis
Report Author: Ugochukwu Nwasuruba
769
Share template with others
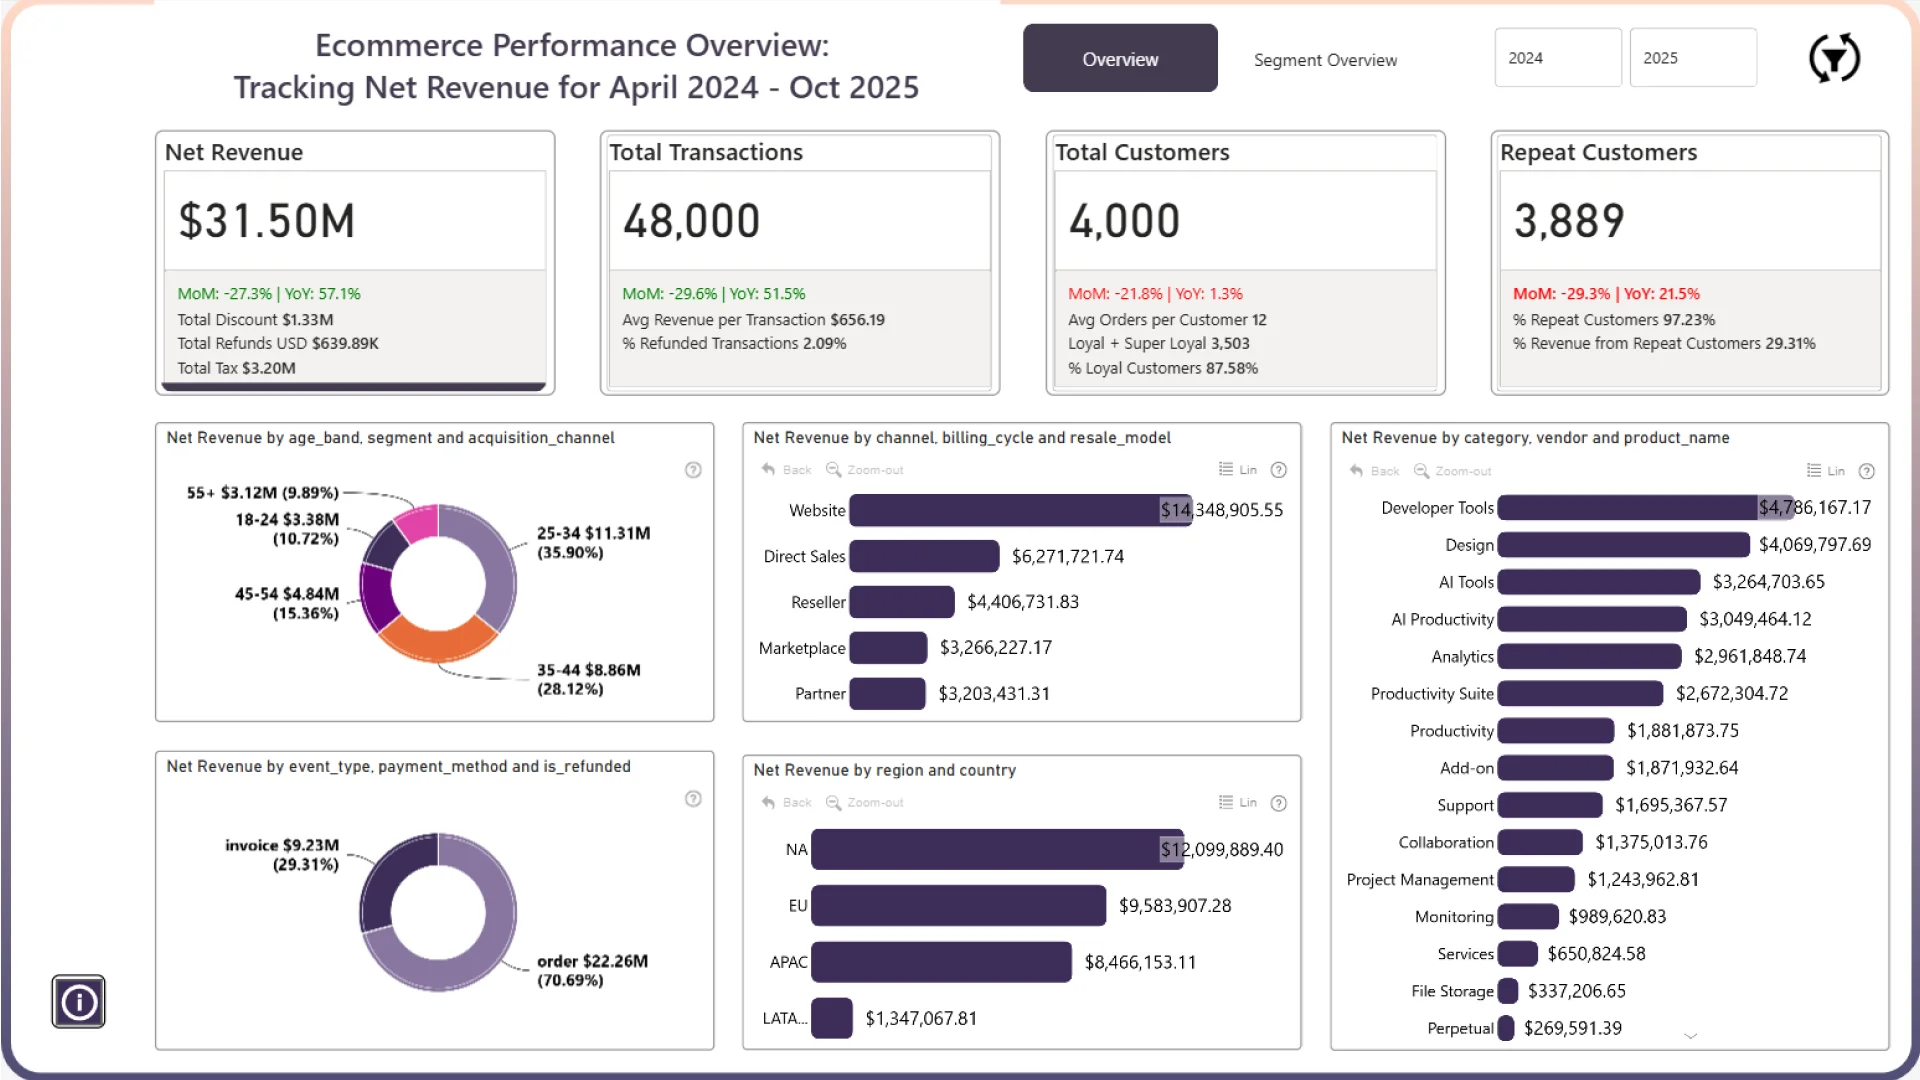
This Power BI report uses the e-commerce sales dataset from a global software retailer that sells subscriptions and add-ons across analytics, design, collaboration, and AI. The report features ZoomCharts Drill Down PRO custom visuals for Power BI. It was submitted to the Onyx Data DataDNA ZoomCharts Mini Challenge in October 2025.
Author description:
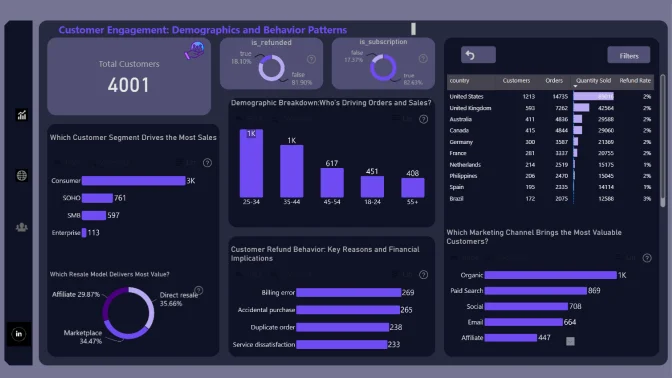
This report provides a two-page overview of ecommerce performance, combining headline KPIs with customer segment insights. Page 1 tracks revenue, transactions, customer growth, and repeat behavior across selected periods. Page 2 analyzes financial contribution, engagement depth, and loyalty trends across behavioral segments — highlighting how customer types drive profitability and retention
4U Report Challenges
Participate in data challenges, build and submit reports to get free template downloads.
Join CommunityMobile view allows you to interact with the report. To Download the template please switch to desktop view.

Was this helpful? Thank you for your feedback!
Sorry about that.
How can we improve it?