637
E-commerce Data Analysis
E-commerce Data Analysis
Report Author: Brian Ochigbo Sule
637
Share template with others
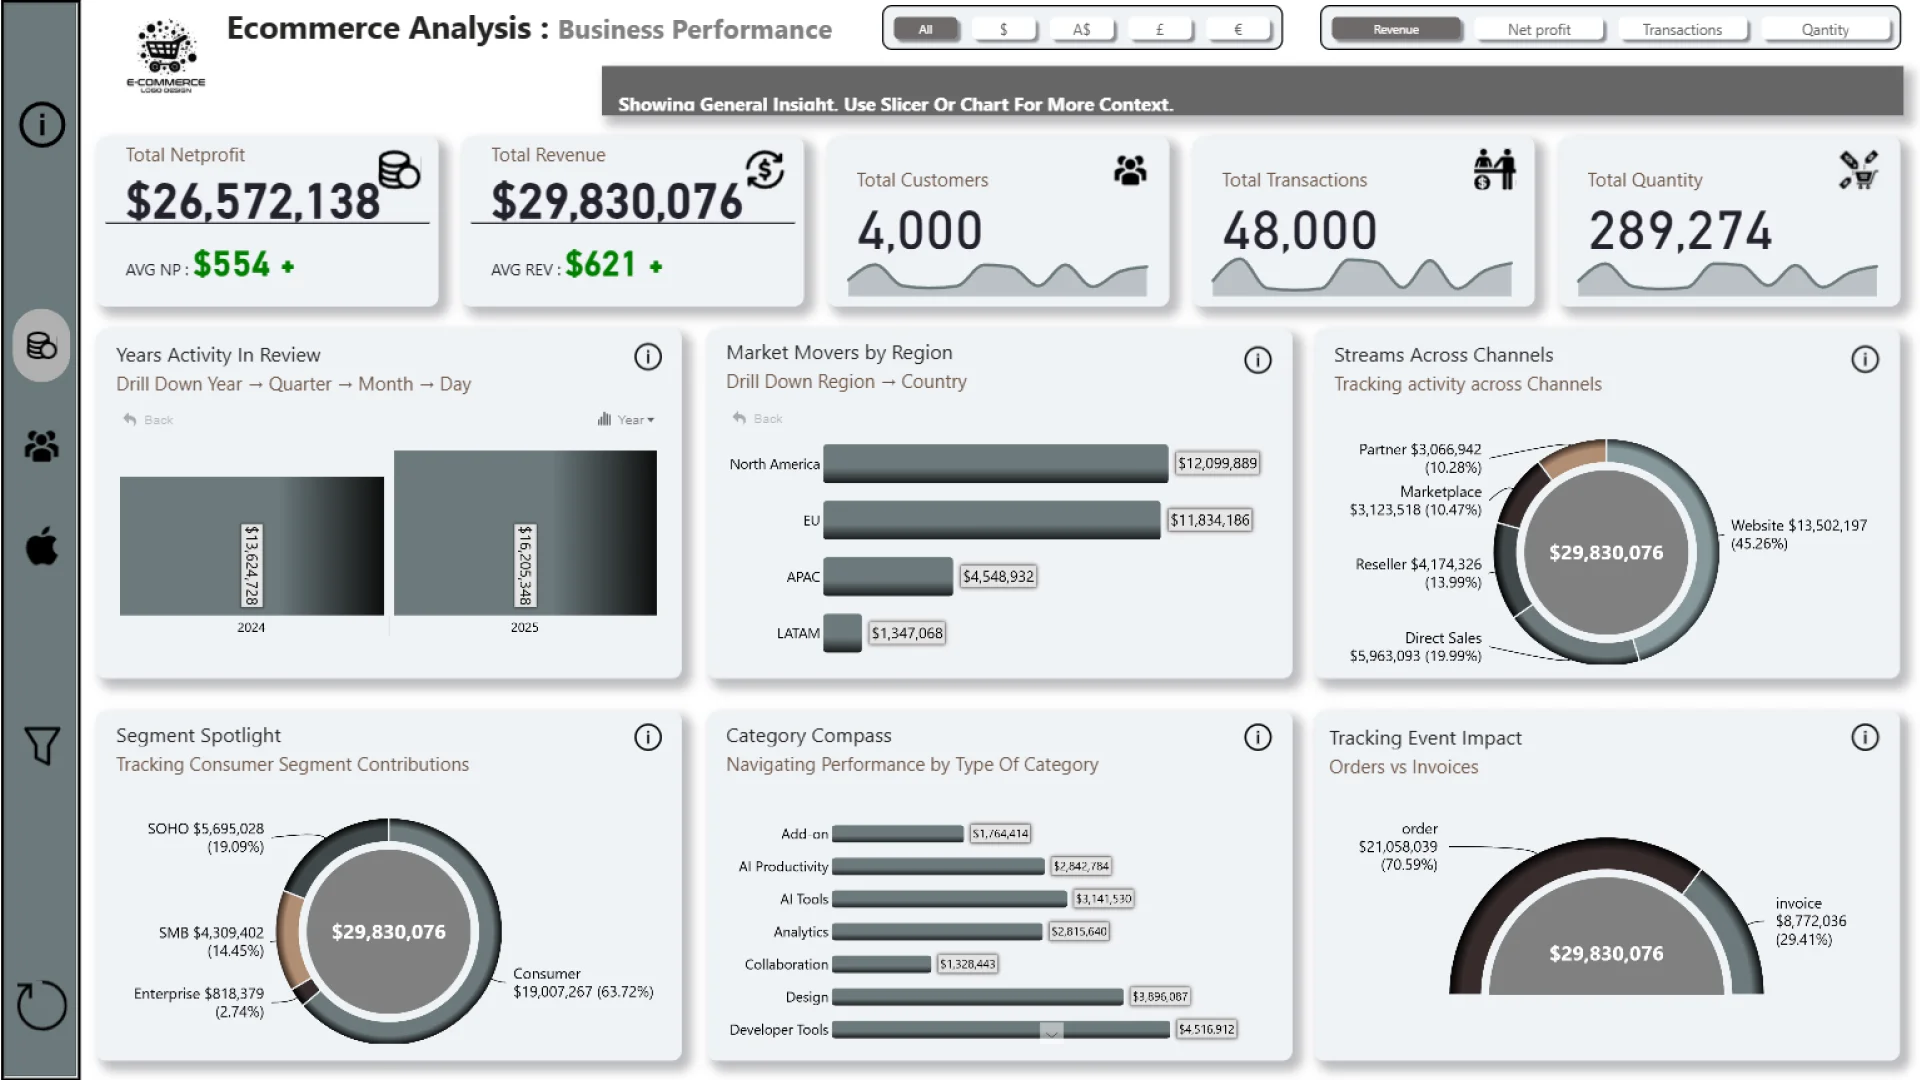
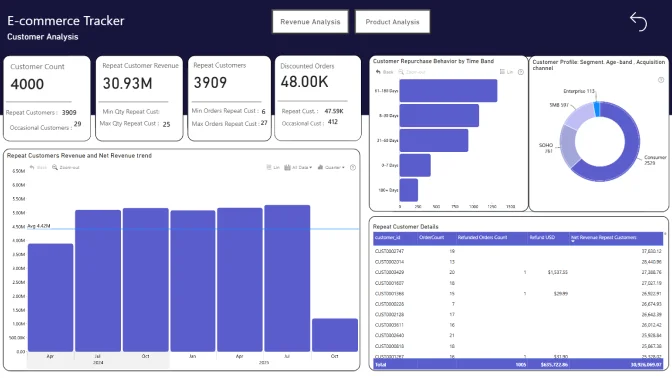
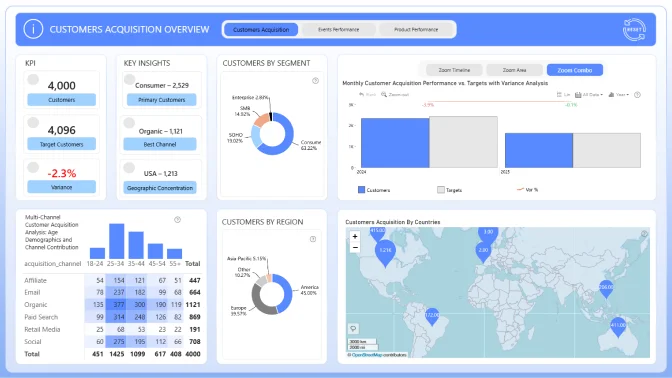
This Power BI report uses the e-commerce sales dataset from a global software retailer that sells subscriptions and add-ons across analytics, design, collaboration, and AI. The report features ZoomCharts Drill Down PRO custom visuals for Power BI. It was submitted to the Onyx Data DataDNA ZoomCharts Mini Challenge in October 2025.
Author description:
Resubmission of my entry for the ZoomCharts Mini Challenge on the Ecommerce Data set. Reasons: 1: The "average quantity per product kpi" when filtered by a product below the "bench marked" average the number dosent reveal the true story in line with the conditional formating. 2: Added "product name" to the "product table" to work along side "product id" for swift identification of the product.
4U Report Challenges
Participate in data challenges, build and submit reports to get free template downloads.
Join CommunityMobile view allows you to interact with the report. To Download the template please switch to desktop view.

Was this helpful? Thank you for your feedback!
Sorry about that.
How can we improve it?