53
E-commerce Analytics Power BI Dashboard
E-commerce Analytics Power BI Dashboard
More Report pages
Report Author: Samim Imtiaz
53
Share template with others
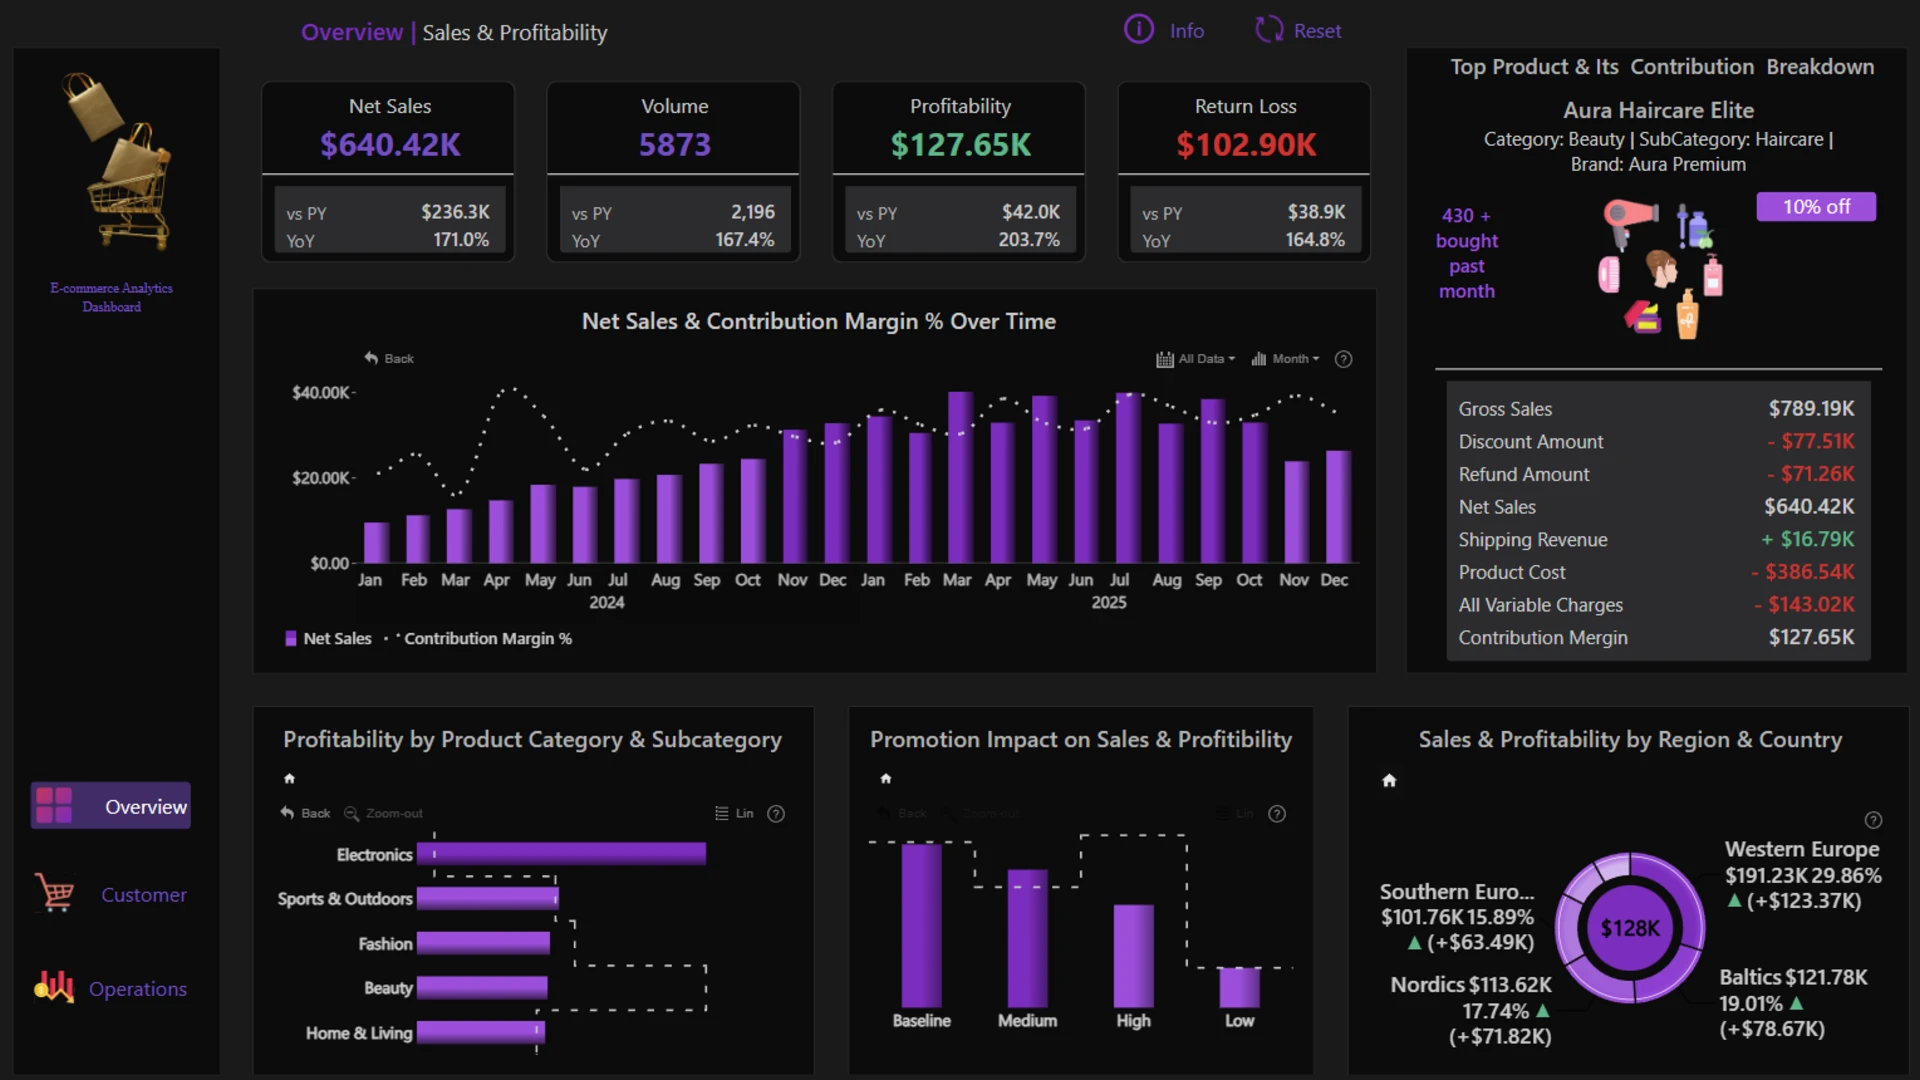
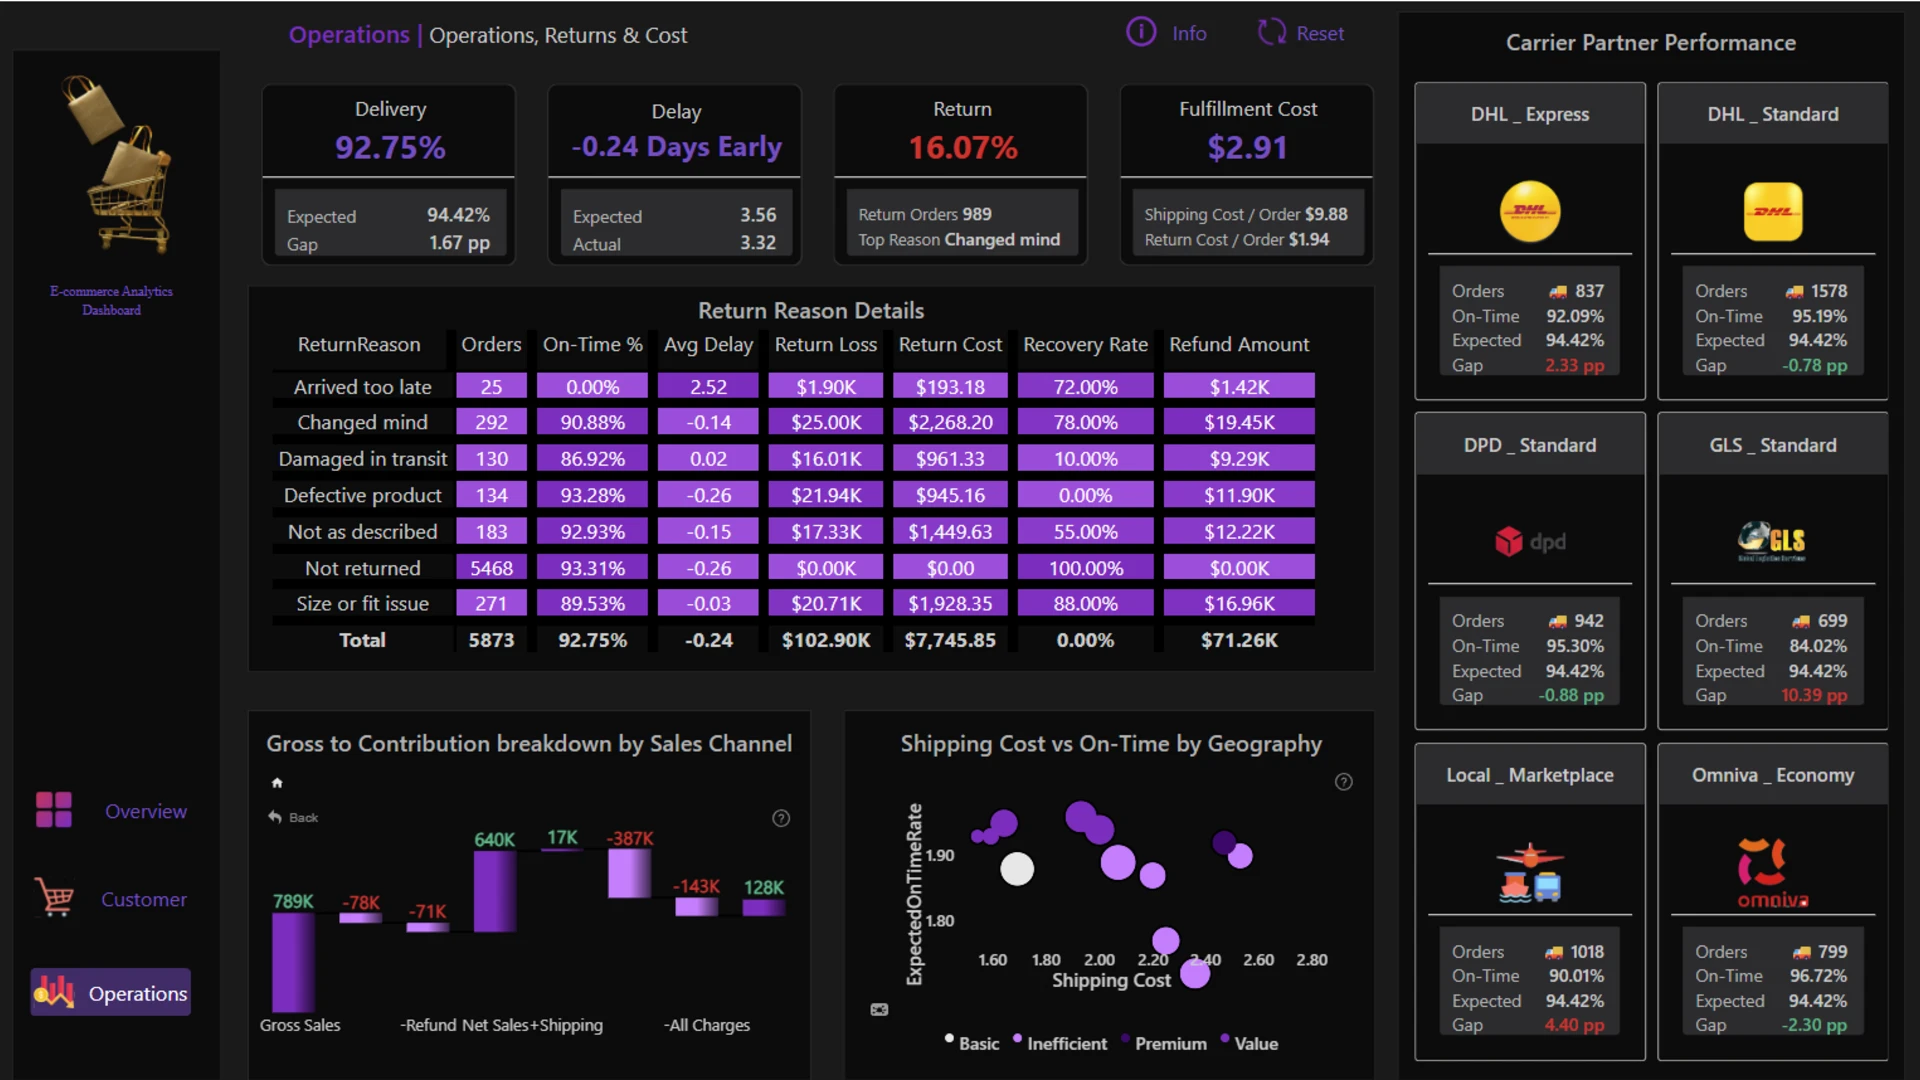
This three-page Power BI dashboard gives a complete view of e-commerce performance, bringing together sales, profitability, customer behaviour, product preferences, returns, delivery performance, shipping partners, and operational costs.
The report is built around three main business questions: how the business is performing, what is driving those results, and where operational issues are reducing value.
Page 1: Sales & Profitability Overview
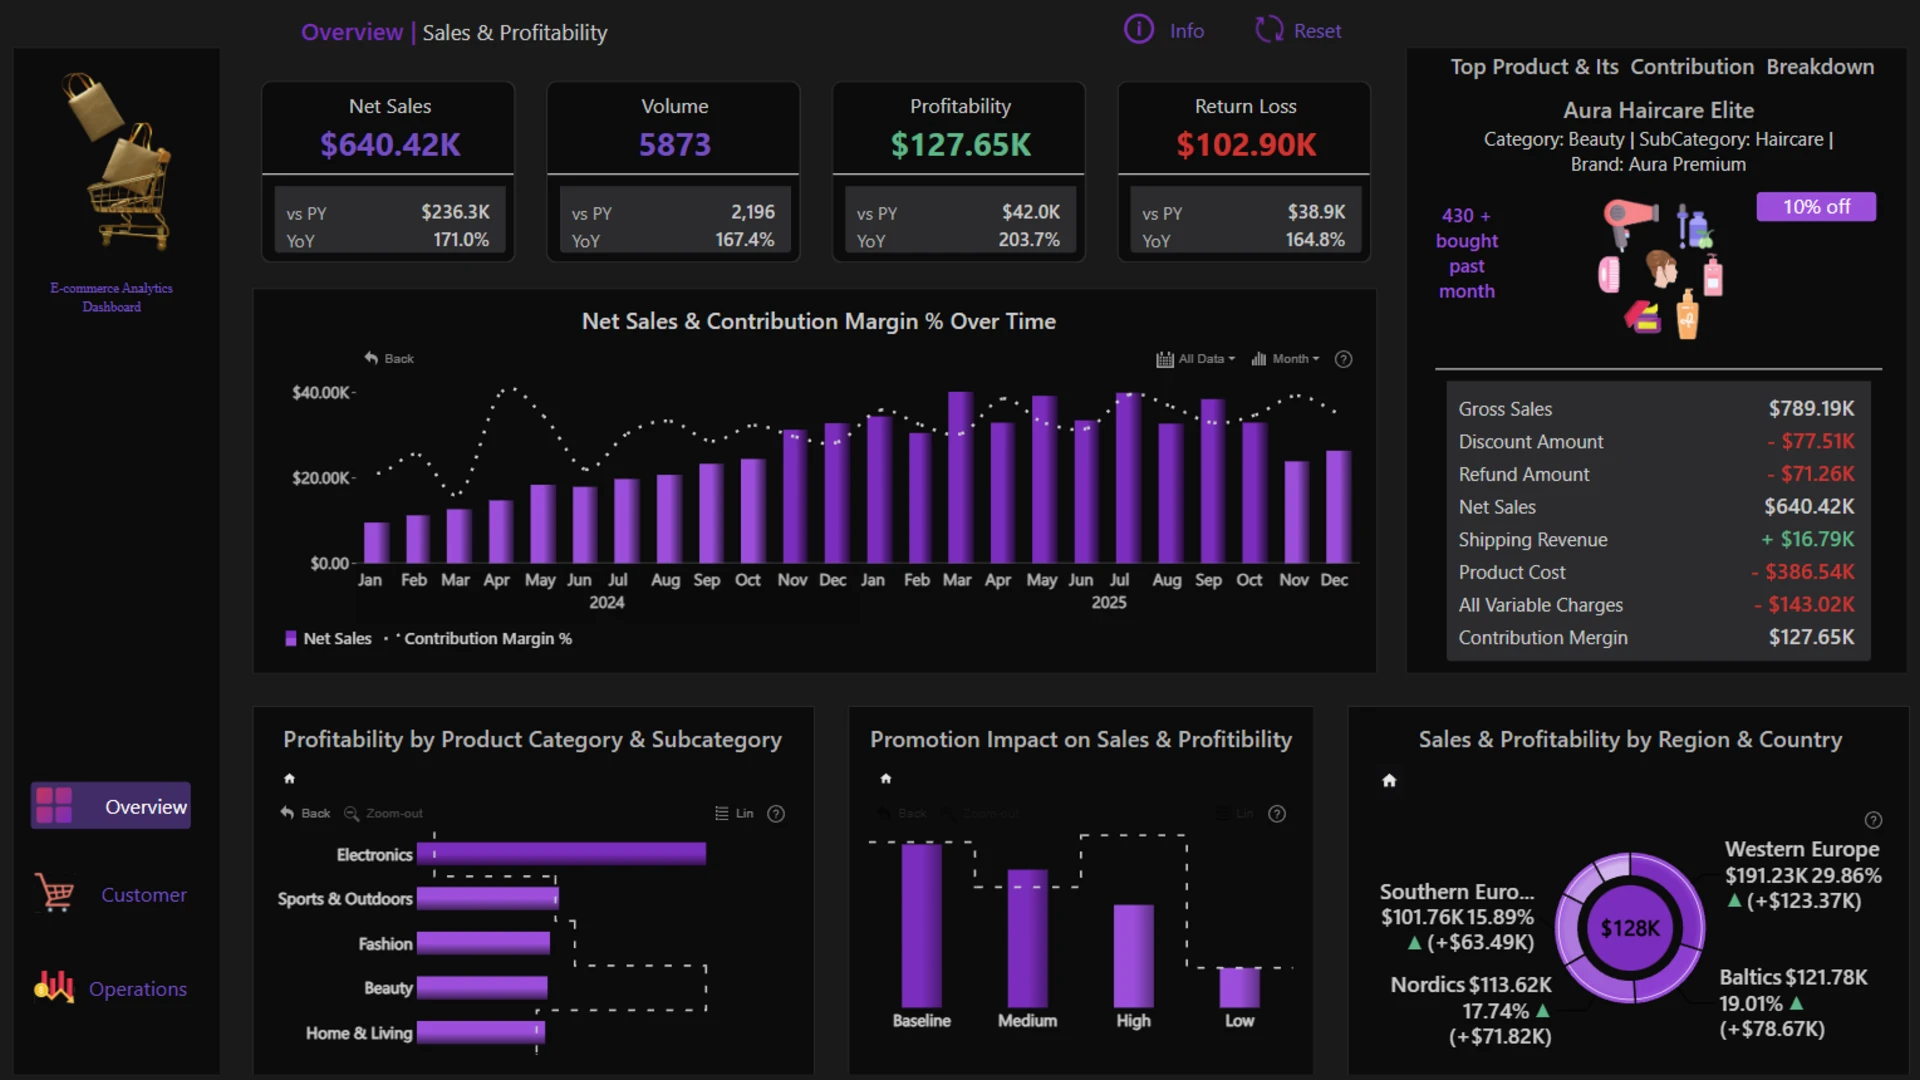
The first page focuses on overall business performance. It shows how much the business is selling, how sales are changing, and how those sales translate into contribution margin.
Users can compare profitability across products, categories, regions, and countries, review the effect of promotions, and see how much value is being lost through returns. A margin view also helps explain how gross sales are reduced by different cost components before reaching final contribution margin.
Page 2: Customer & Product Drivers
The second page looks at who is driving performance and which products matter most to different customer groups.
It explores customer size, order frequency, customer value, return exposure, loyalty tiers, and customer segments. Product preferences can also be analysed by age group and geography, making it easier to understand how customer behaviour differs across the business.
Page 3: Operations, Returns & Cost
The final page focuses on where value is being lost operationally. It covers delivery performance, delays, return reasons, return-related losses, recoverable value, shipping partner performance, and service costs.
Users can compare shipping partners, identify locations with high costs and weaker service levels, and see where revenue is being consumed before it reaches contribution margin.
Overall, the dashboard connects financial, customer, and operational performance in one report, making it easier to move from headline results to the areas that need closer attention.
ZoomCharts visuals used






4U Report Challenges
Participate in data challenges, build and submit reports to get free template downloads.
Join CommunityMobile view allows you to interact with the report. To Download the template please switch to desktop view.
How to use a PBIX template
Preview the interactive report, download the PBIX file, open it in Power BI Desktop, and replace the same data connection with your own dataset.
Preview and download
Explore the report online and download the PBIX template file.
Open in Power BI Desktop
Open the downloaded PBIX file in Power BI Desktop.
Connect your data
Replace the sample data source with your own dataset.
Refresh and adjust
Refresh the model and update fields or visual were needed.
Save and share
Save your report and publish it for your audience.


