1161
🎄Christmas Sales and Trends Analysis🎄 6
🎄Christmas Sales and Trends Analysis🎄 6
More Report pages
Report Author: Natnicha Taosiri
1161
Share template with others
Report submitted for the FP20 Analytics ZoomCharts Challenge, December 2024. The report was built using the Christmas Sales & Trends Dataset and includes ZoomCharts custom Drill Down PRO visuals for Power BI.
Author's description:
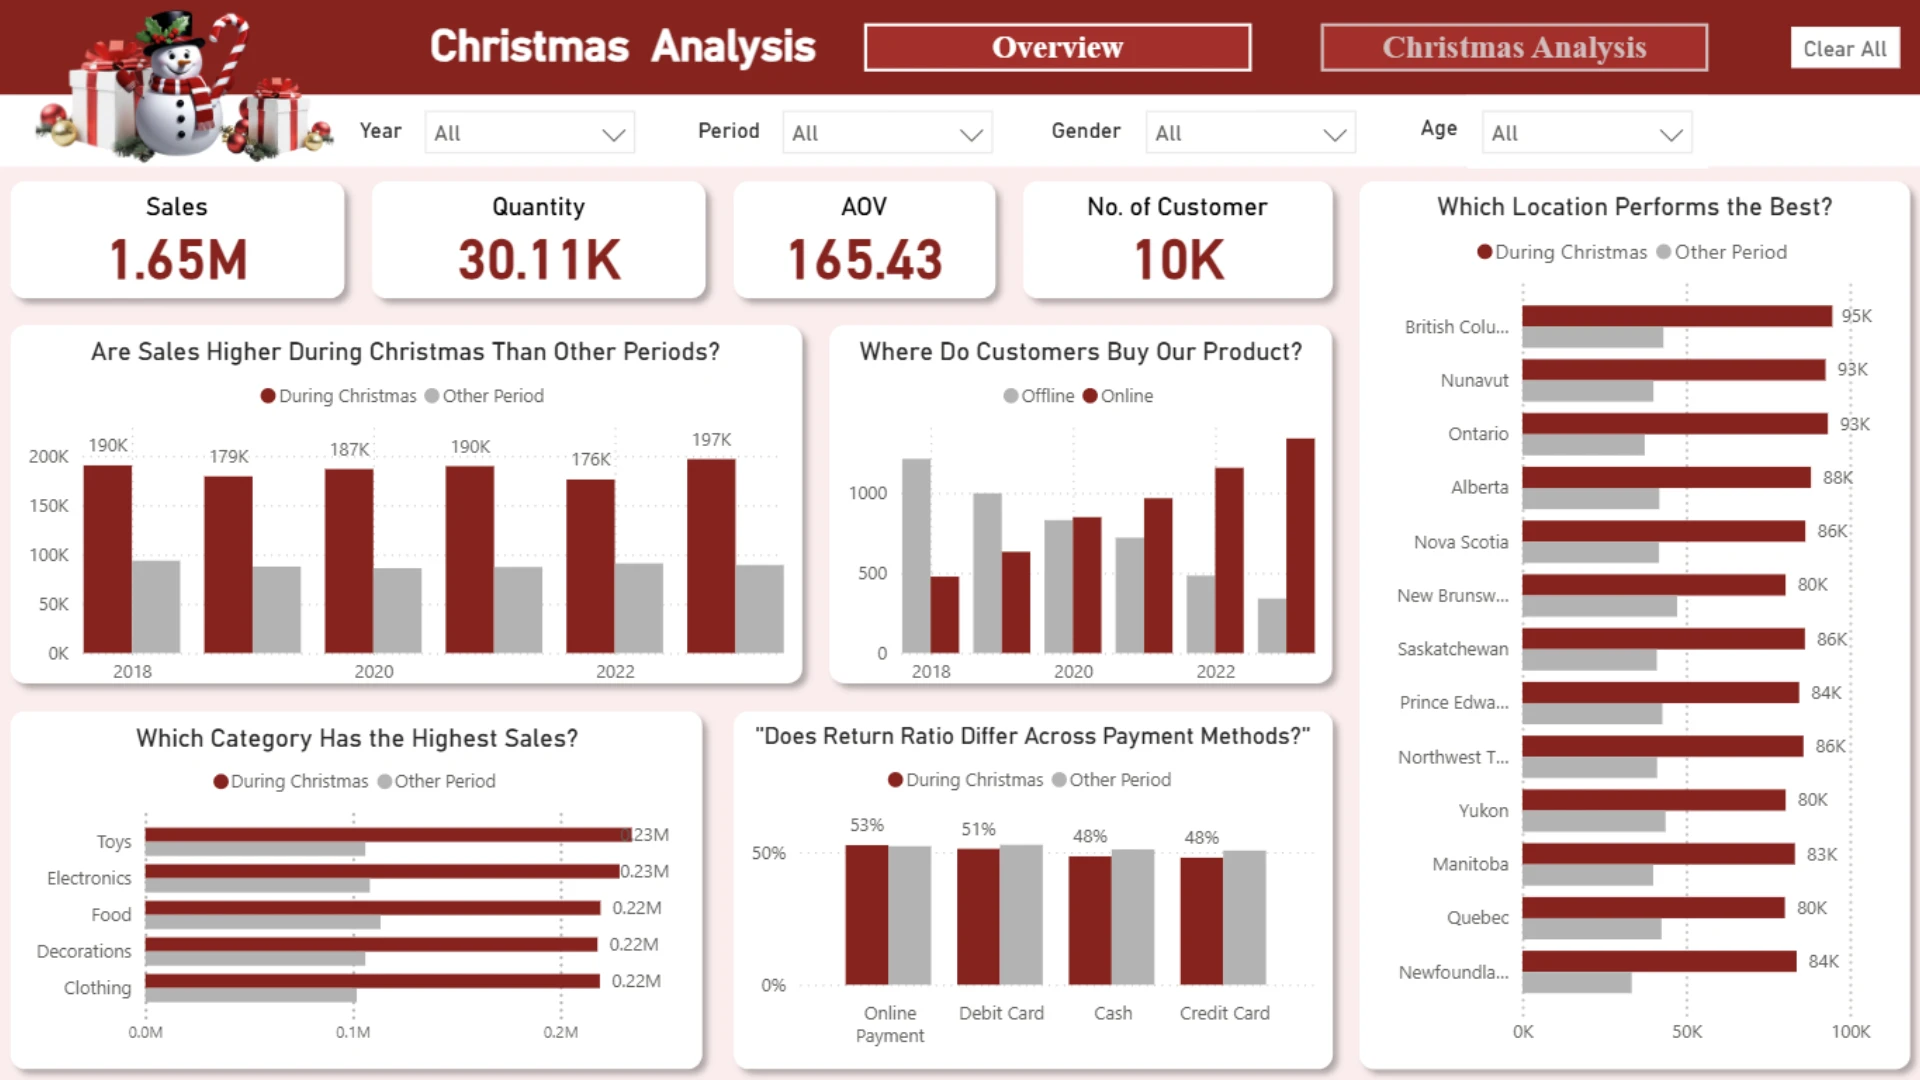
📊 From the Overview Page:
- Total Sales: The total sales from 2018-2023 amount to $1.65M, with Christmas sales (Nov-Dec) outperforming non-Christmas periods every year. In 2023, Christmas sales reached an impressive $196,768.
- Sales Channels: Online shopping has gained popularity each year, surpassing offline sales since 2020. By 2023, 1,339 customers shopped online.
- Best-Selling Products:
- During Christmas: The top-selling product is Toys.
- Non-Christmas Periods: The best-seller is Food.
- Top Sales Locations:
- During Christmas: British Columbia leads in sales.
- Non-Christmas Periods: New Brunswick takes the top spot.
- Product Returns:
- During Christmas: Online payments have the highest return rate at 53%.
- Non-Christmas: Debit card payments also have a return rate of 53%.
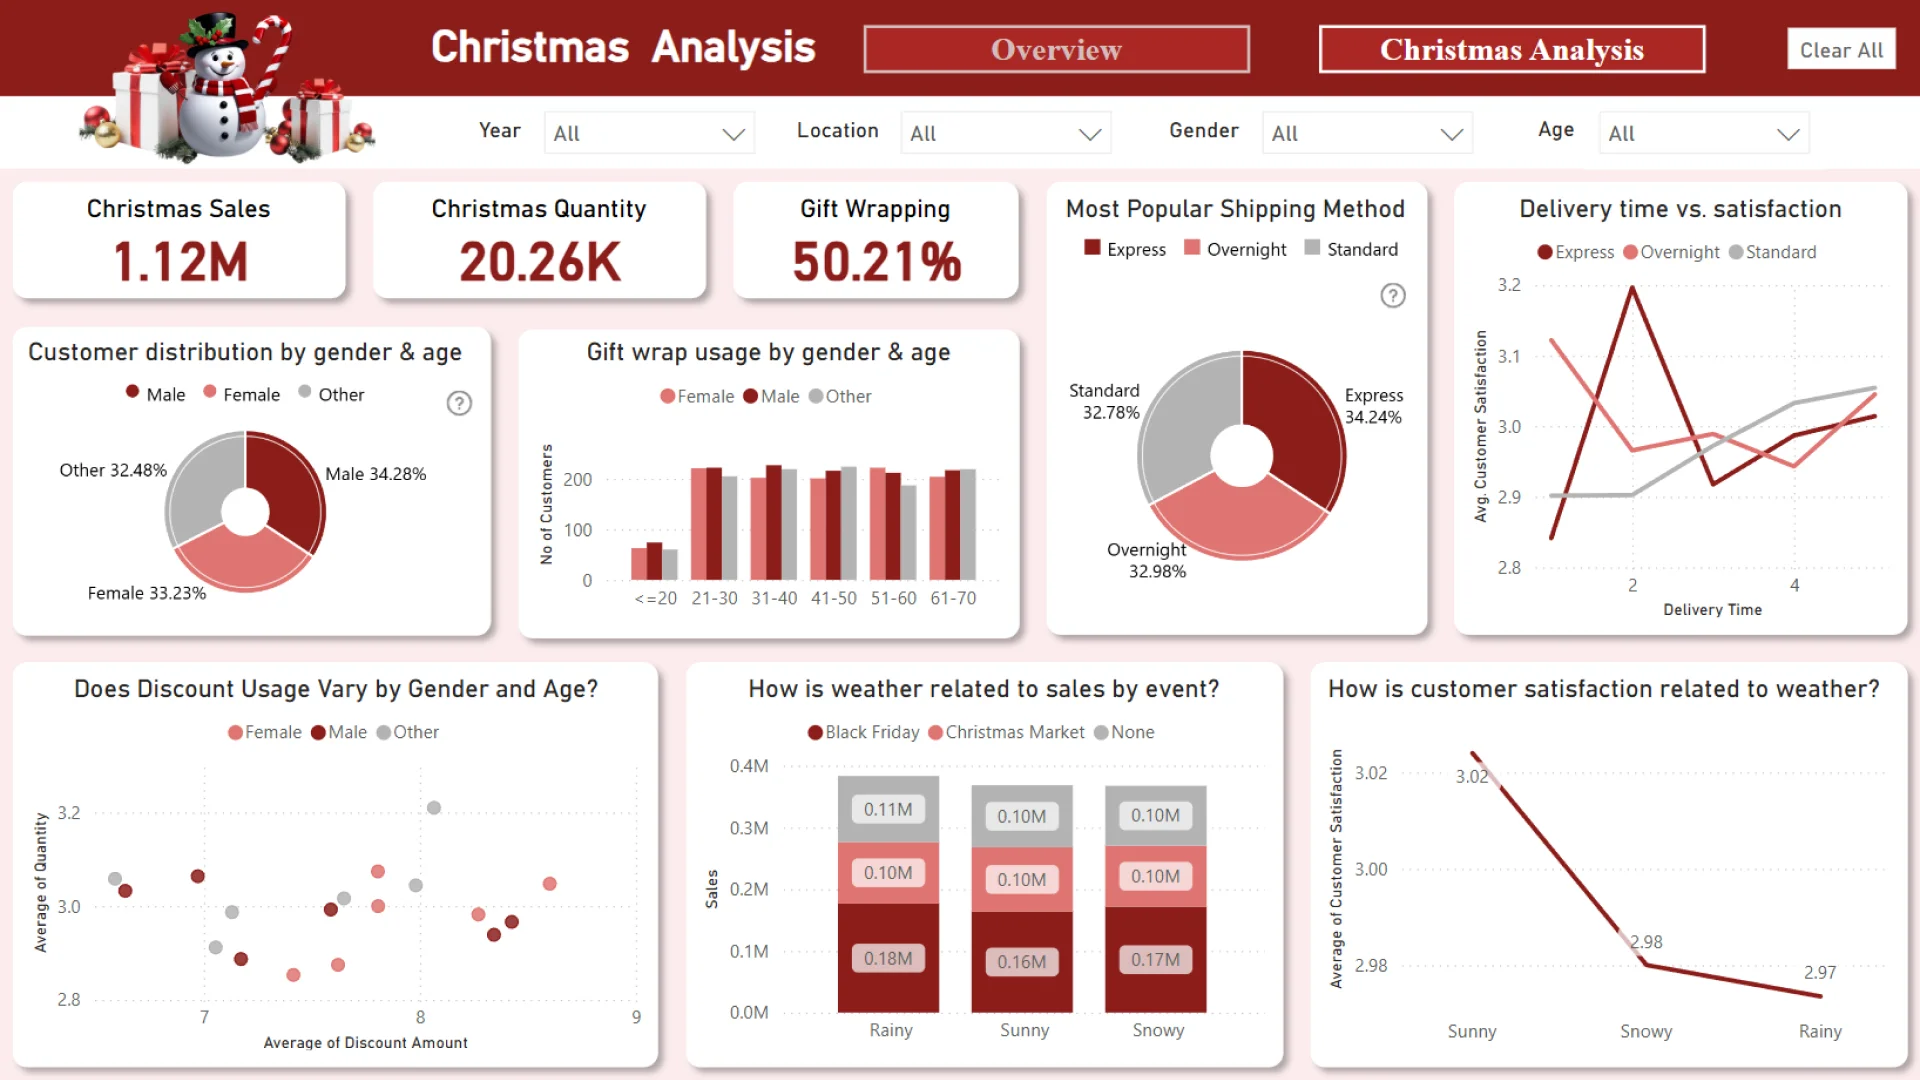
🎄 From the Christmas Page:
- Customer Demographics: Most Christmas customers are men aged 51-60, with the most popular products being Clothing and Toys.
- Gift Wrapping Usage:
- Overall: 50.21% of orders during Christmas include gift wrapping.
- Most Likely to Use: Men aged 31-40.
- Shipping Methods and Satisfaction:
- Express: The most popular method, with 2-day delivery being the most satisfying.
- Overnight: Second most popular, with 1-day delivery being ideal.
- Standard: Third, with 5-day delivery meeting satisfaction.
- Discount Usage: Women tend to use discount amounts more than other genders.
- External Factors Influencing Sales:
- Highest Sales Weather: Surprisingly, it’s Rainy rather than Snowy.
- Top Event for Sales: Black Friday.
- Customer Satisfaction Scores: The highest satisfaction scores are recorded during Sunny weather.
ZoomCharts visuals used
4U Report Challenges
Participate in data challenges, build and submit reports to get free template downloads.
Join CommunityMobile view allows you to interact with the report. To Download the template please switch to desktop view.

Was this helpful? Thank you for your feedback!
Sorry about that.
How can we improve it?