514
Business KPI Report Power BI
Business KPI Report Power BI
More Report pages
Report Author: Gbenga Emmanuel Popoola
514
Share template with others
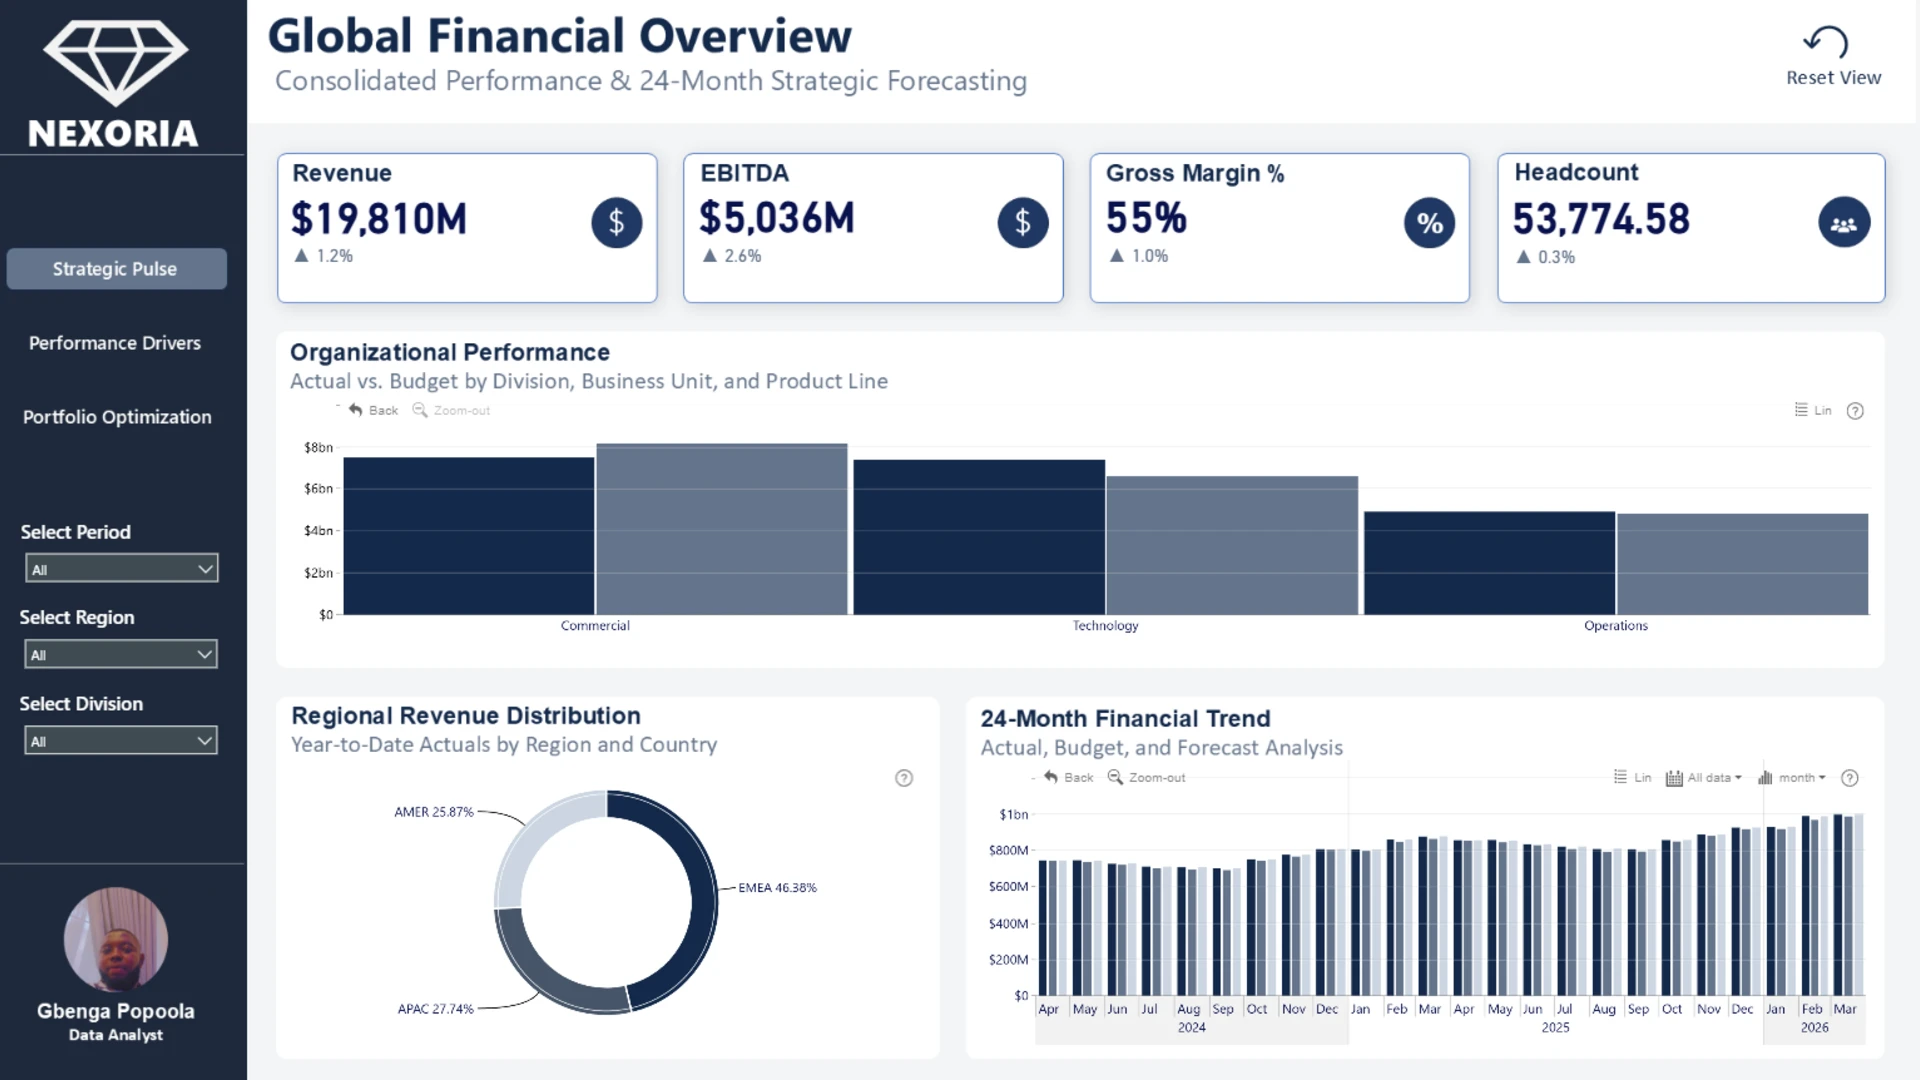
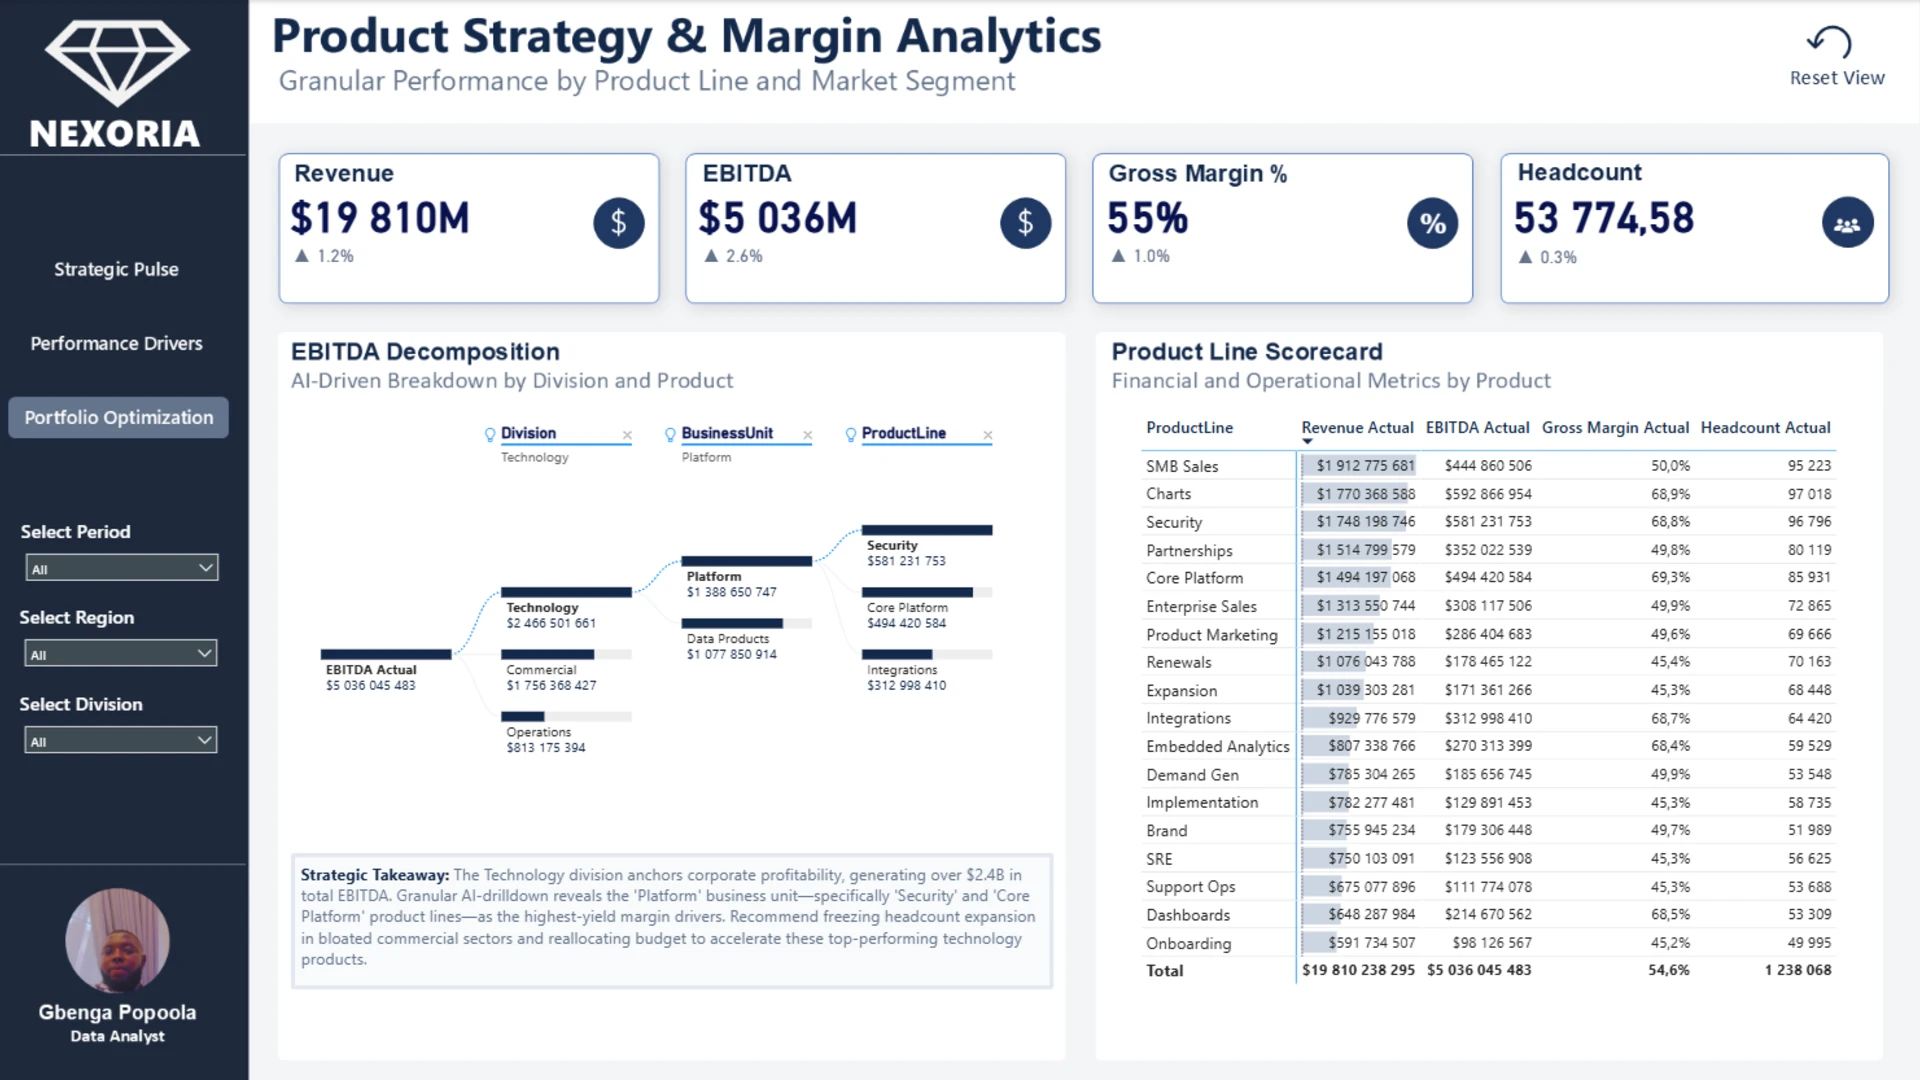
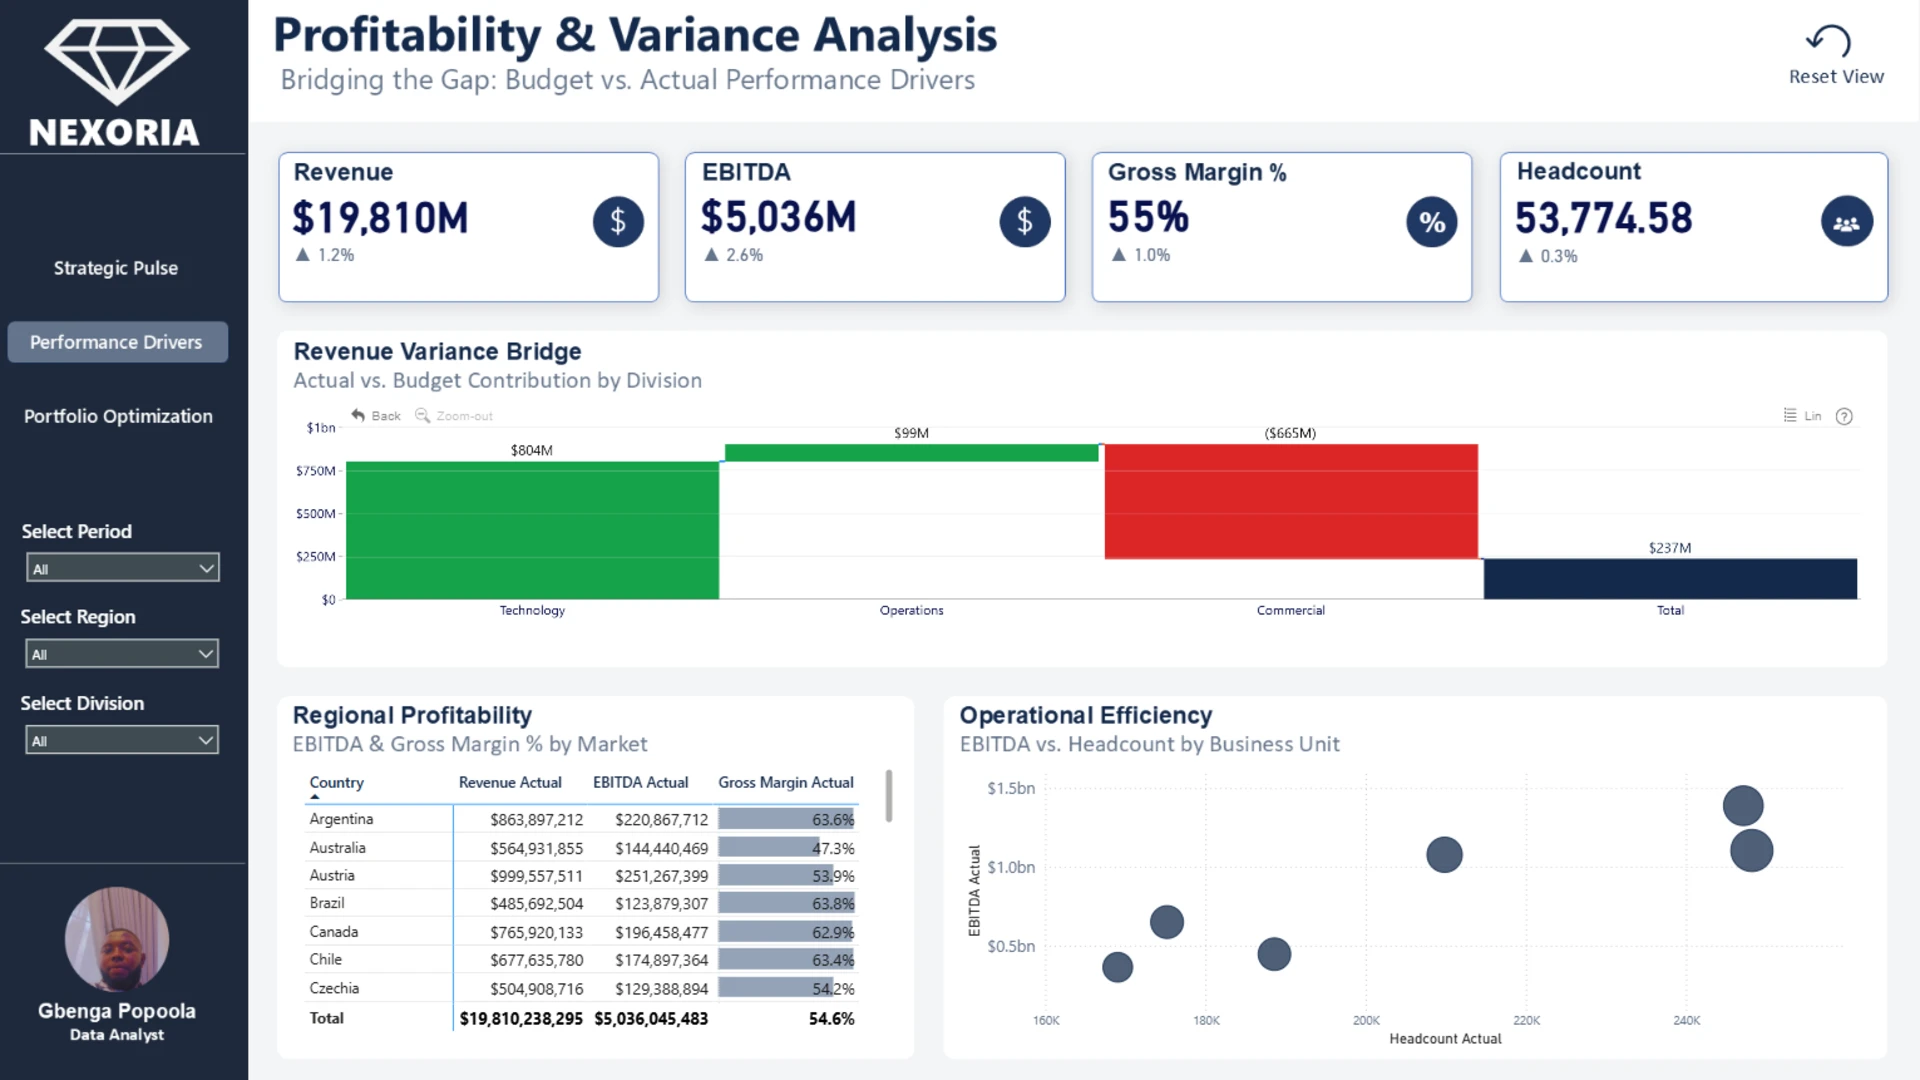
This interactive Power BI report presents an executive KPI dashboard built with ZoomCharts Drill Down custom visuals for Power BI. It highlights key metrics such as Revenue, EBITDA, Margin, Headcount, and Customer Growth, with Actual vs Budget vs Forecast comparisons, organizational drill-down, and regional performance analysis to support strategic decision-making.
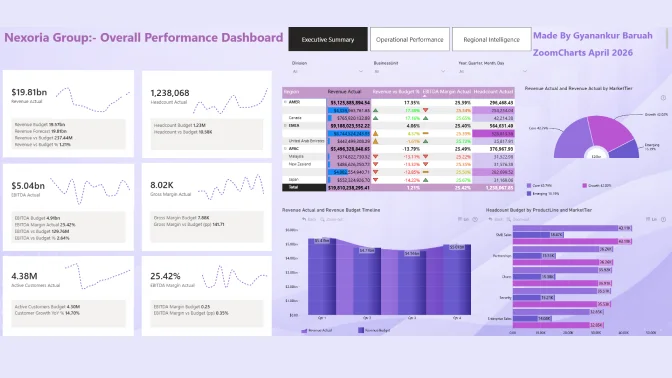
The report was submitted to the ZoomCharts “4U Reports Challenge” (April 2026), using ZoomCharts Drill Down custom visuals for Power BI.
Author's Description:
The Nexoria Global Financial Overview is a 3-page strategic dashboard designed for executive leadership. It moves beyond standard reporting to provide actionable intelligence, featuring a Revenue Variance Bridge for identifying performance drivers, and an AI-driven EBITDA Decomposition Tree for granular portfolio optimization. Built with a heavy emphasis on UX, including a custom reset architecture for seamless navigation.
ZoomCharts visuals used
4U Report Challenges
Participate in data challenges, build and submit reports to get free template downloads.
Join CommunityMobile view allows you to interact with the report. To Download the template please switch to desktop view.
Was this helpful? Thank you for your feedback!
Sorry about that.
How can we improve it?