617
B2B Sales Pipeline Dashboard 3
B2B Sales Pipeline Dashboard 3
Report Author: Nico Rohner
617
Share template with others
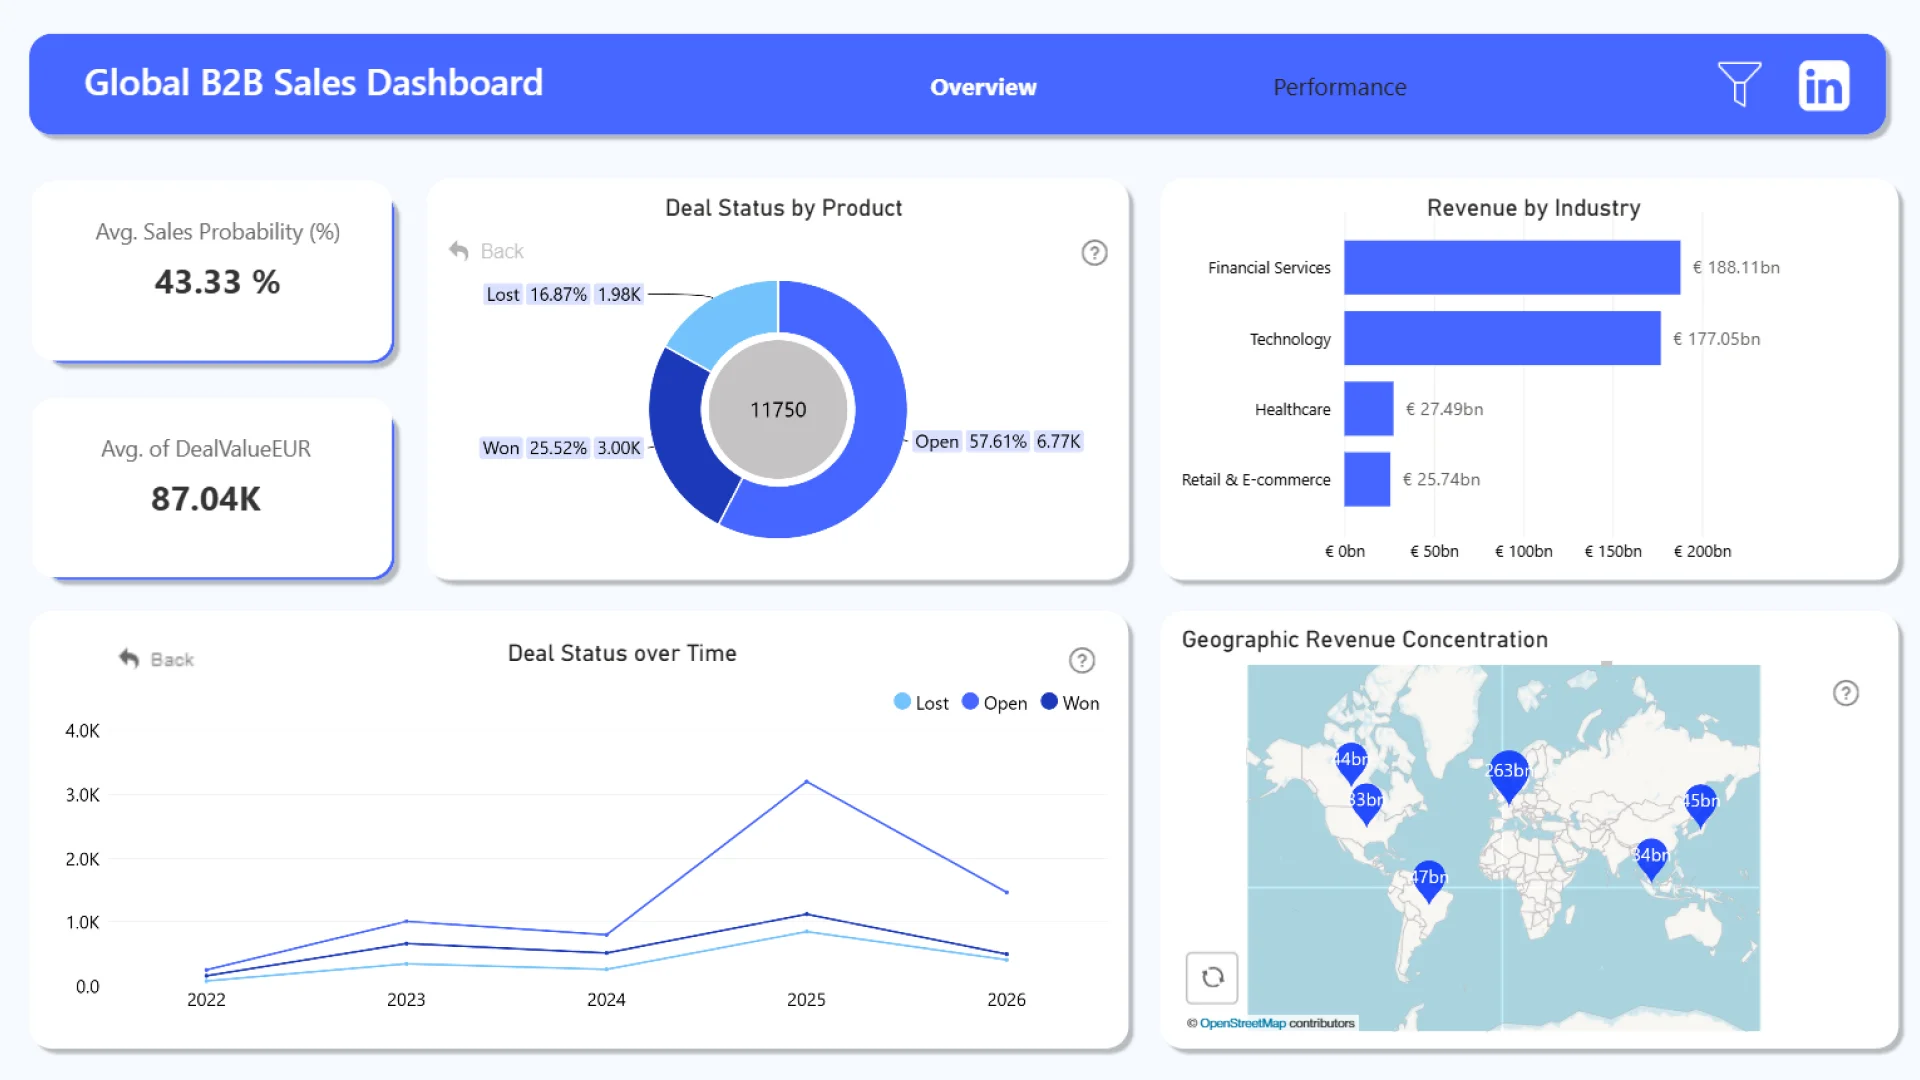
This interactive Power BI report explores the Global B2B Sales Pipeline & Deals Analytics dataset using ZoomCharts Drill Down PRO custom visuals for Power BI. It highlights pipeline value, deal progression, sales activity, and client engagement across regions and industries, helping teams monitor pipeline health and identify stalled or high-risk deals.
The report was submitted to the FP20 Analytics ZoomCharts Data Challenge #35 (February – March 2026).
Author’s Description
In this project, I developed an interactive Global B2B Sales Dashboard in Power BI to analyze and visualize end-to-end sales performance. The dashboard focuses on key KPIs such as revenue by industry, deal status distribution, average deal value, sales probability, activity efficiency, product performance, and geographic revenue distribution. It provides a clear view of sales effectiveness and activity efficiency across industries and regions, helping translate complex data into actionable insights.
This challenge strengthened my skills in data modeling, KPI design, business-focused dashboard structuring, and analytical storytelling while creating clean, executive-ready visualizations. I would like to thank the organizers, including Federico Pastor, ZoomCharts, and Enterprise DNA, for providing this valuable learning opportunity.
ZoomCharts visuals used
4U Report Challenges
Participate in data challenges, build and submit reports to get free template downloads.
Join CommunityMobile view allows you to interact with the report. To Download the template please switch to desktop view.

Was this helpful? Thank you for your feedback!
Sorry about that.
How can we improve it?