1325
Animal Shelter Operations Power BI Report Dashboard
Animal Shelter Operations Power BI Report Dashboard
More Report pages
Report Author: Akindele Omolayo
1325
Share template with others
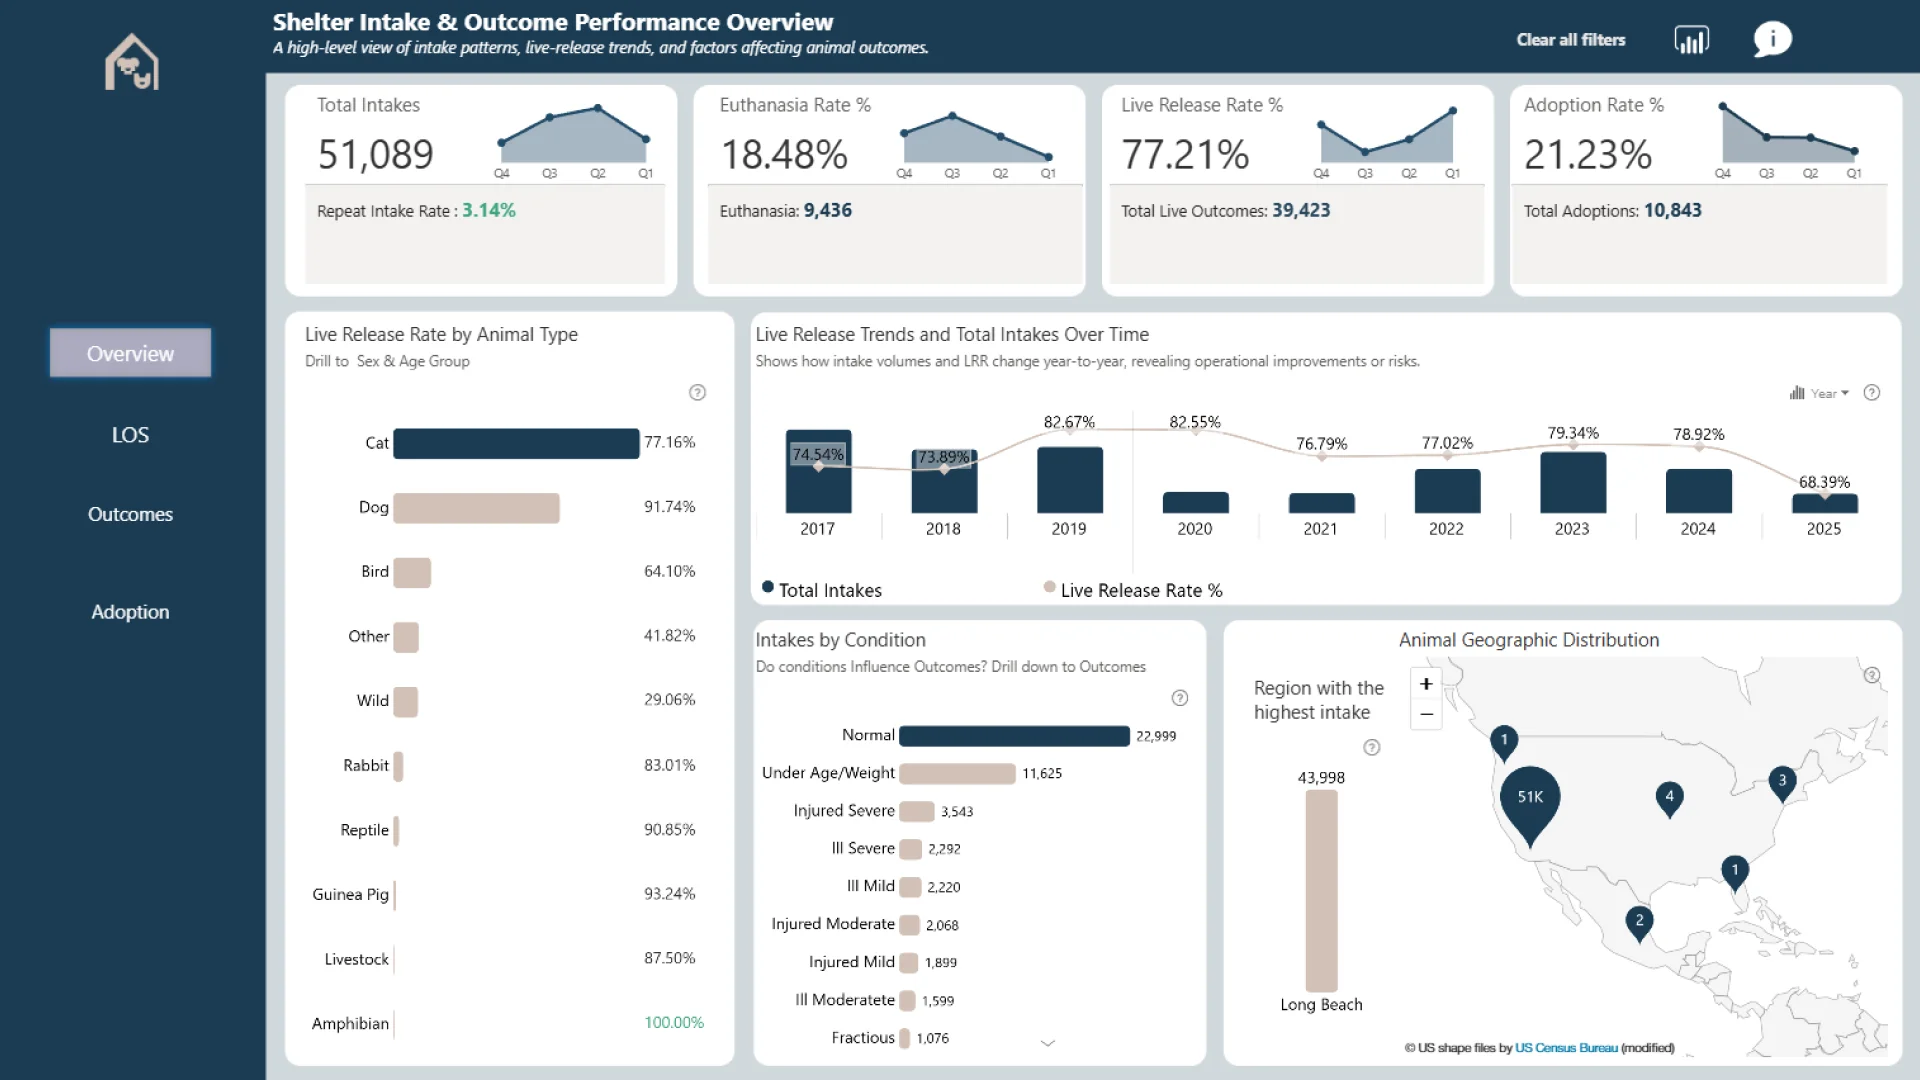
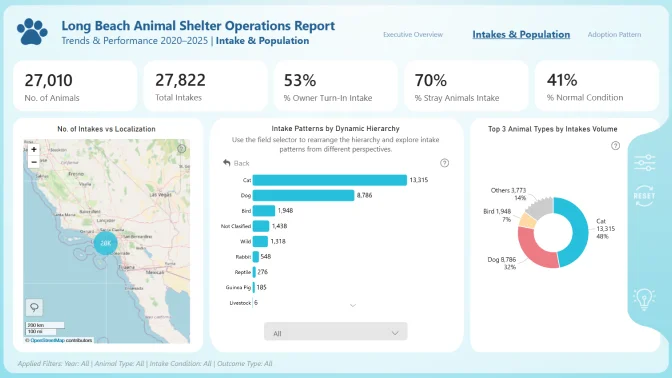
This Power BI report uses the Animal Shelter Operations dataset from the City of Long Beach Animal Care Services, US. The report features ZoomCharts Drill Down PRO custom visuals for Power BI. It was submitted to the Onyx Data DataDNA ZoomCharts Mini Challenge in December 2025.
Author's Description:
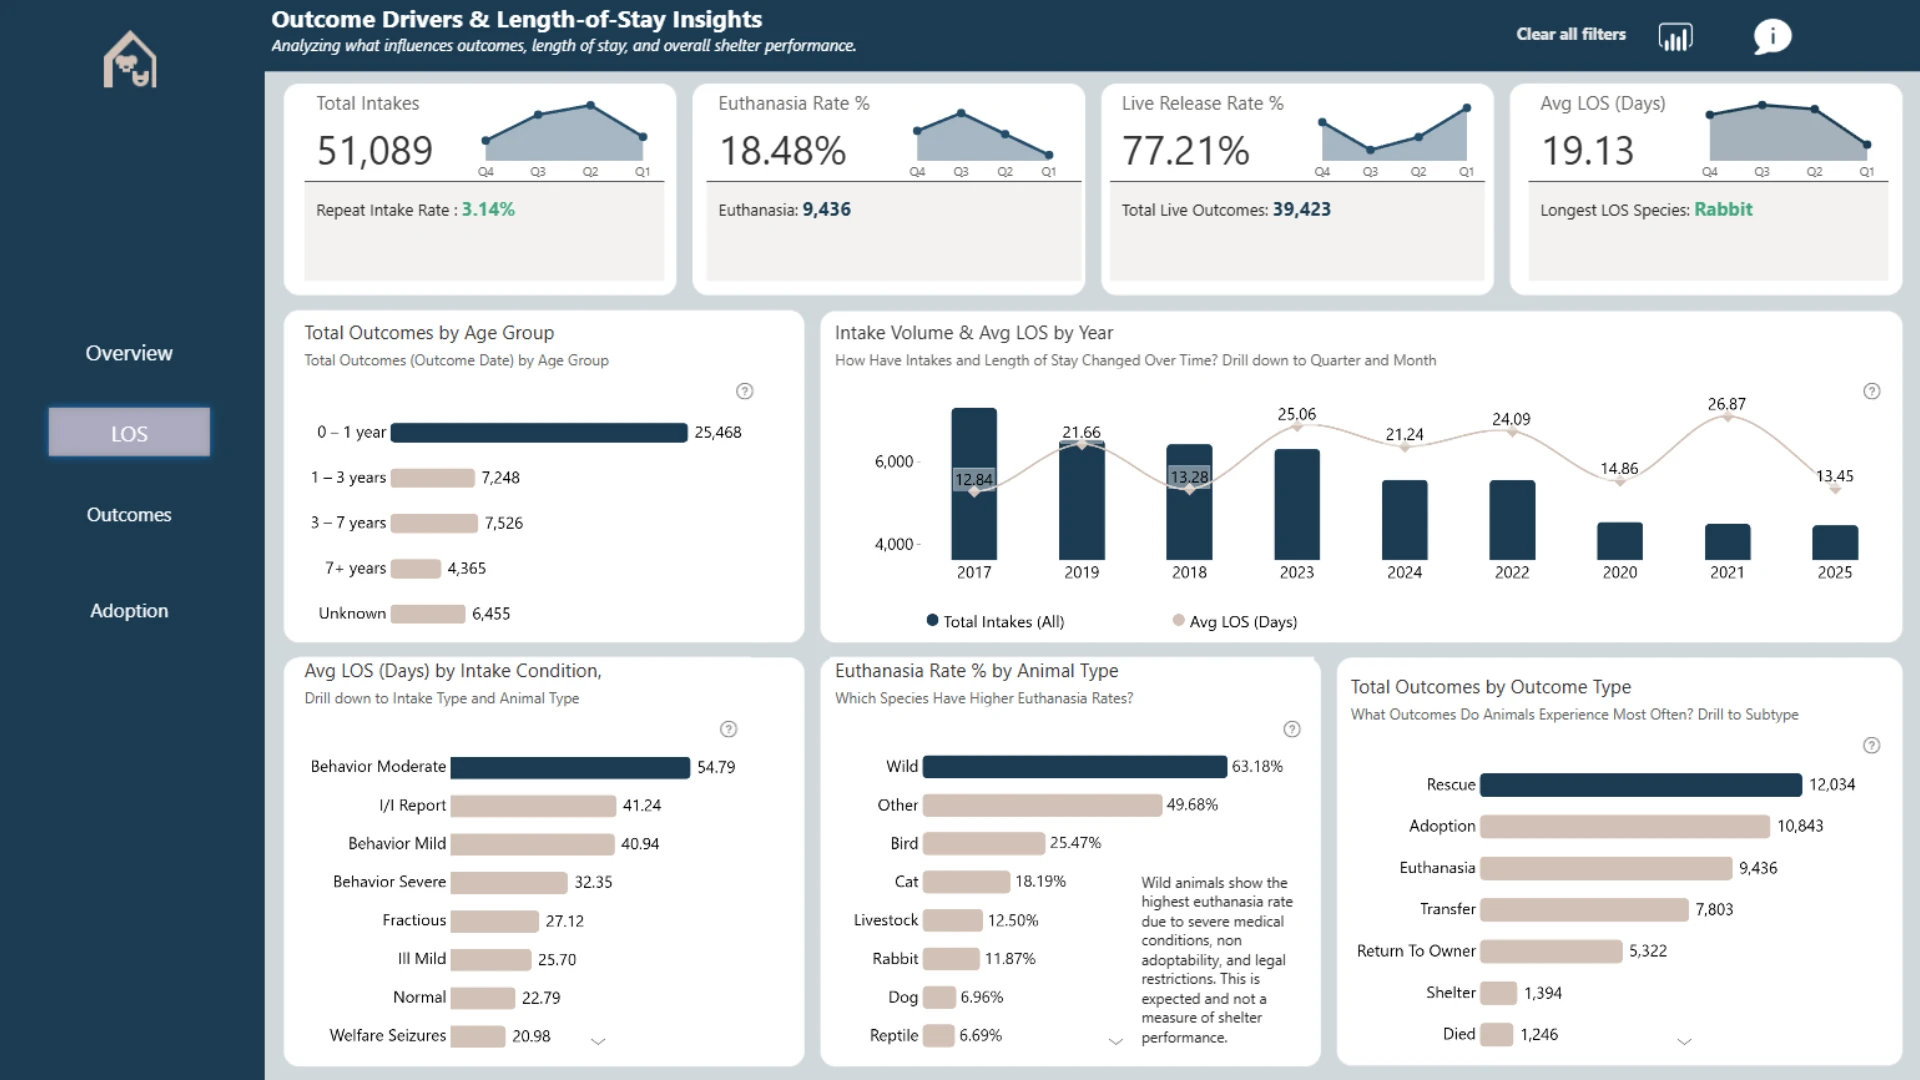
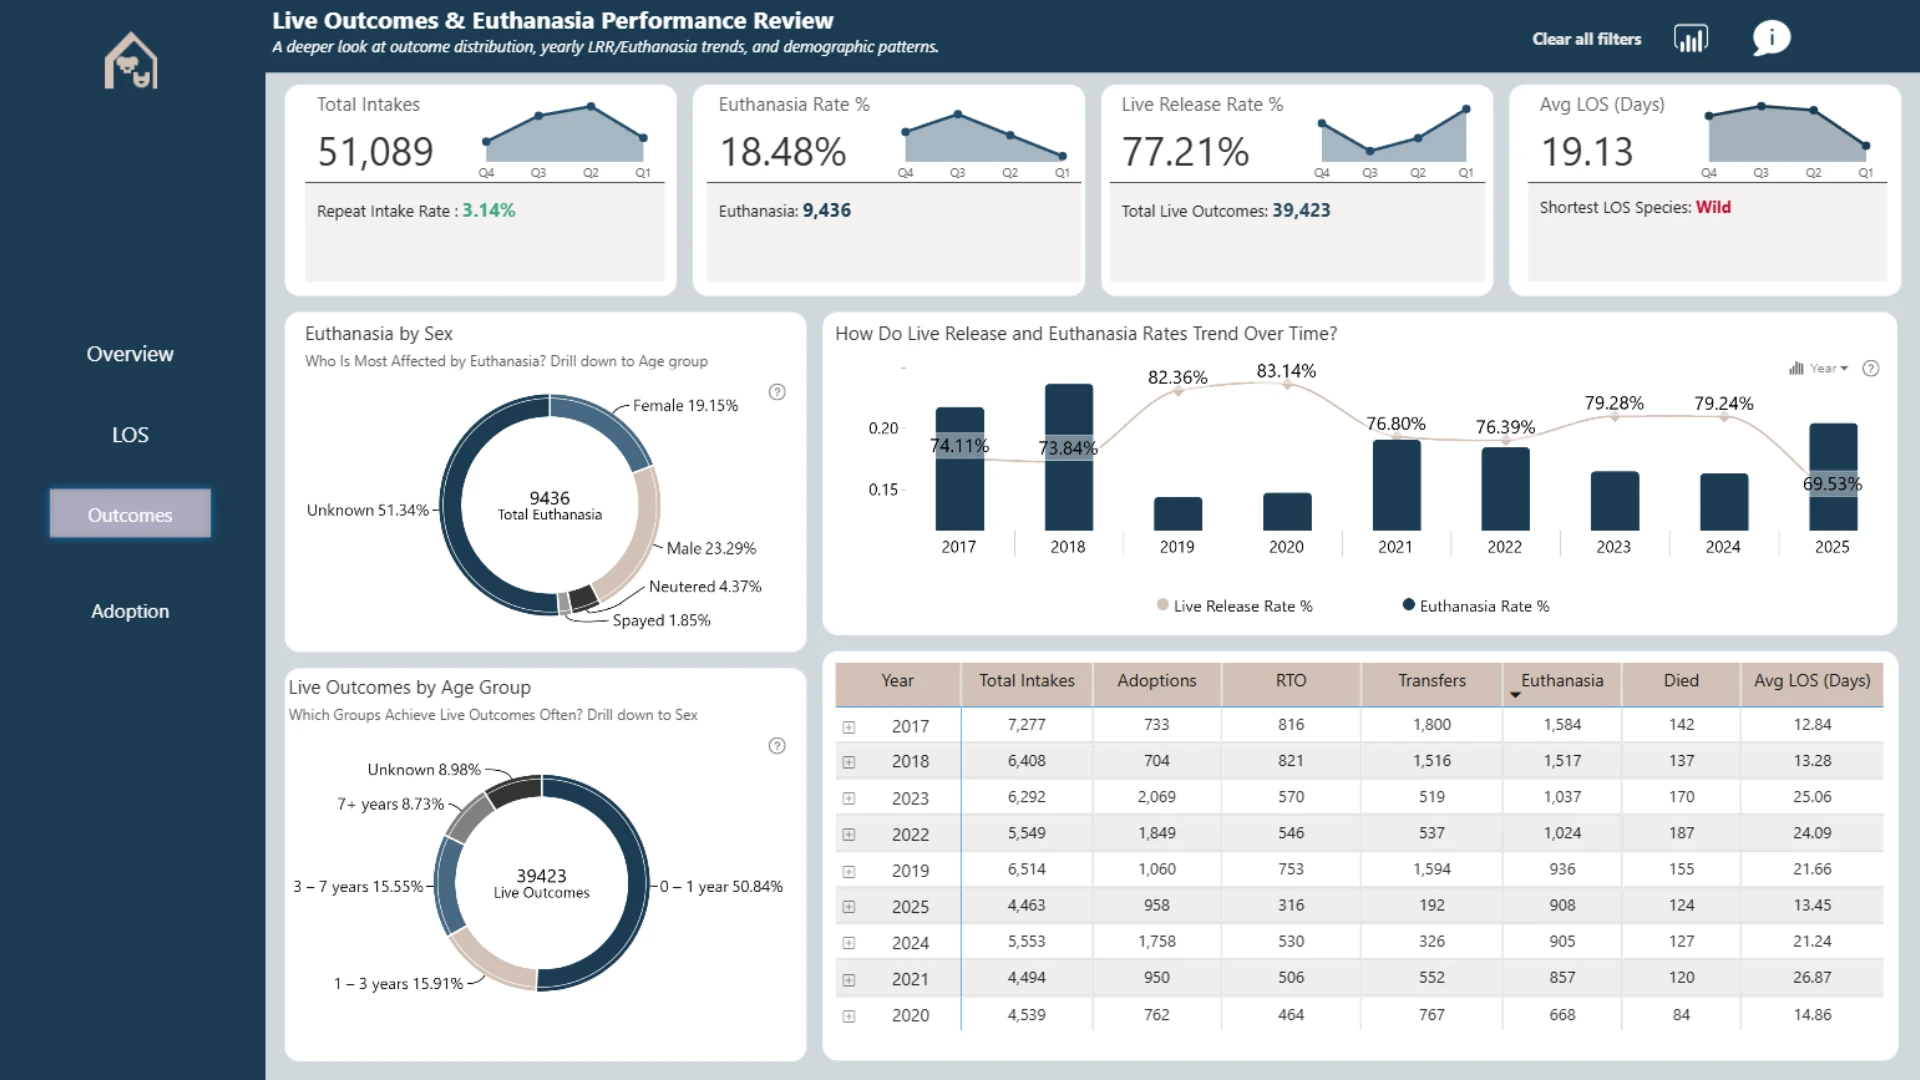
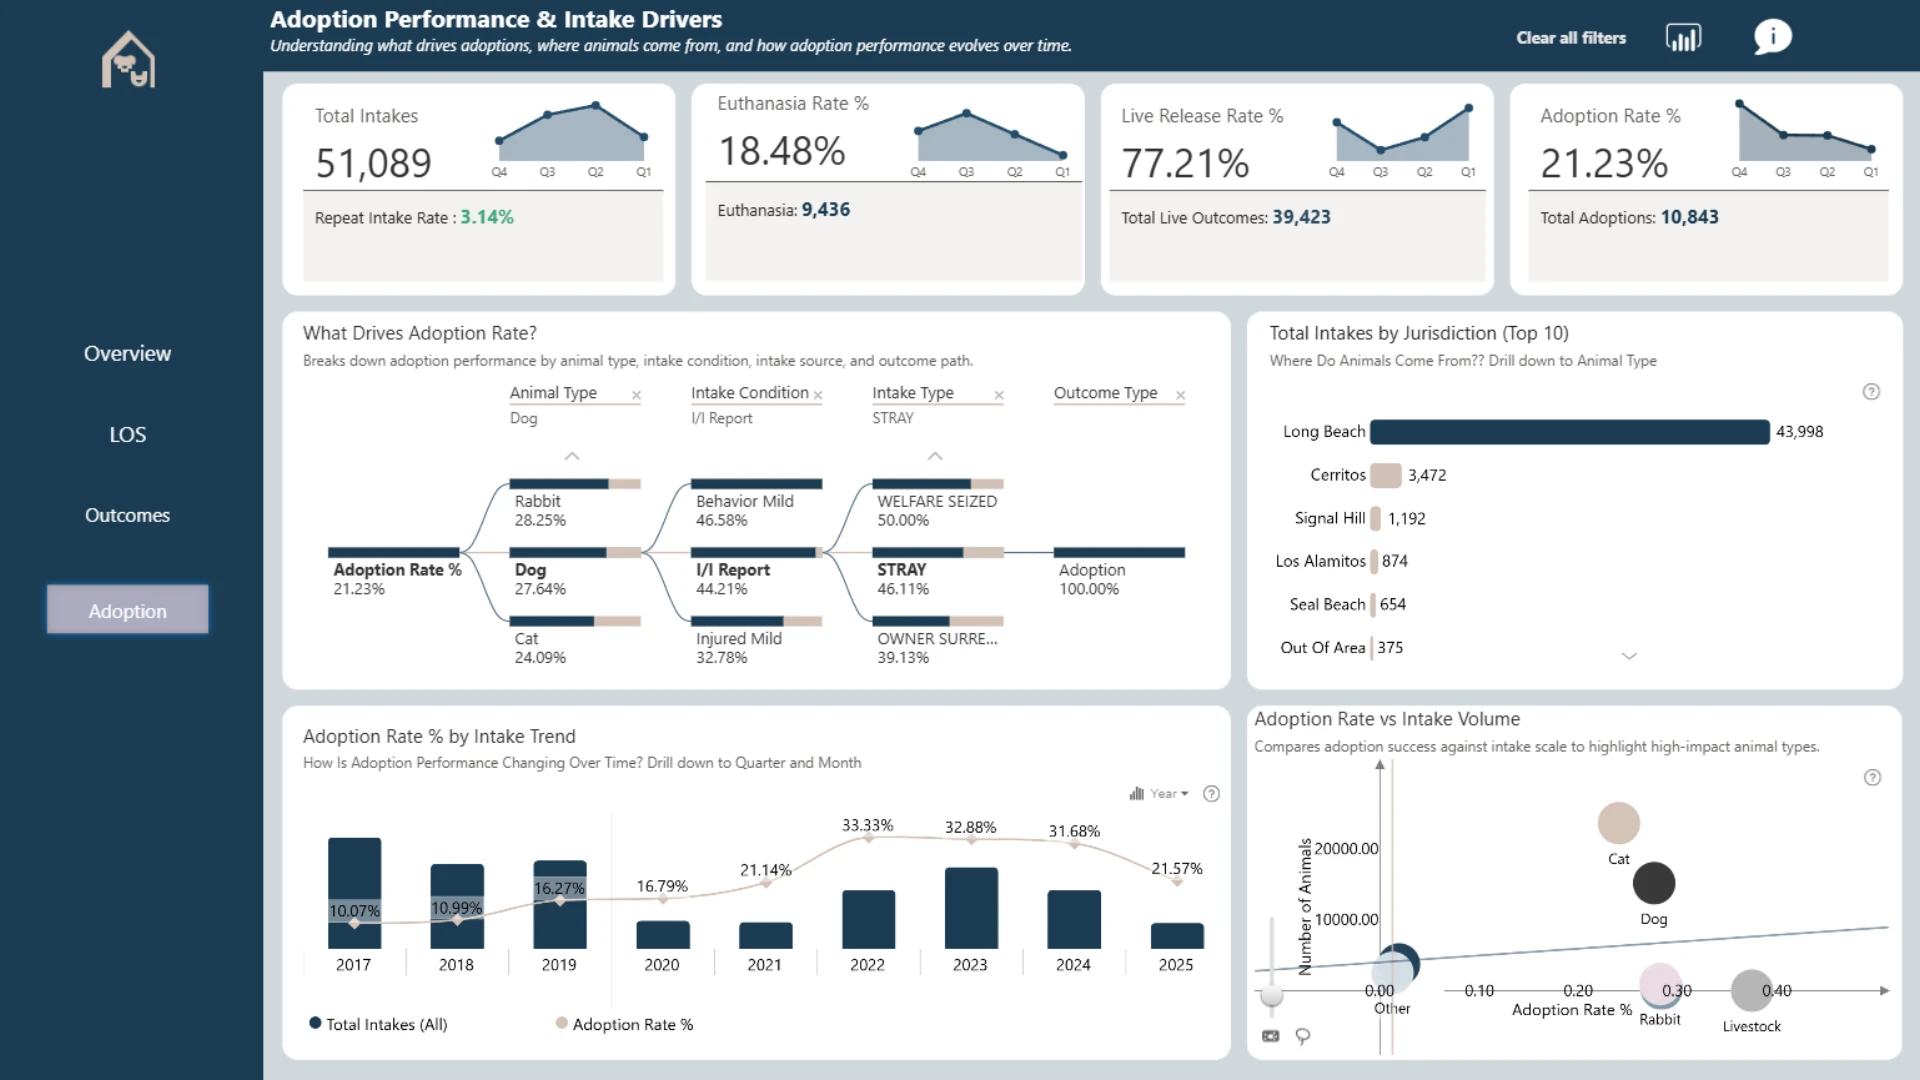
This report provides a comprehensive view of animal shelter operations, focusing on intake patterns, length of stay, and outcome performance. It highlights key metrics such as live release rate, adoption rate, euthanasia rate, repeat intake rate, and average length of stay, and shows how these outcomes vary by animal type, condition, geography, and time. The analysis supports data-driven decisions to improve animal welfare, optimize shelter capacity, and strengthen adoption and live-outcome strategies.
ZoomCharts visuals used
4U Report Challenges
Participate in data challenges, build and submit reports to get free template downloads.
Join CommunityMobile view allows you to interact with the report. To Download the template please switch to desktop view.
Was this helpful? Thank you for your feedback!
Sorry about that.
How can we improve it?