633
Animal Shelter Operations Power BI Report Dashboard 2
Animal Shelter Operations Power BI Report Dashboard 2
More Report pages
Report Author: Adaobi Roseline Ezechukwu
633
Share template with others
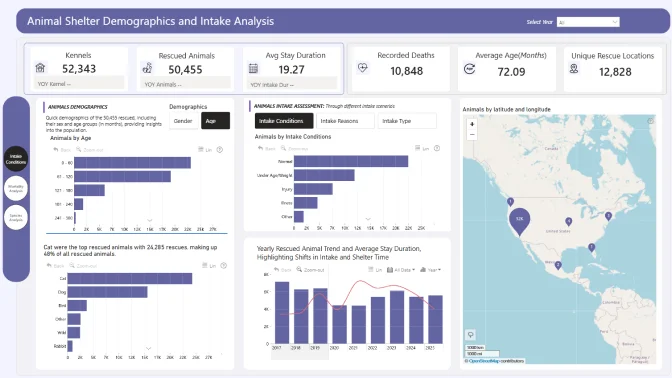
This Power BI report uses the Animal Shelter Operations dataset from a the City of Long Beach Animal Care Services, US. The report features ZoomCharts Drill Down PRO custom visuals for Power BI. It was submitted to the Onyx Data DataDNA ZoomCharts Mini Challenge in December 2025.
Author's Description:
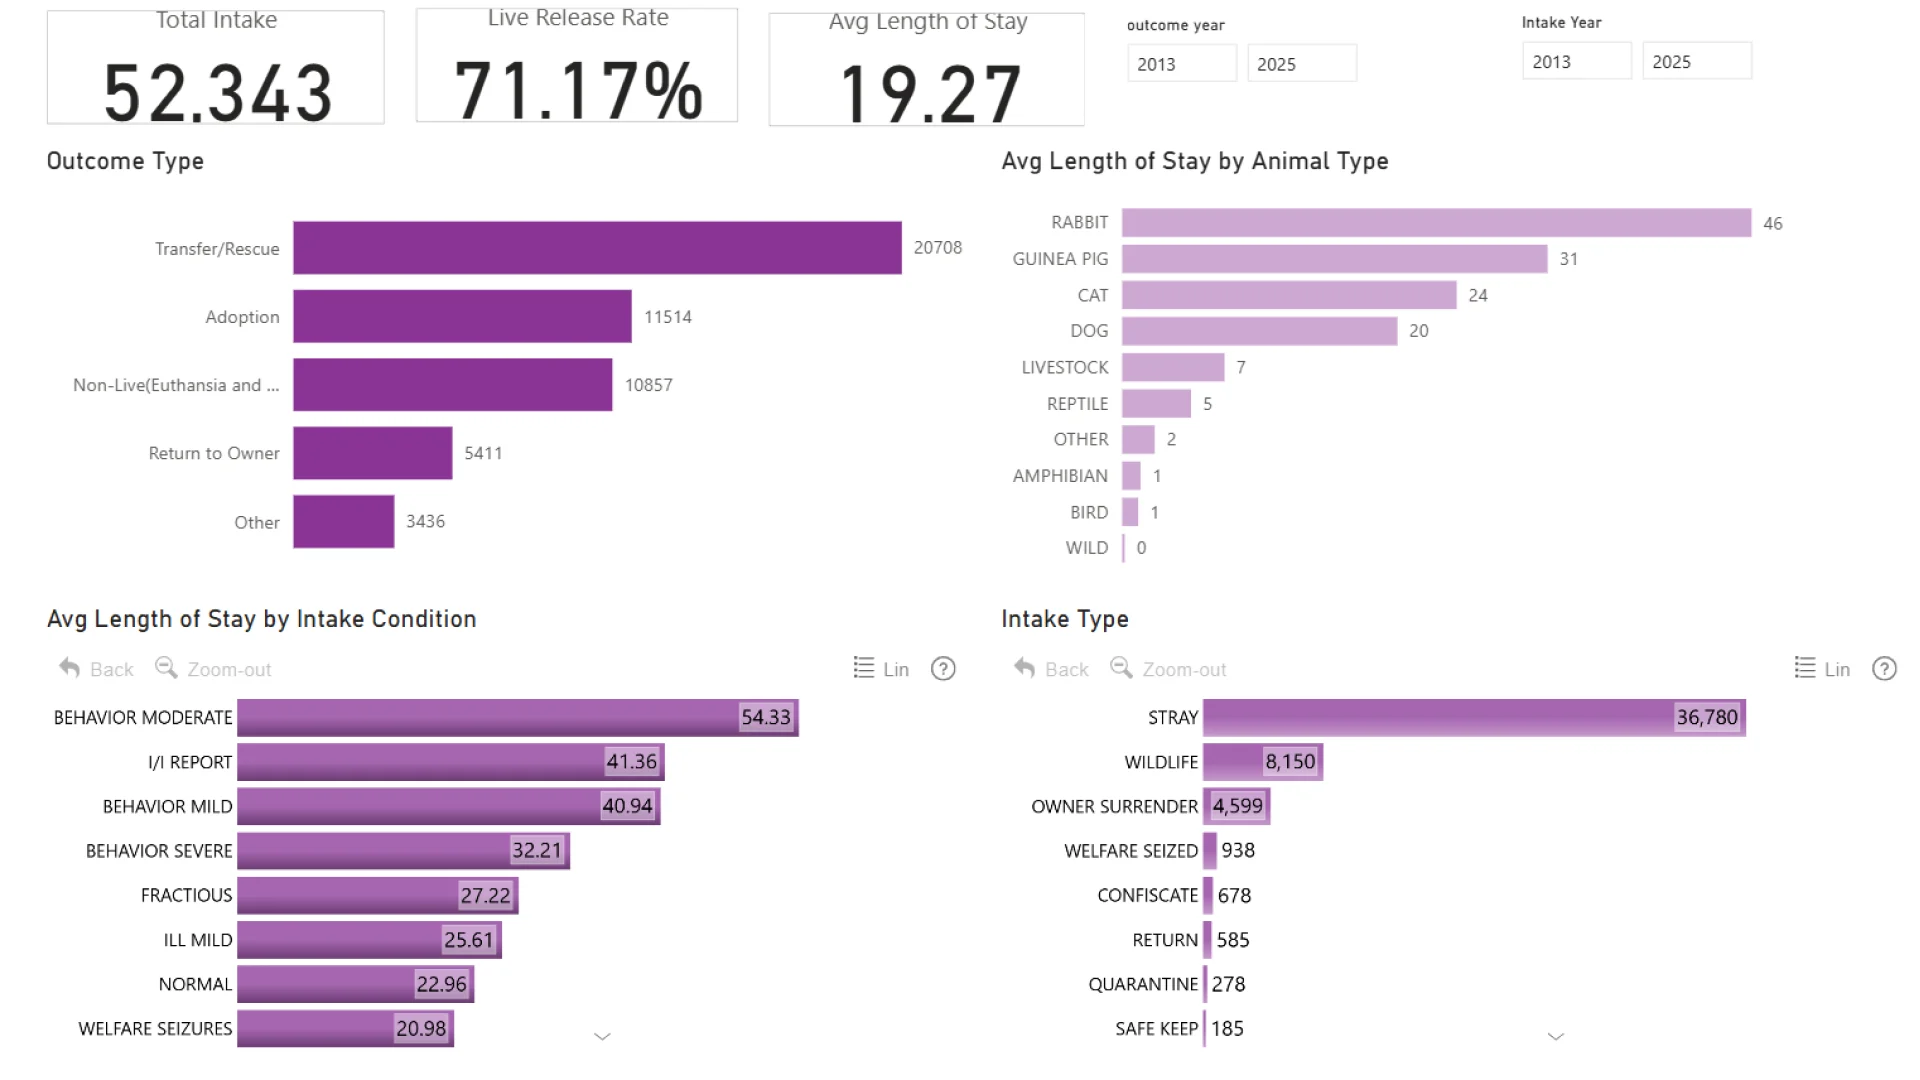
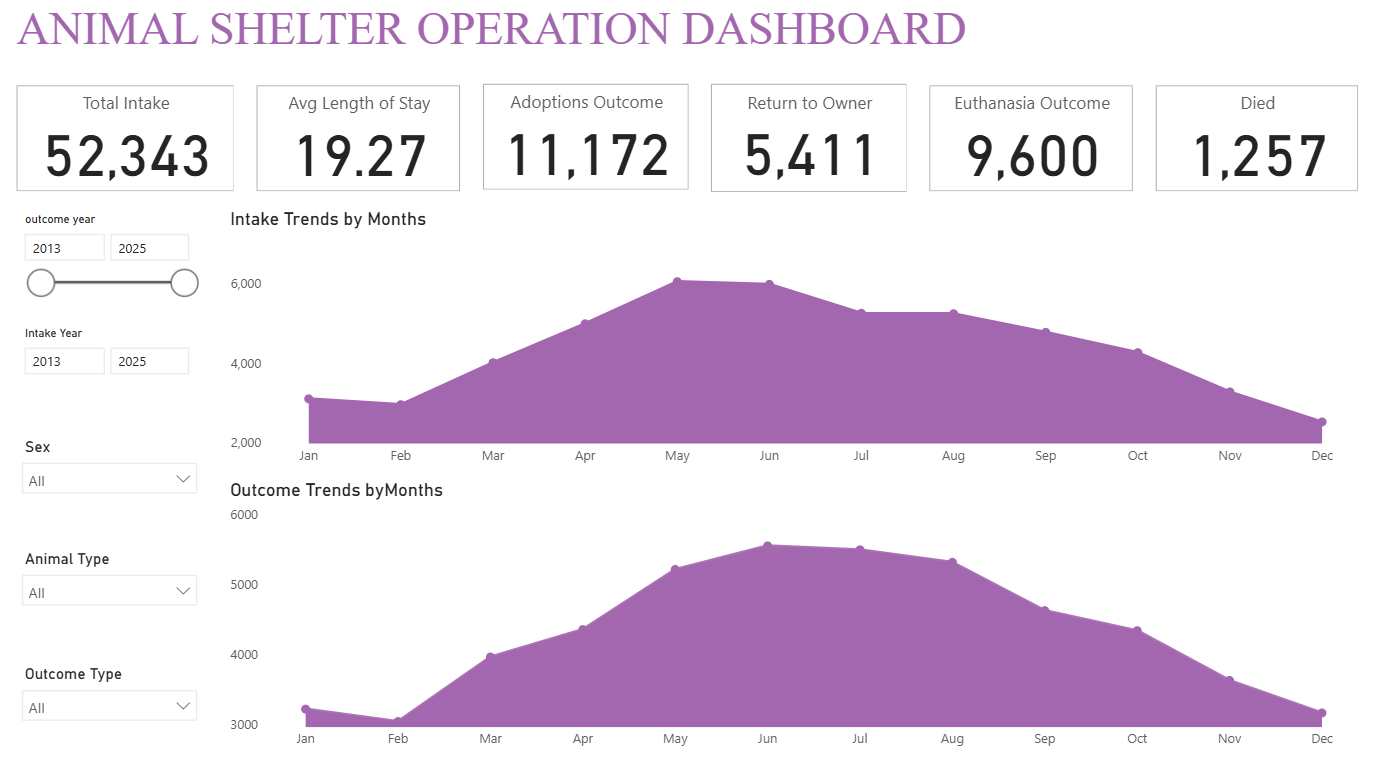
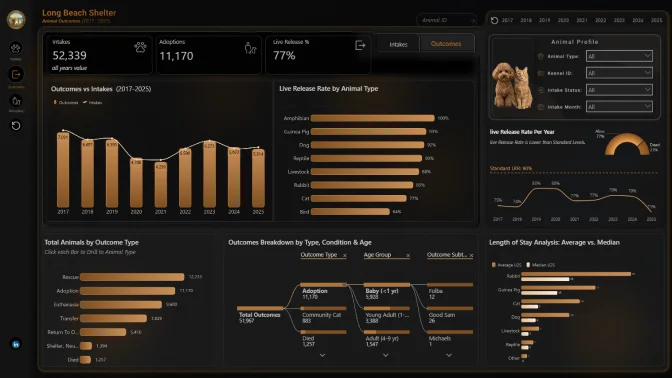
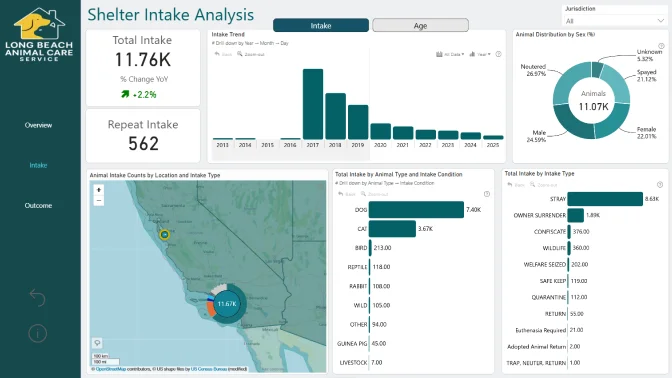
This Power BI report analyzes animal shelter intake and outcome data from 2013–2025 to assess performance, placement success, and capacity pressure. The interactive dashboard highlights key metrics such as total intake, live release rate, and average length of stay, while exploring trends by animal type, intake condition, and time period. The insights reveal seasonal patterns, long-stay animal profiles, and key outcome drivers to support data-driven decisions that improve resource allocation and animal welfare.
ZoomCharts visuals used
4U Report Challenges
Participate in data challenges, build and submit reports to get free template downloads.
Join CommunityMobile view allows you to interact with the report. To Download the template please switch to desktop view.
Was this helpful? Thank you for your feedback!
Sorry about that.
How can we improve it?