164
AI Agent Customer Service Quality & SLA Dashboard
AI Agent Customer Service Quality & SLA Dashboard
More Report pages
Report Author: diana wambugha
164
Share template with others
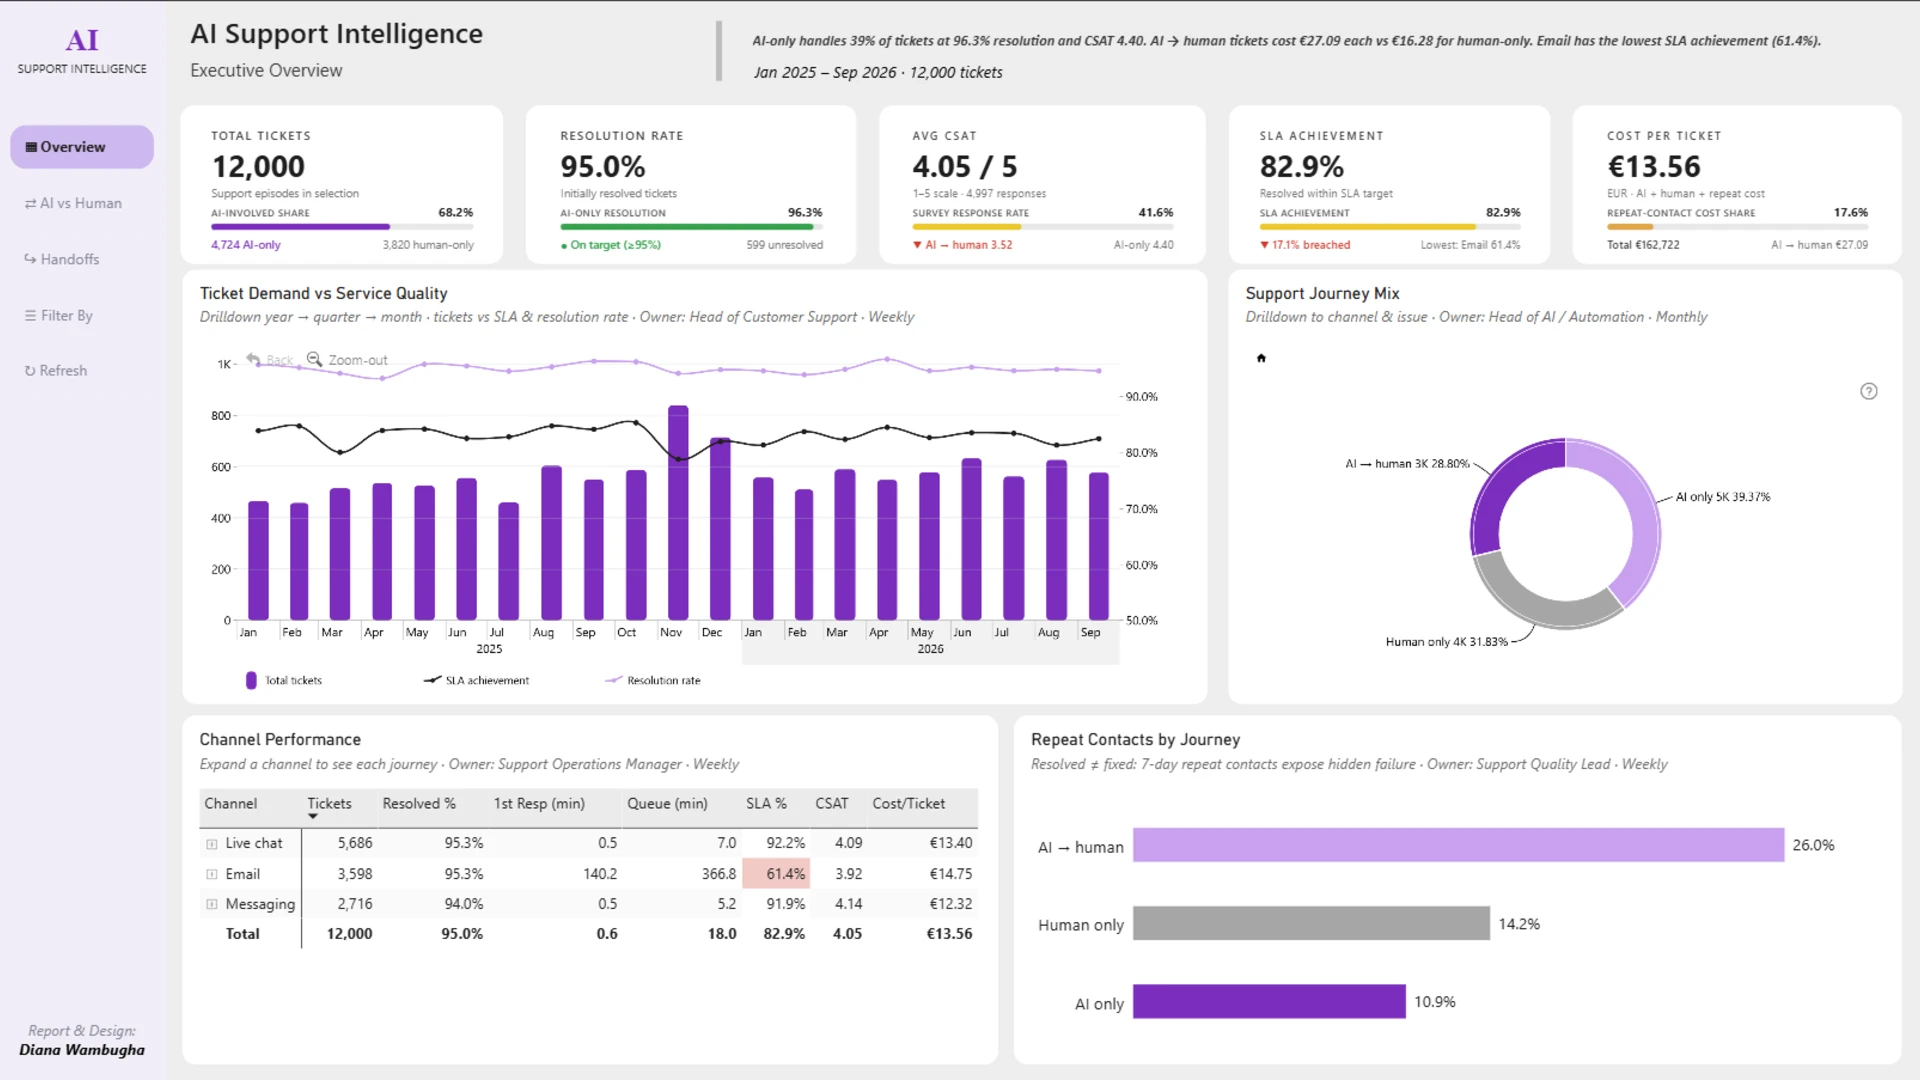
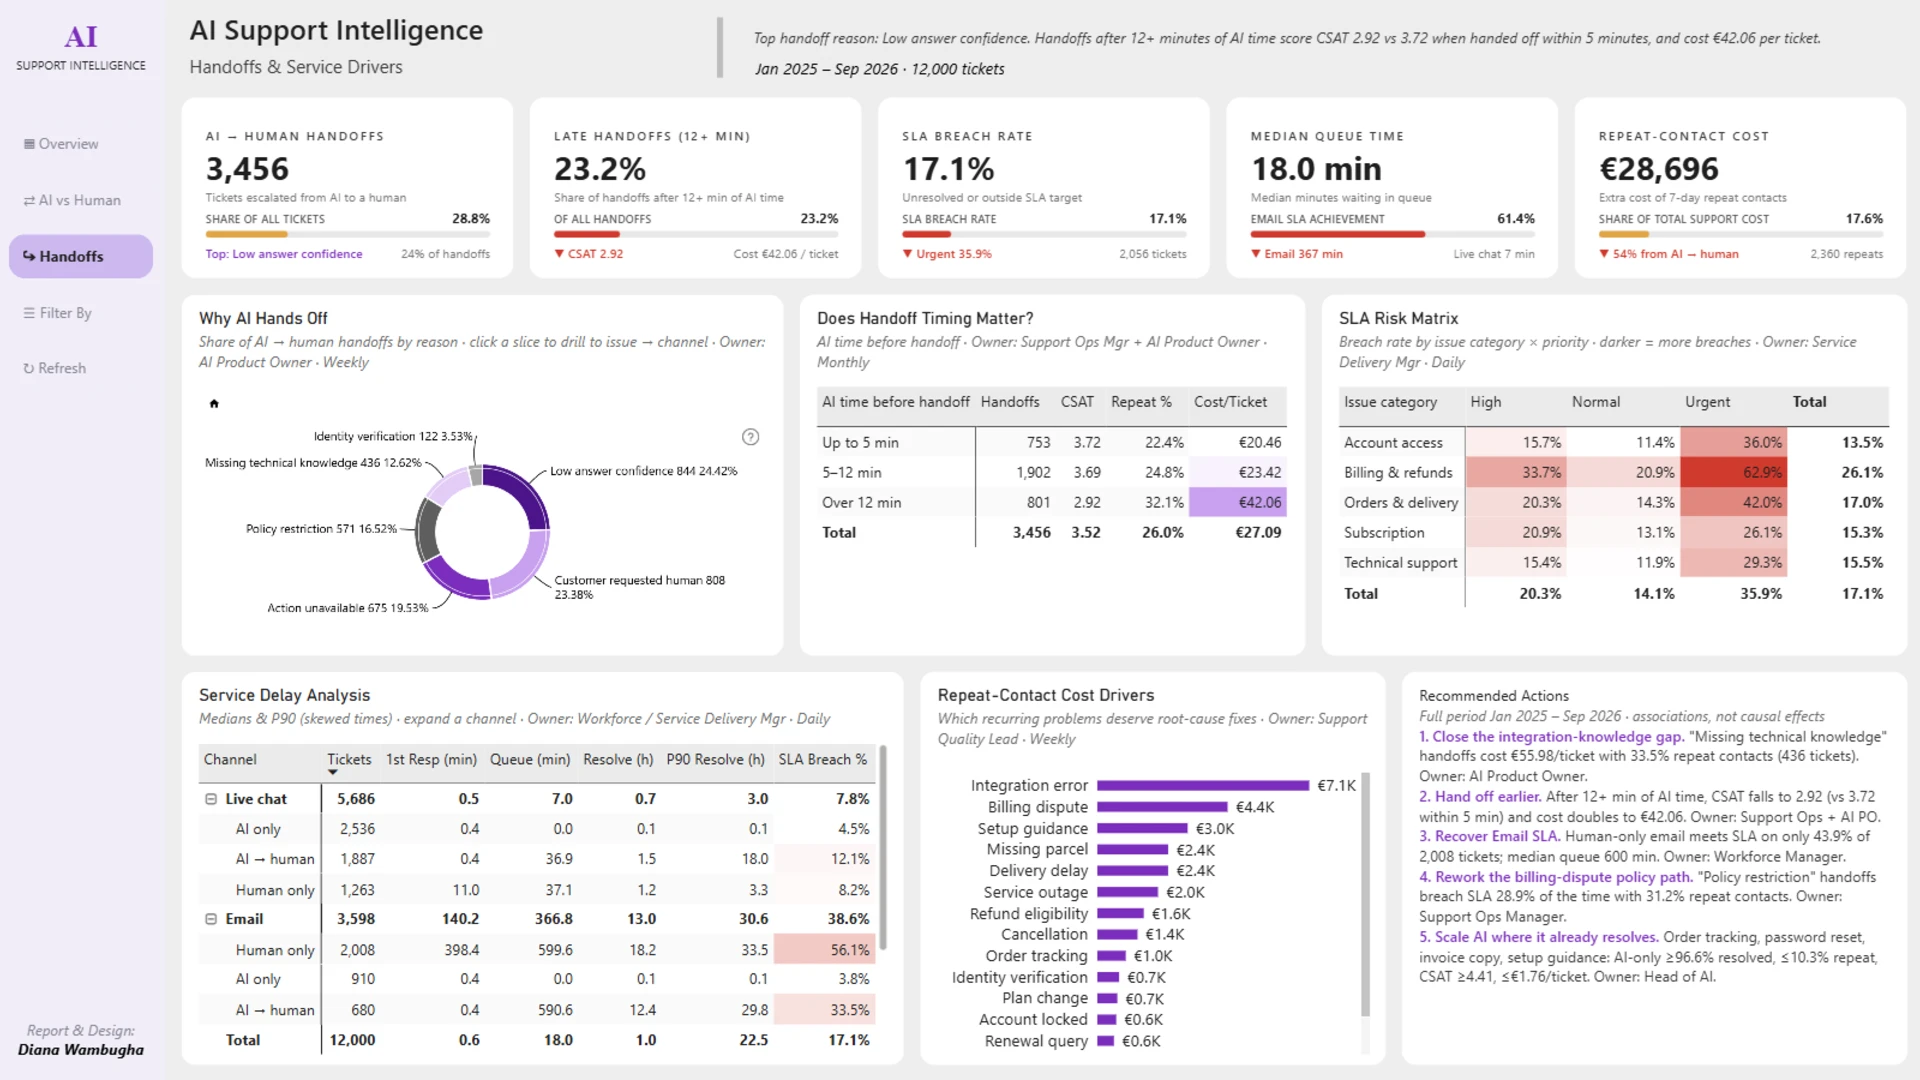
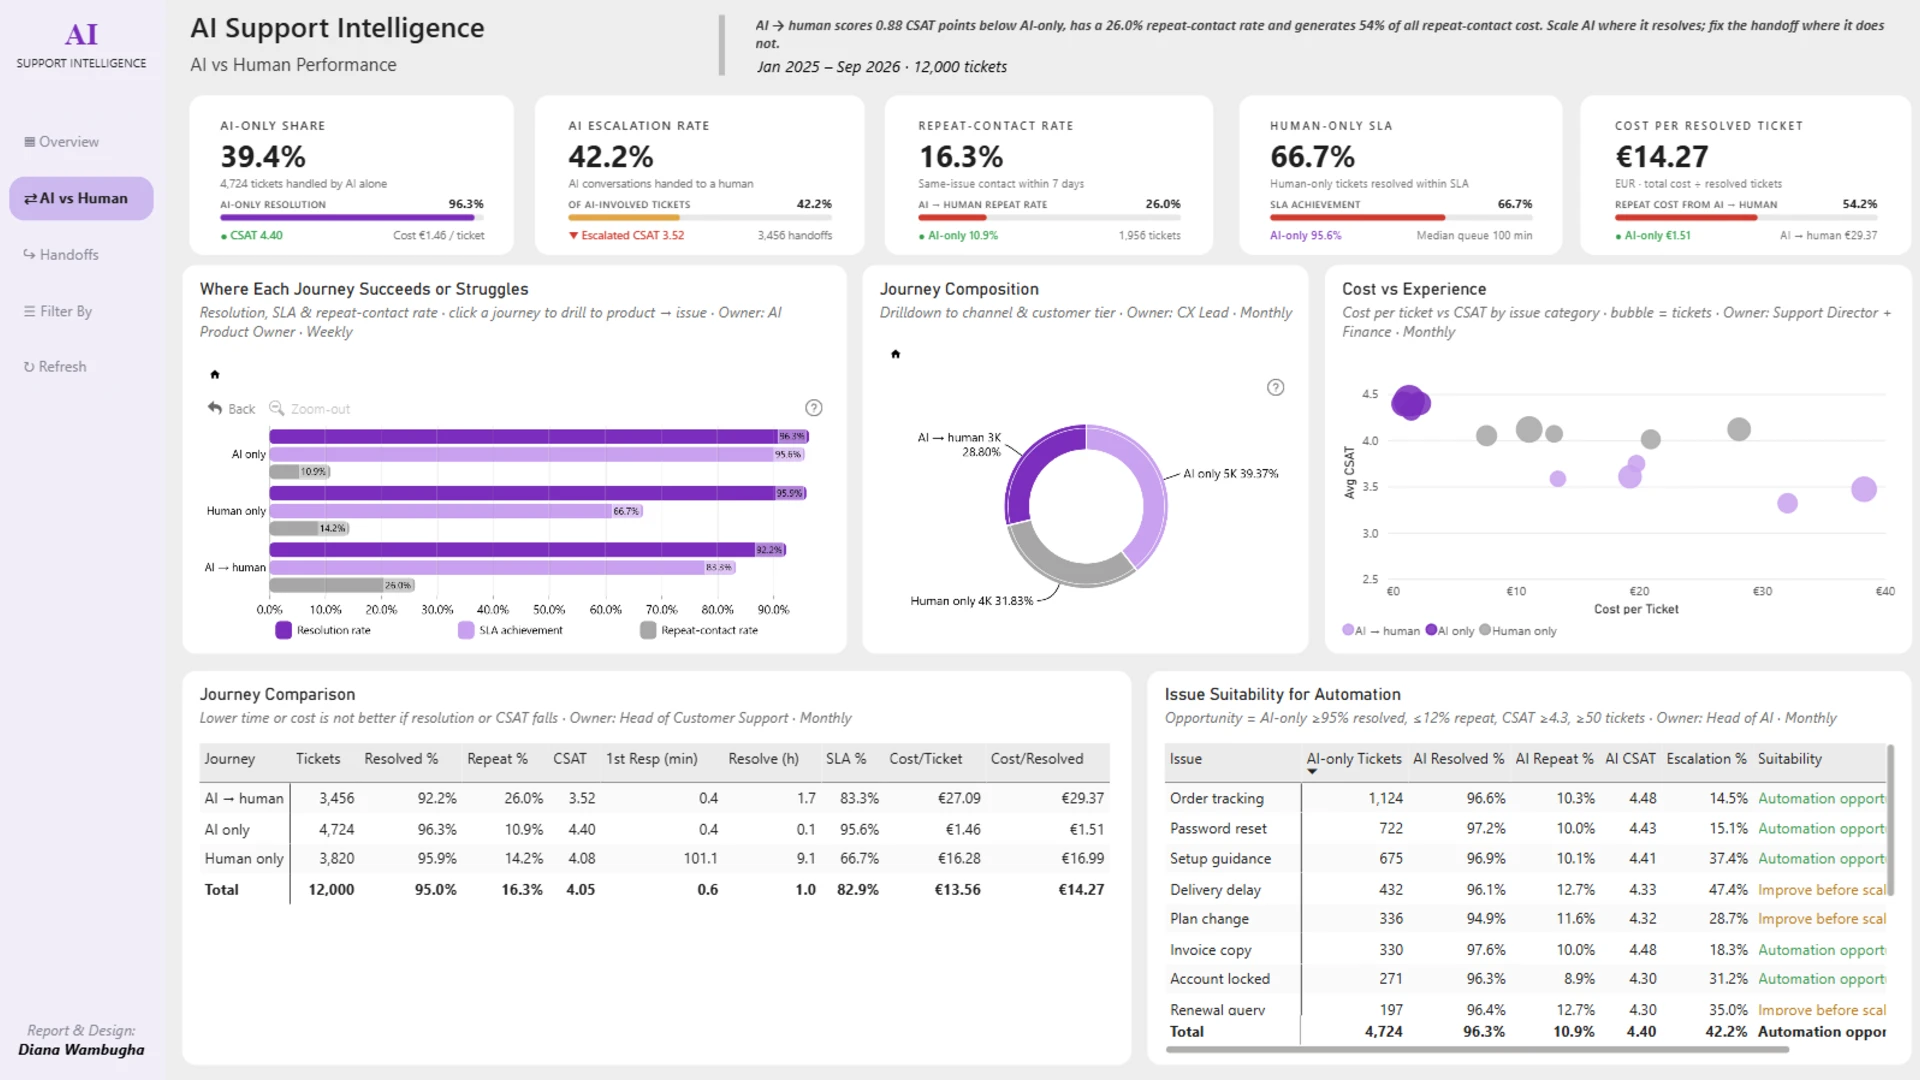
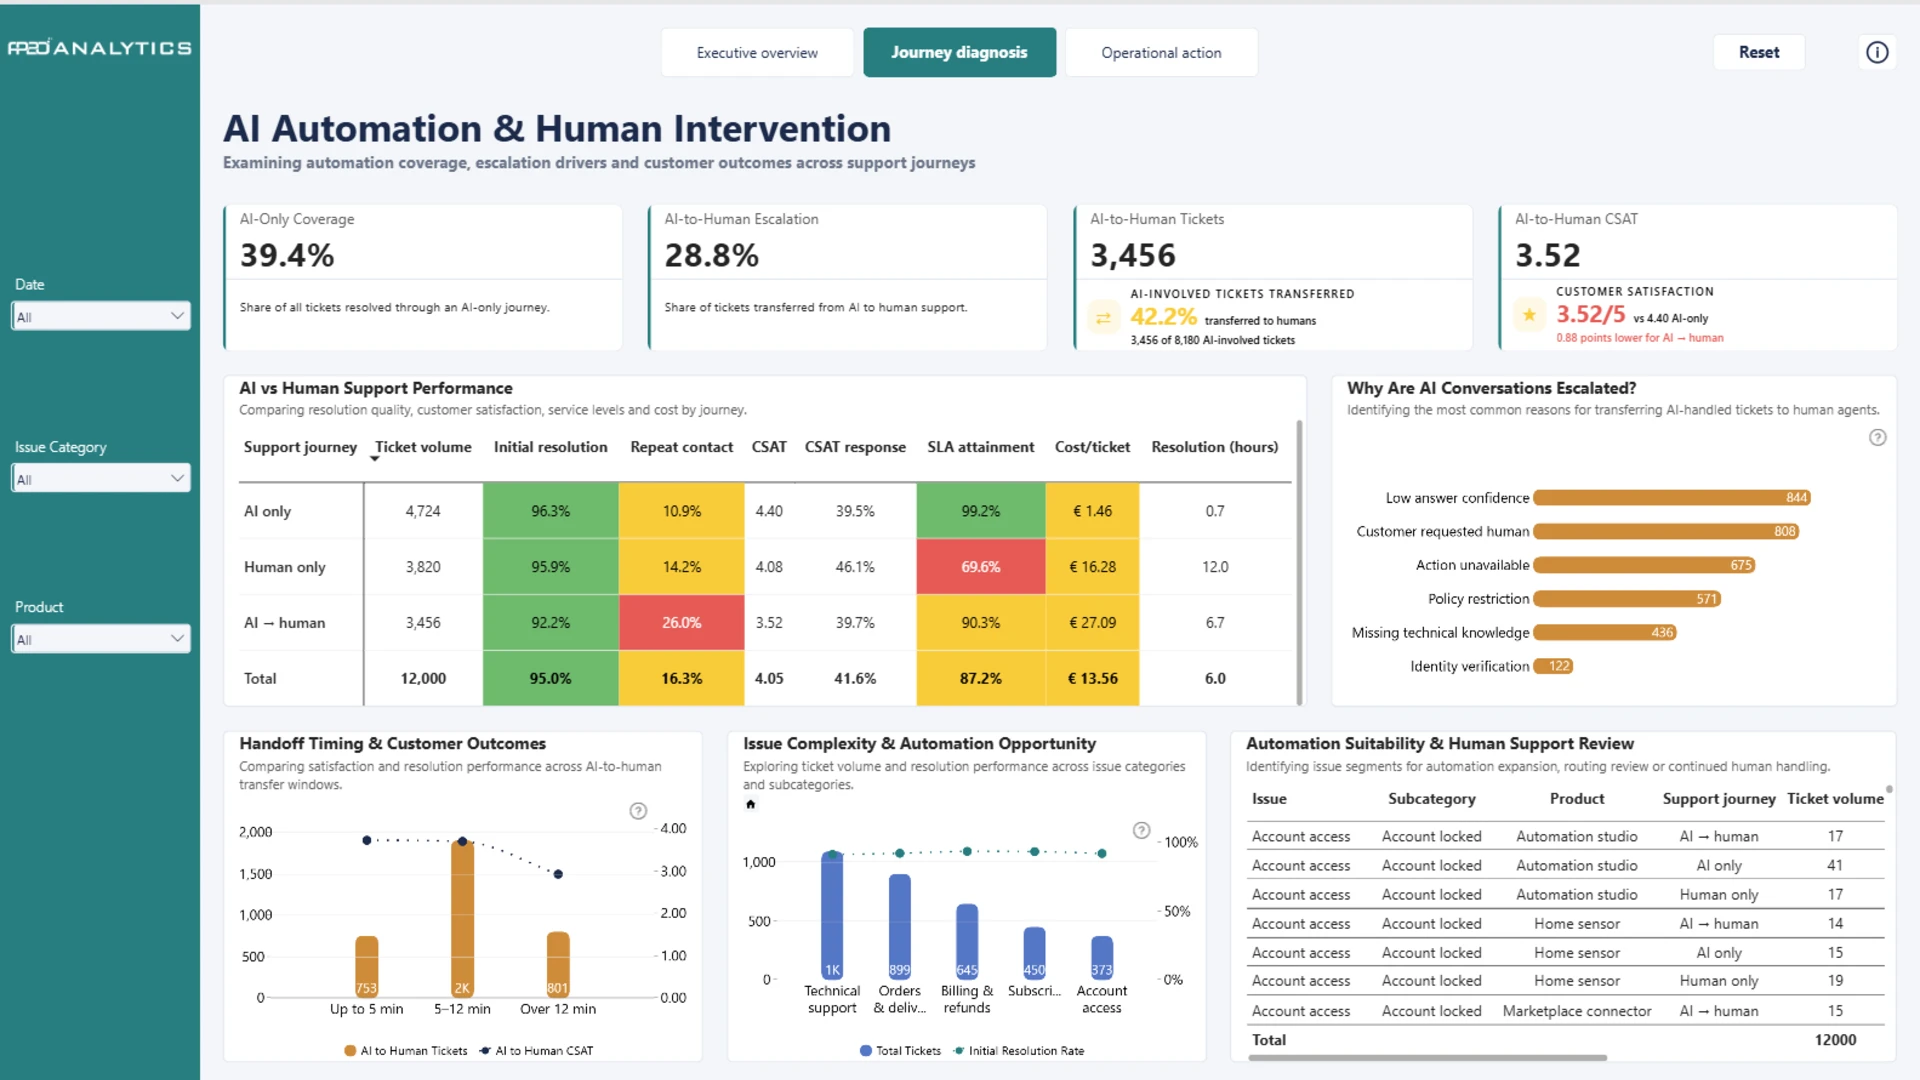
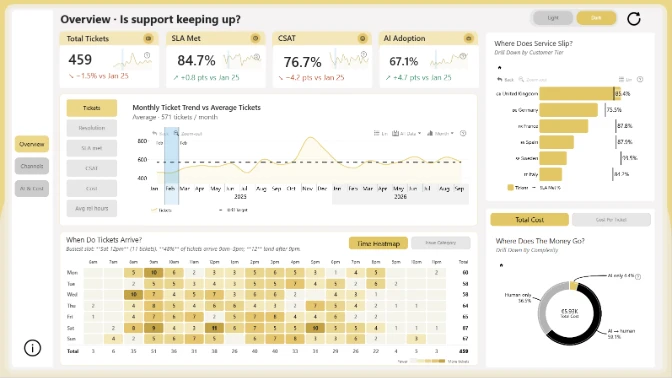
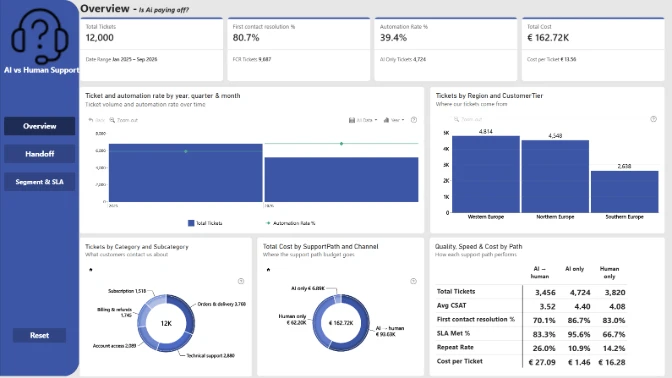
Explore this interactive Power BI customer service quality and SLA performance dashboard to analyze 12,000 support tickets, resolution rates, and customer experience. Monitor SLA compliance, customer satisfaction (CSAT), response times, queue delays, and cost per ticket. Compare AI-only, AI-to-human, and human-only support journeys, investigate repeat contacts, and track monthly ticket demand and service quality trends. Use interactive ZoomCharts visuals to identify underperforming support channels, improve resolution efficiency, and optimize customer service operations.
This Power BI report was created for the FP20 Analytics & ZoomCharts Challenge 42, focused on AI Agent & Customer Support Analytics.


4U Report Challenges
Participate in data challenges, build and submit reports to get free template downloads.
Join CommunityMobile view allows you to interact with the report. To Download the template please switch to desktop view.
How to use a PBIX template
Preview the interactive report, download the PBIX file, open it in Power BI Desktop, and replace the same data connection with your own dataset.
Preview and download
Explore the report online and download the PBIX template file.
Open in Power BI Desktop
Open the downloaded PBIX file in Power BI Desktop.
Connect your data
Replace the sample data source with your own dataset.
Refresh and adjust
Refresh the model and update fields or visual were needed.
Save and share
Save your report and publish it for your audience.


