Feel free to leave your vote:
1
Share template with others
Summary
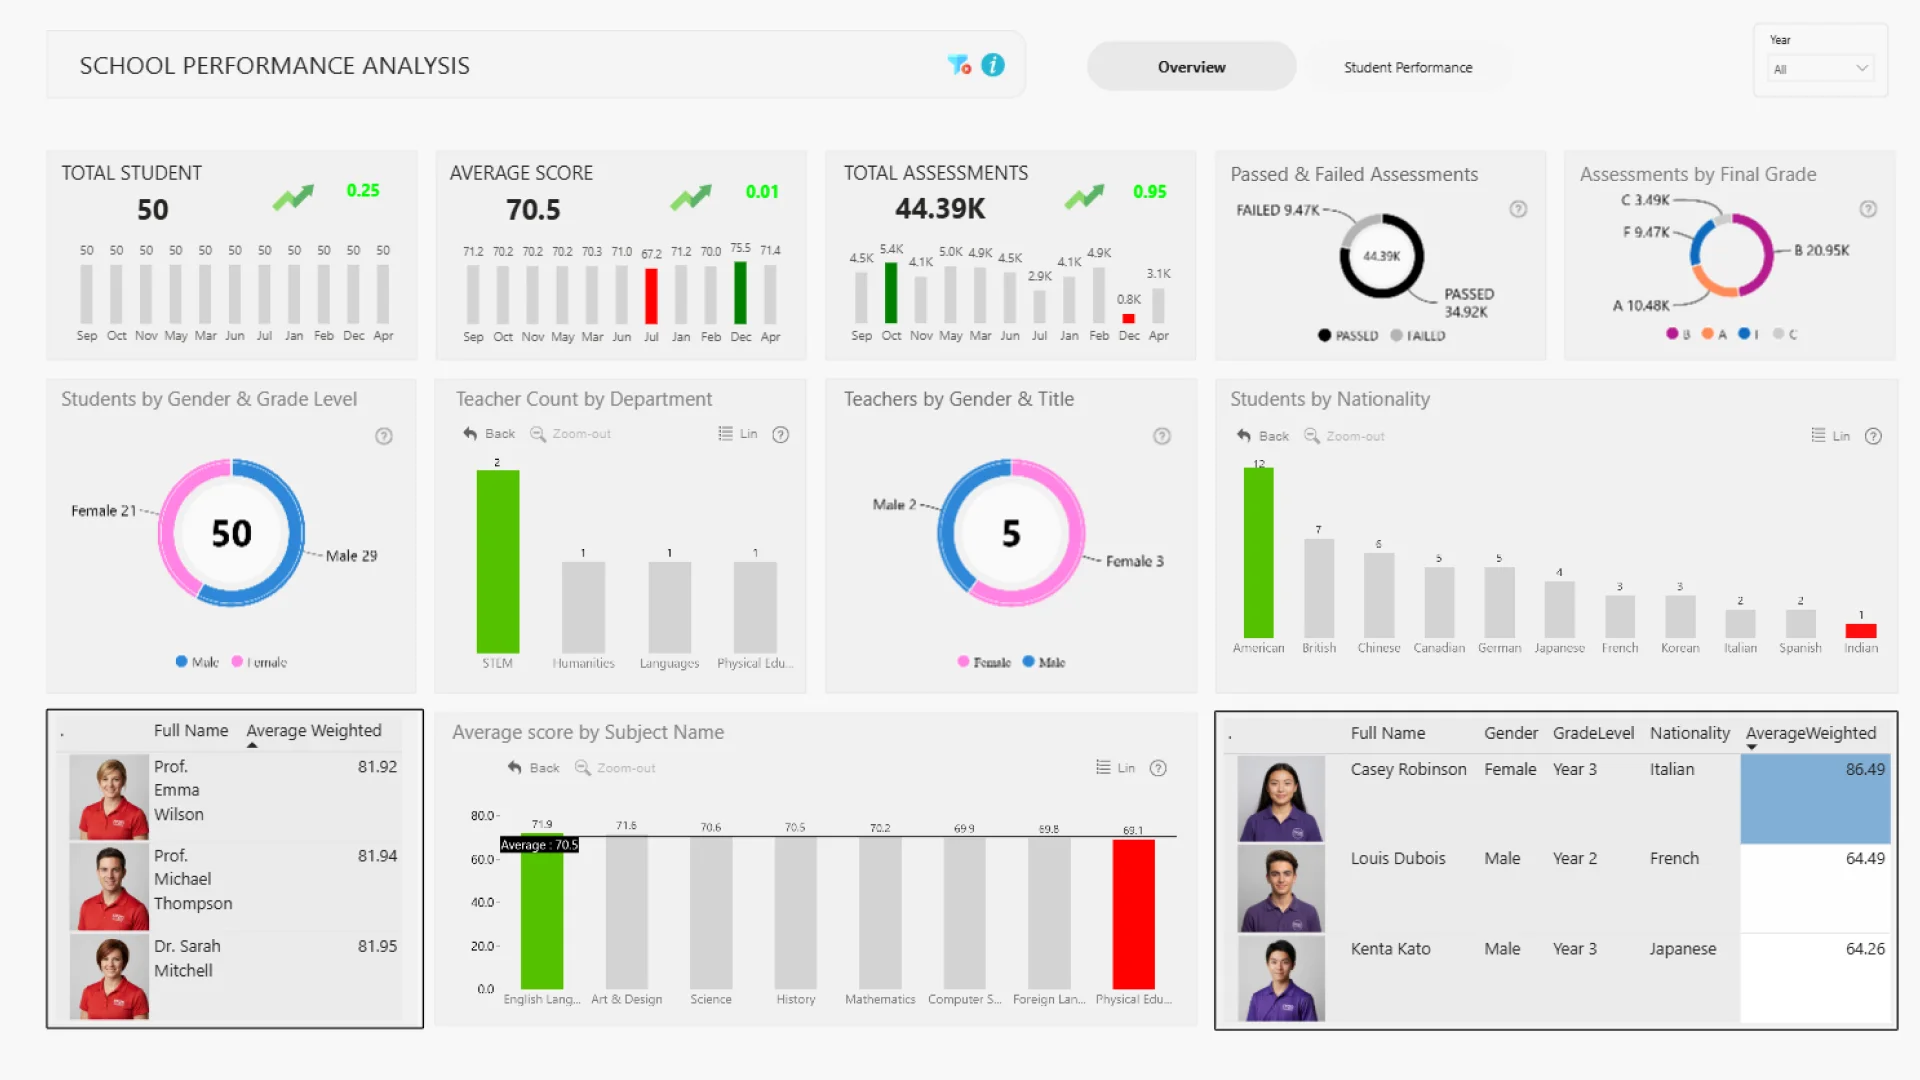
This Power BI report uses the Education/Student Performance dataset and features ZoomCharts Drill Down PRO custom visuals for Power BI. It was submitted to the FP20 Analytics ZoomCharts Data Challenge 31 in October 2025.
Author Description:
My report, titled School Performance Analysis, consists of two interactive pages: an Overview page summarizing key academic indicators and a Student Performance page providing detailed insights at the individual level. By integrating ZoomCharts Drill Down visuals, the report enables intuitive and dynamic data exploration. This project reflects my dedication to developing professional, insight-driven visual solutions that support data-informed decision-making.
Mobile view allows you to interact with the report. To Download the template please switch to desktop view.