Feel free to leave your vote:
6
Share template with others
Summary
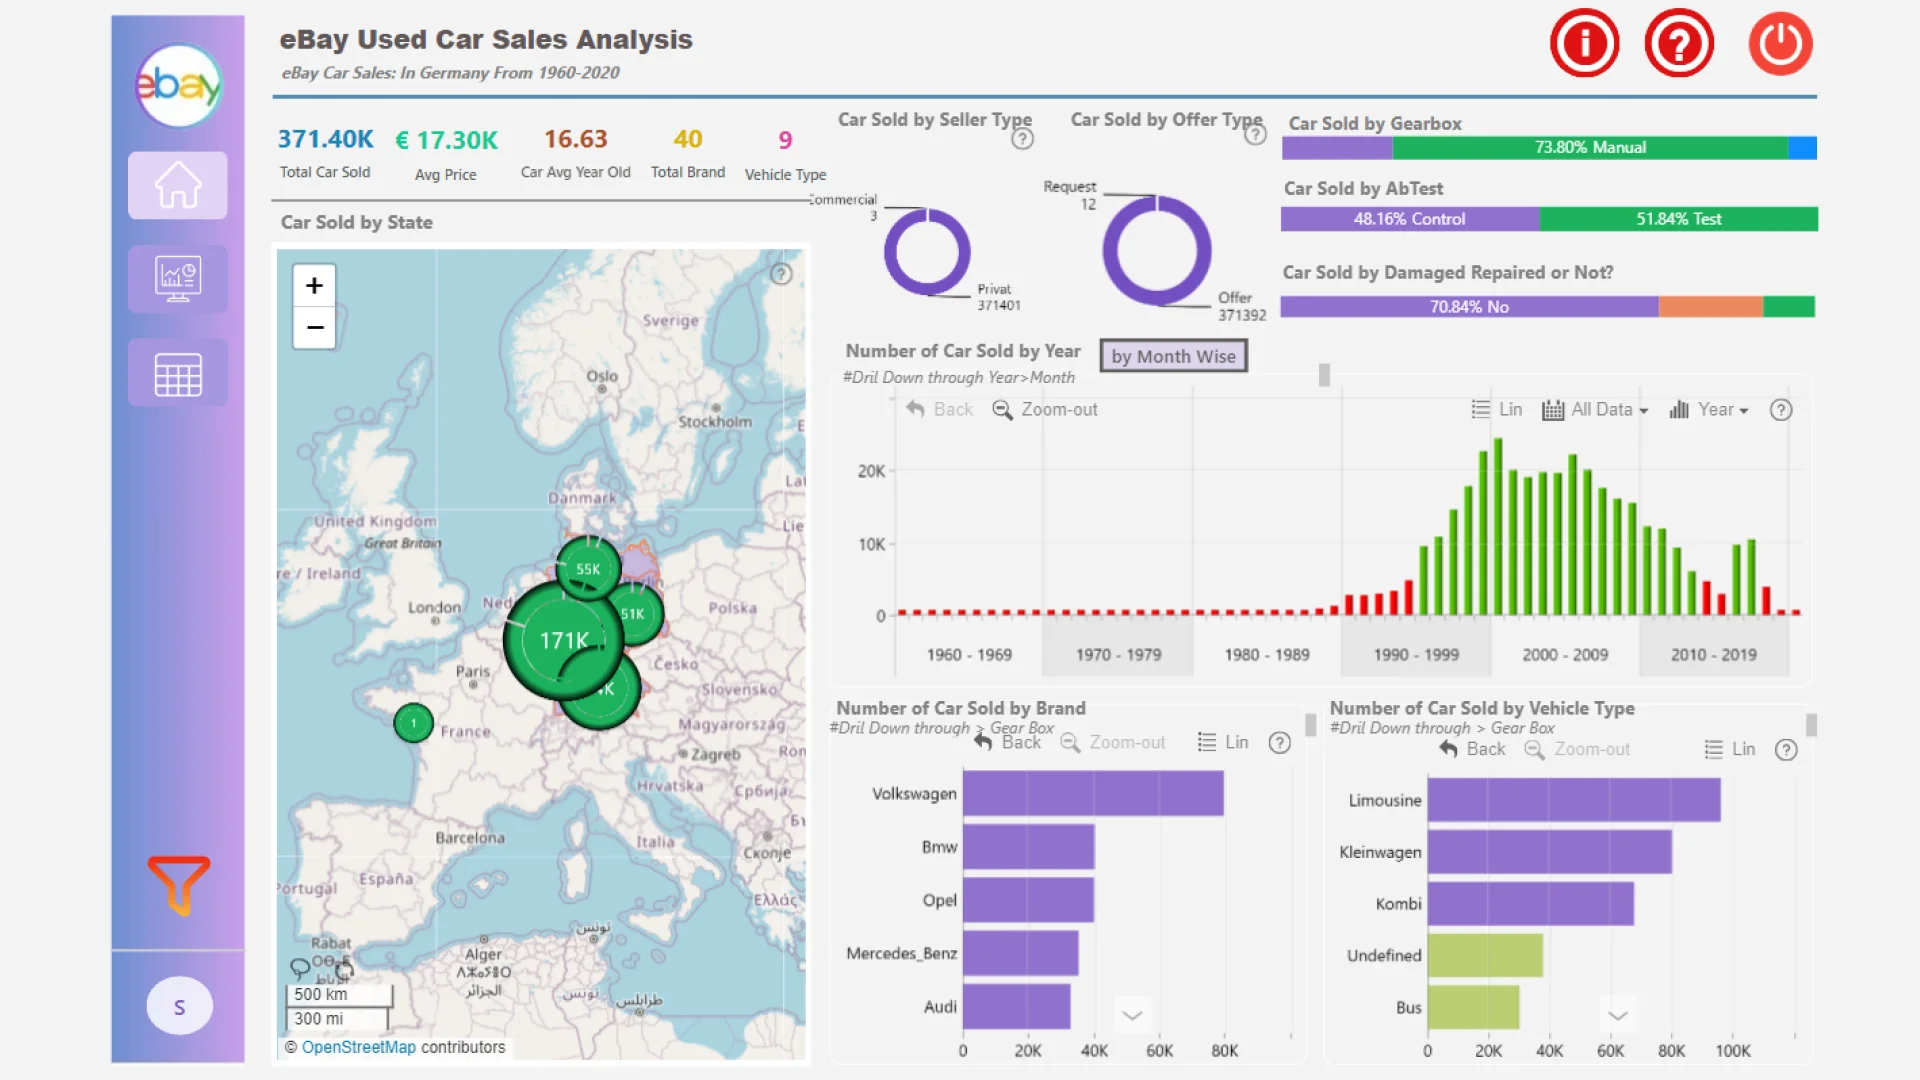
Report submitted for Onyx Data DataDNA ZoomCharts Mini Challenge, March 2024. The report was built based on eBay Used Car Sales Analysis dataset and includes ZoomCharts custom Drill Down PRO visuals for Power BI.
Author's description:
This Power BI report is designed to analyze the German eBay used car sales dataset from 1960 to 2020. It aims to address key questions regarding the most purchased car brands, states with the highest car purchases, and the best months for buying cars.
Home Page: Based on the request, I've structured three distinct pages. The Home Page serves as the central hub of the project, providing essential KPIs such as total used cars sold, average price per car, and total brands and vehicle types.
Insights Page: An optional page offering valuable insights such as car sales by fuel type, top 10 models by sales, and KPIs like the percentage of cars priced at zero. It also features visualizations illustrating how fuel type, vehicle type, and brand influence average prices.
Tabular View Page: Another optional page allowing users to explore detailed datasets using various filters based on their selections.
ZoomCharts visuals used
Mobile view allows you to interact with the report. To Download the template please switch to desktop view.
