Feel free to leave your vote:
18
Share template with others
Summary
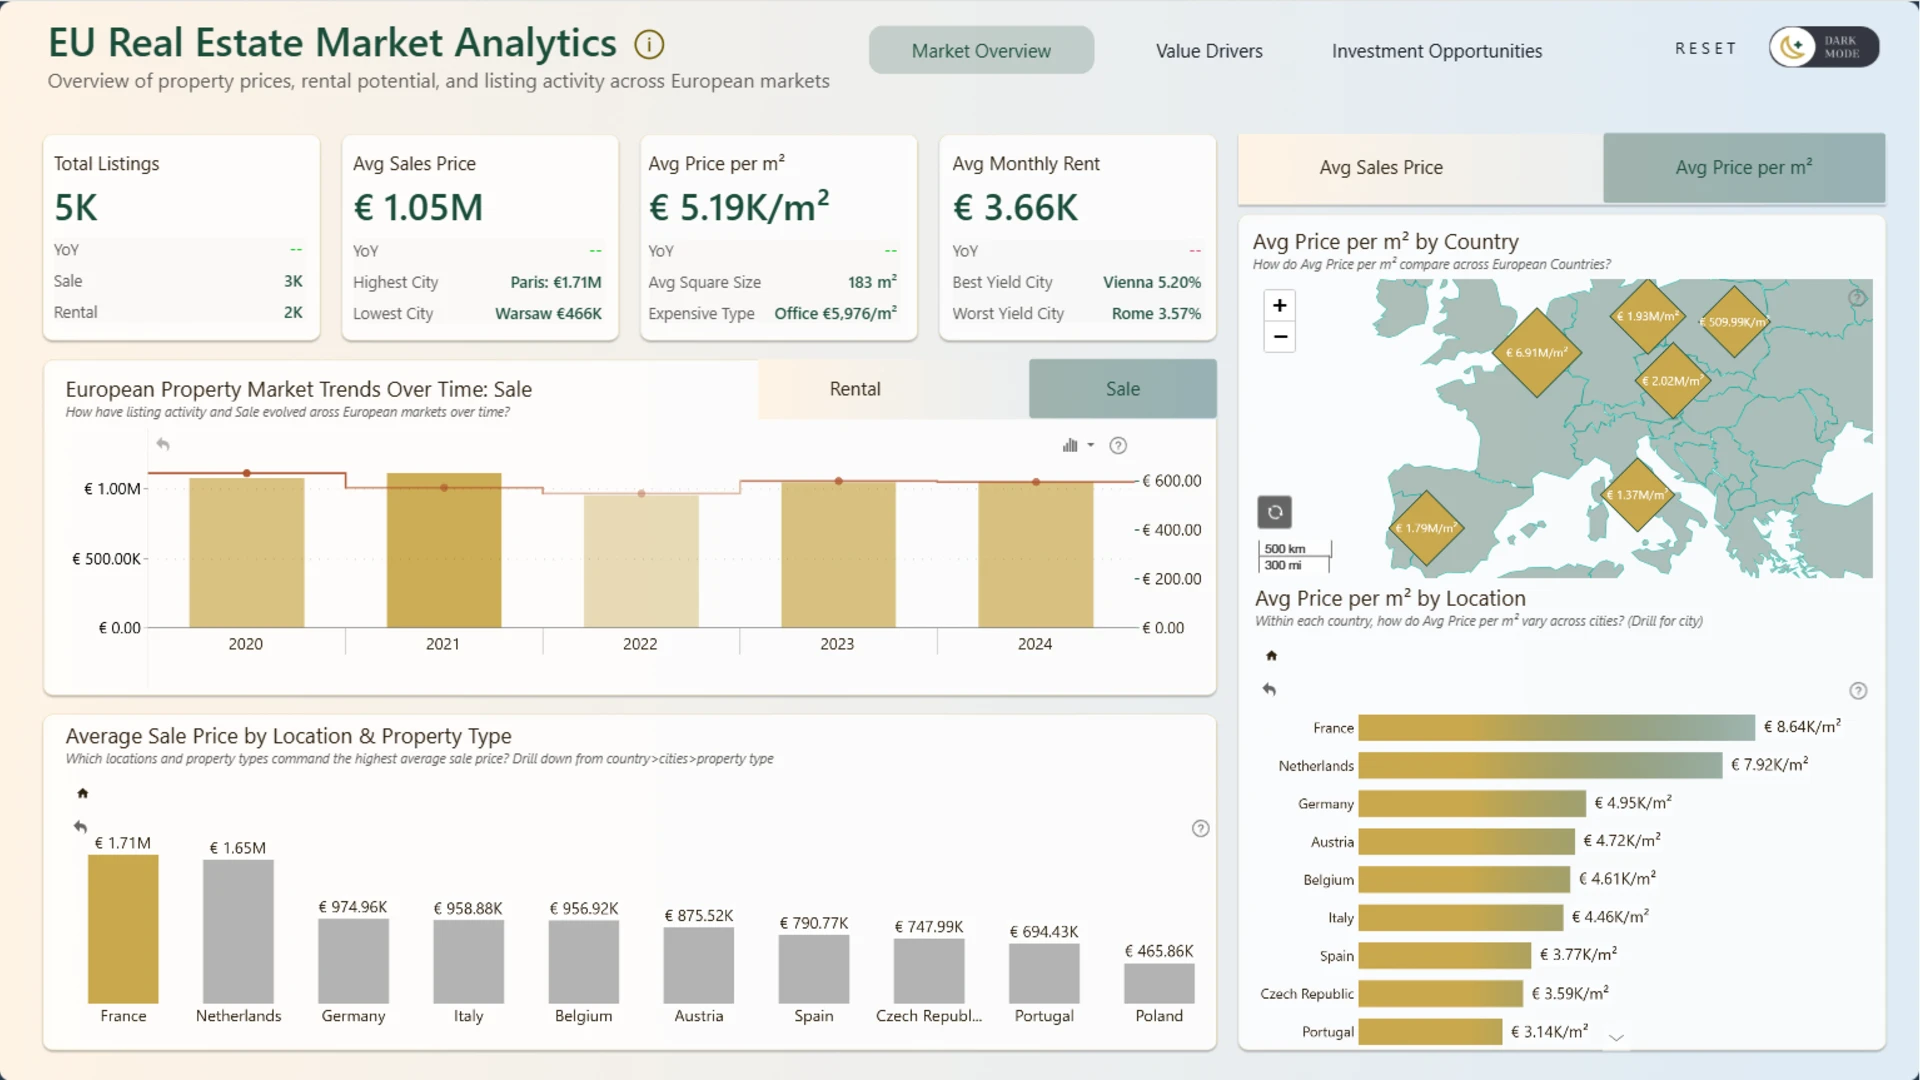
This interactive Power BI report explores the European Real Estate Market Analytics dataset using ZoomCharts Drill Down custom visuals for Power BI. It highlights property prices, price per square meter, listing activity, and property characteristics across countries and cities, helping users identify market trends, compare locations, and evaluate investment opportunities.
The report was submitted to the FP20 Analytics ZoomCharts Data Challenge #36 (March – April 2026).
Author’s Description:
EU Real Estate Market Analytics is an interactive data analysis project designed to provide insights into property pricing, rental potential, and market activity across European cities. The dashboard explores key value drivers such as property size, layout, energy efficiency, and building characteristics, while also assessing investment potential through rental yield and market liquidity indicators. By combining pricing, demand, and return metrics, the analysis supports data-driven decision-making for investors and stakeholders.
Mobile view allows you to interact with the report. To Download the template please switch to desktop view.