Feel free to leave your vote:
17
Share template with others
Summary
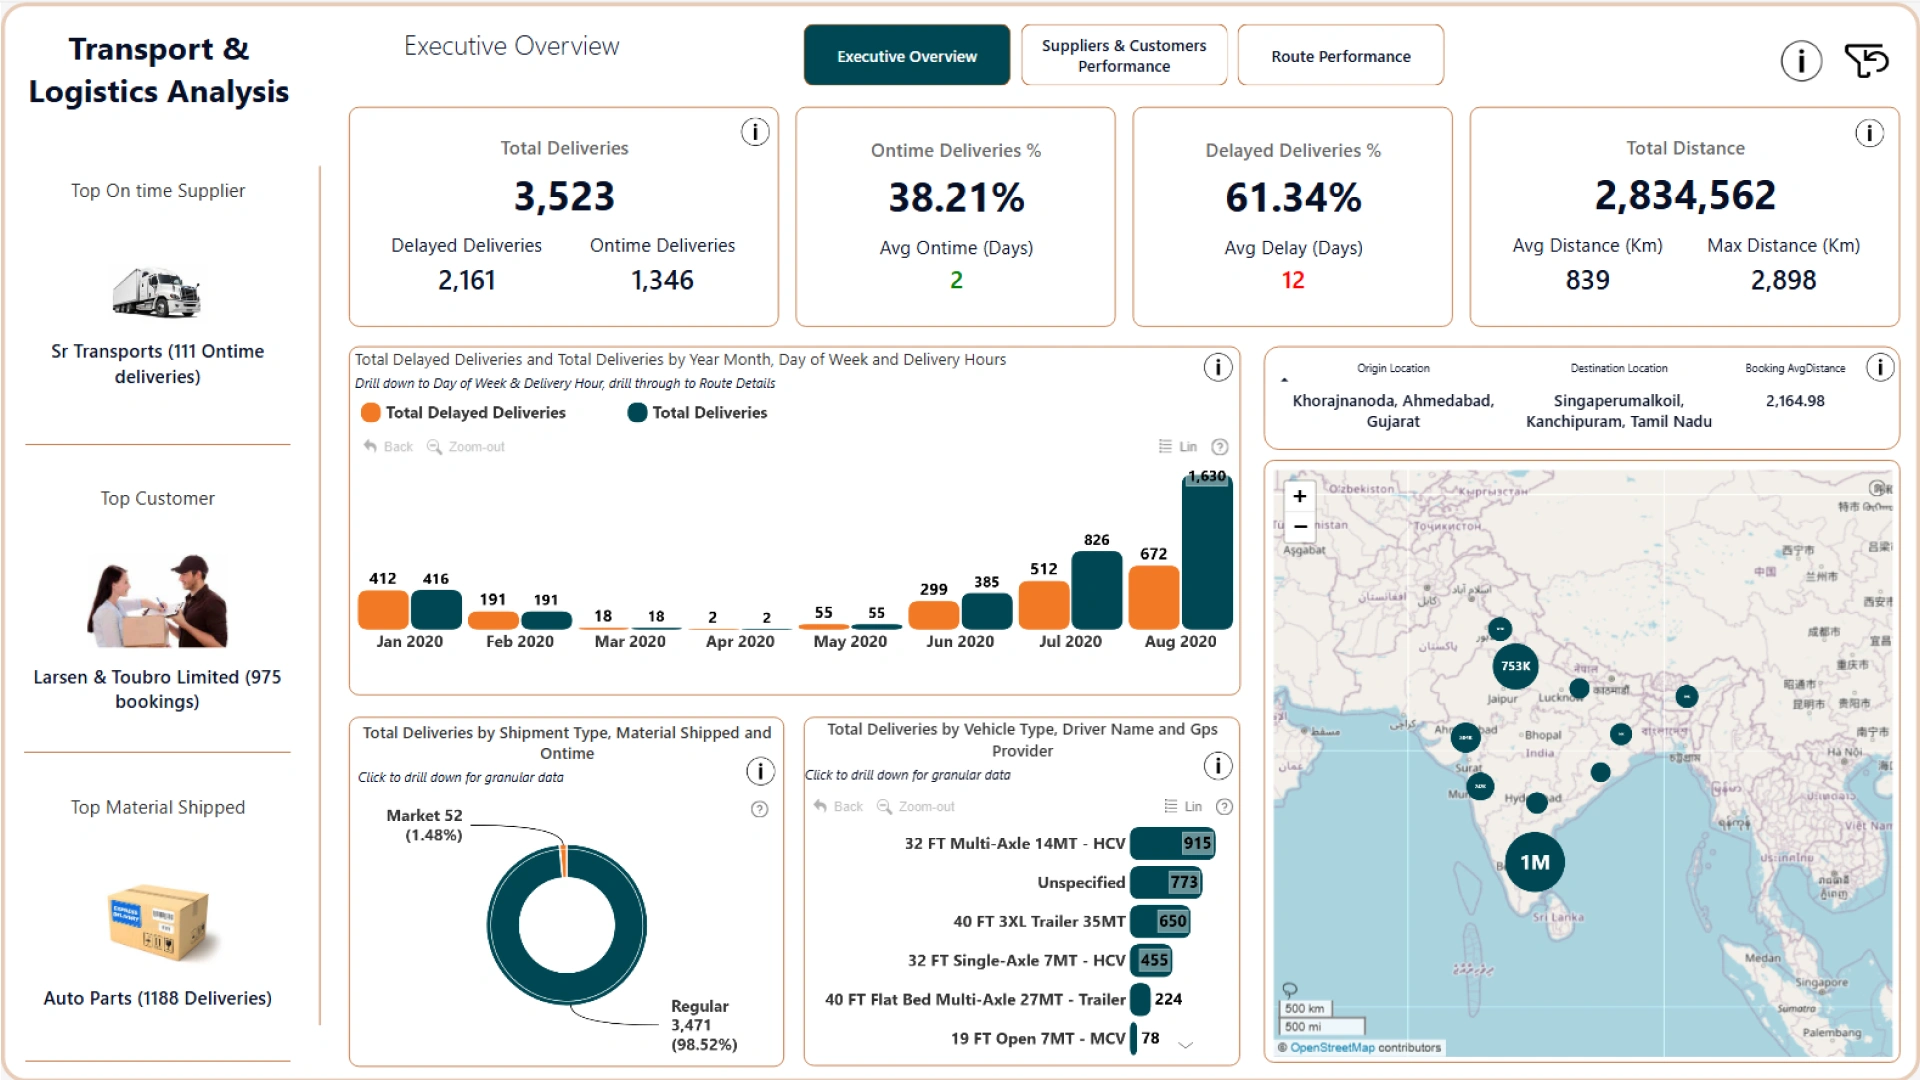
This interactive Power BI dashboard provides a comprehensive analysis of supplier, customer, and route performance using field parameters for dynamic metric selection. Key features include: ✅ Drill-through from KPIs & Visuals – Analyze deliveries, distance, and delays in depth ✅ Trend Analysis – Identify disruptions and recovery patterns over time ✅ Supplier & Customer Insights – Top performers by deliveries and on-time shipments ✅ Route Analysis – Understand delay patterns and performance across locations With interactive drilldowns and customizable views, this report enables data-driven decision-making for logistics optimization.
ZoomCharts visuals used
Mobile view allows you to interact with the report. To Download the template please switch to desktop view.
