Welcome to the FP20 Analytics February 2025 Challenge!
Feb 19 - Mar 25, 2025 | EDT
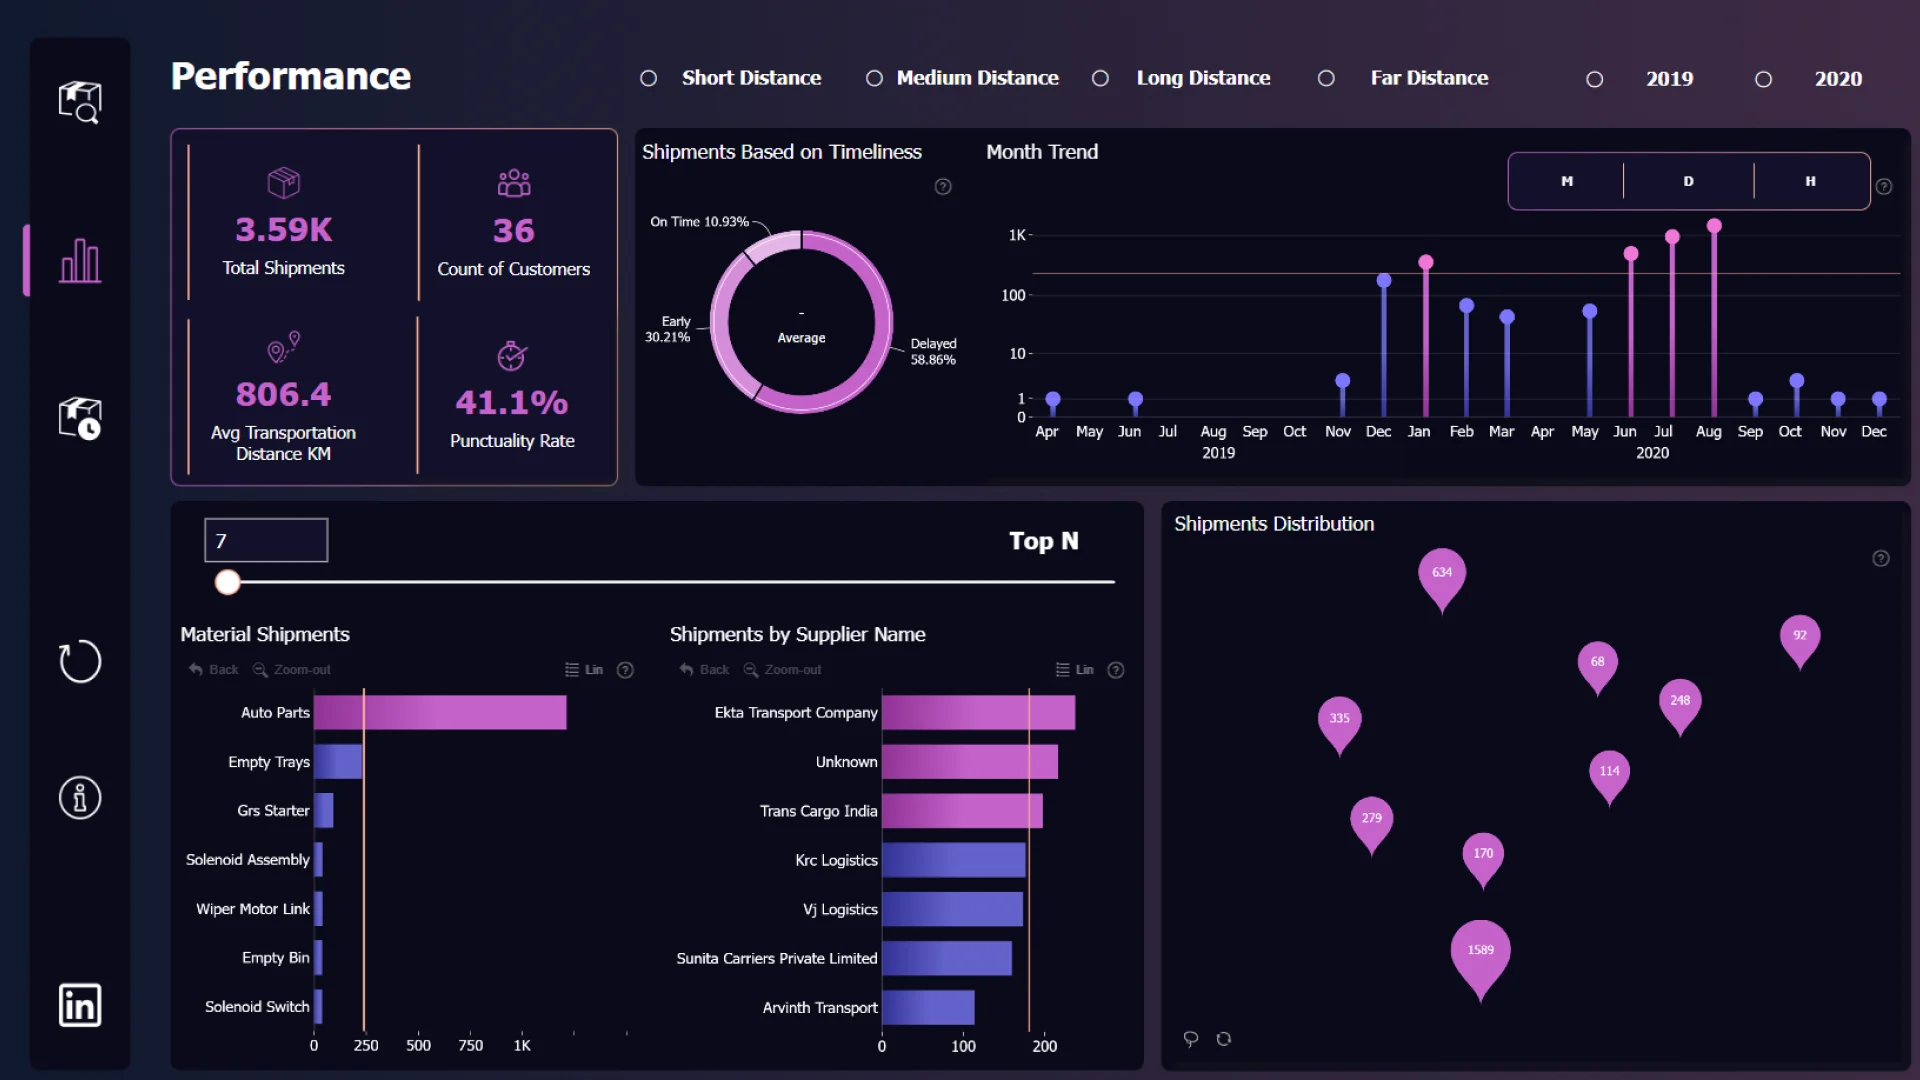
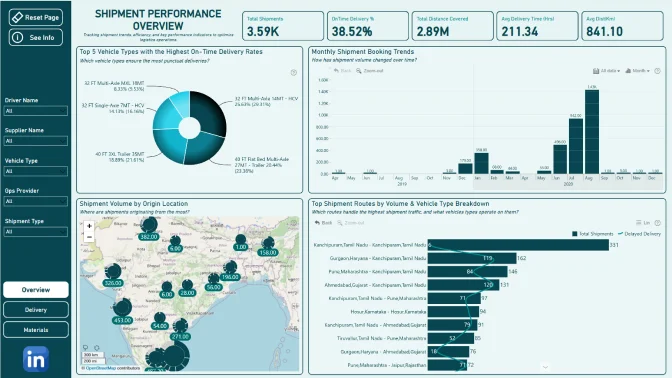
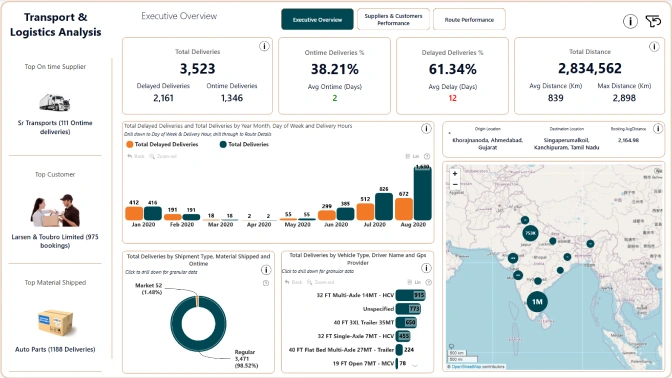
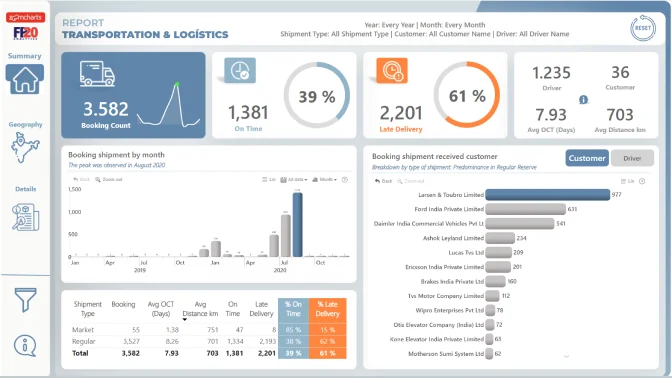
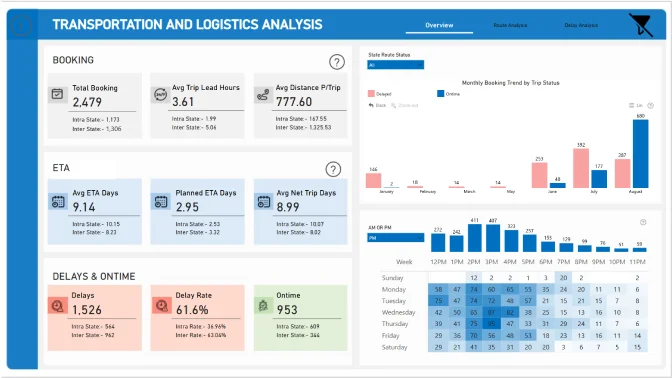
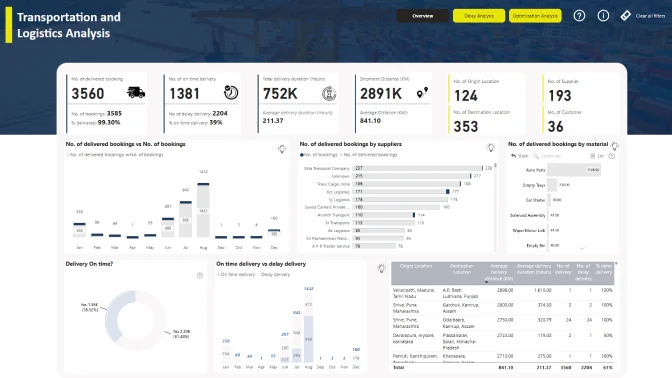
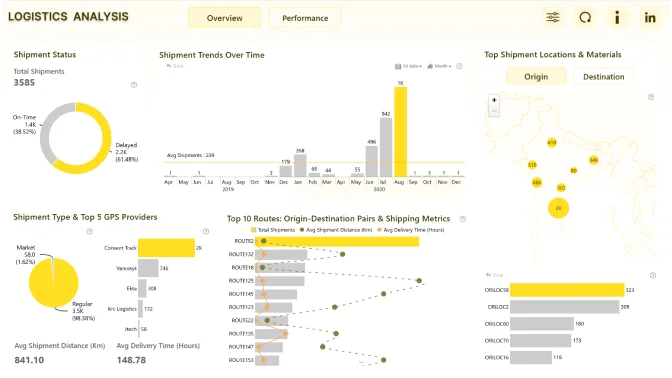
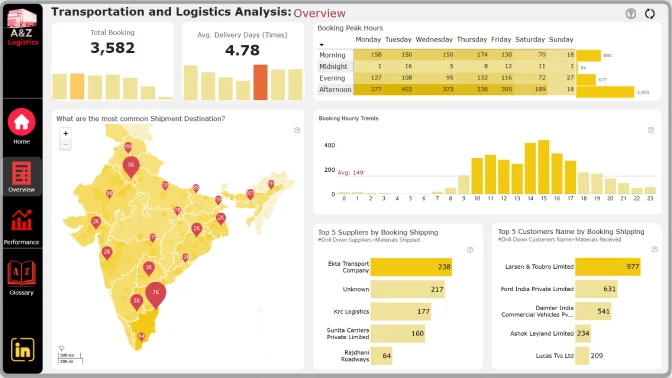
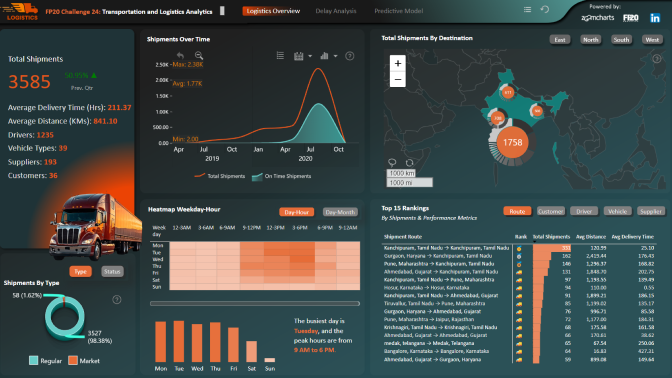
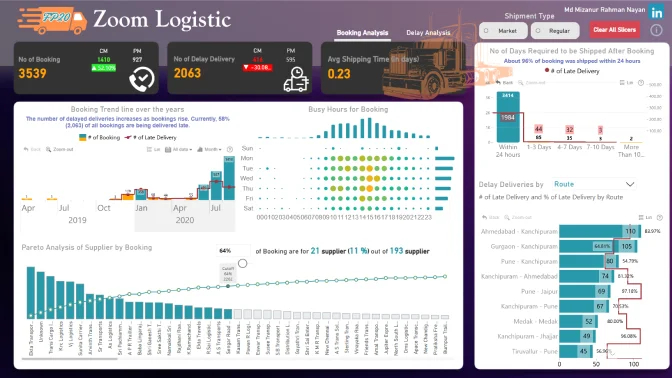
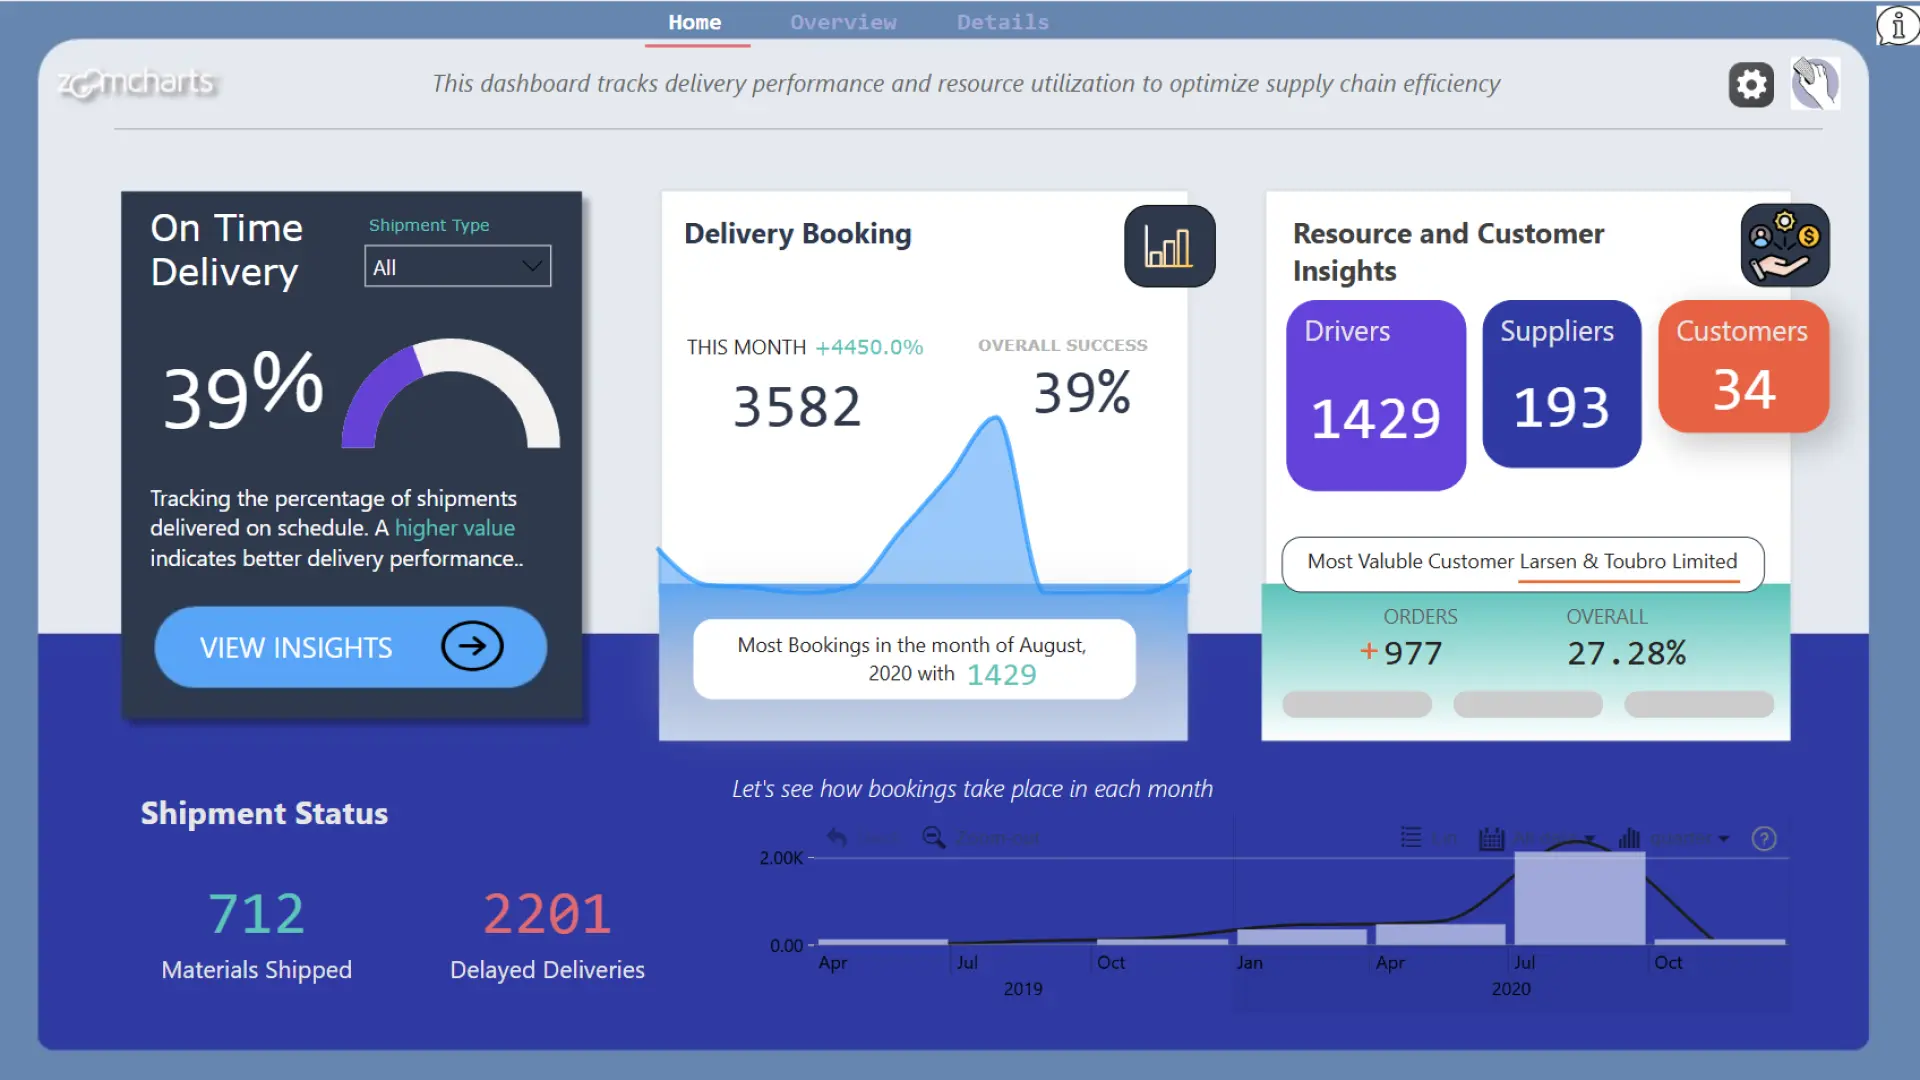
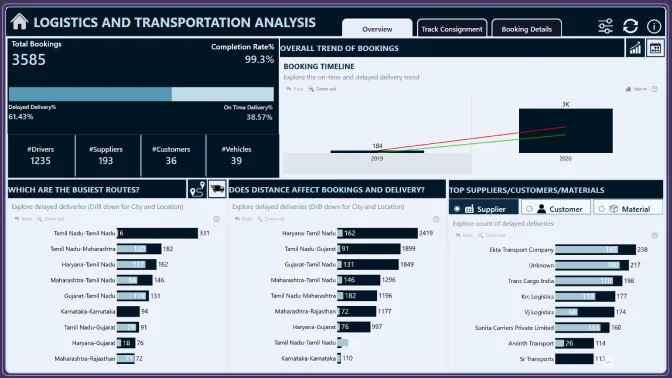
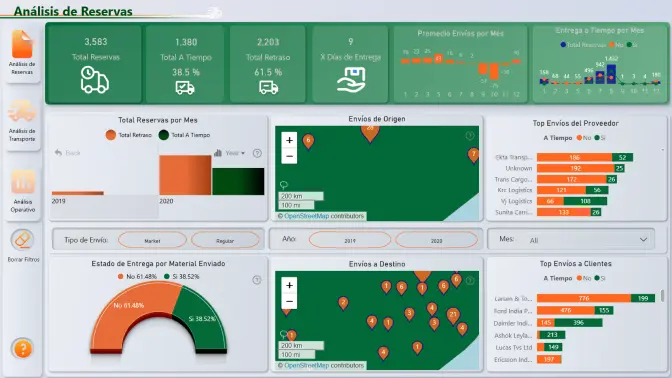
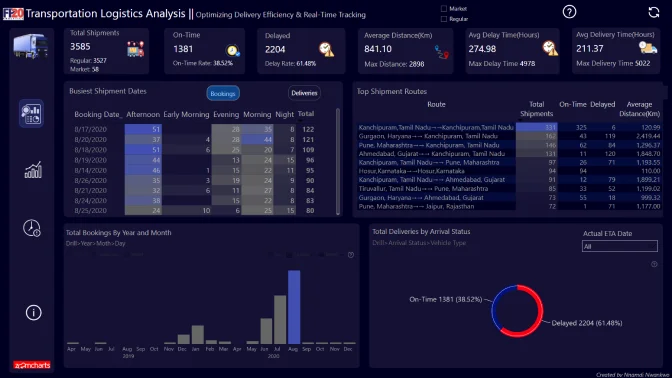
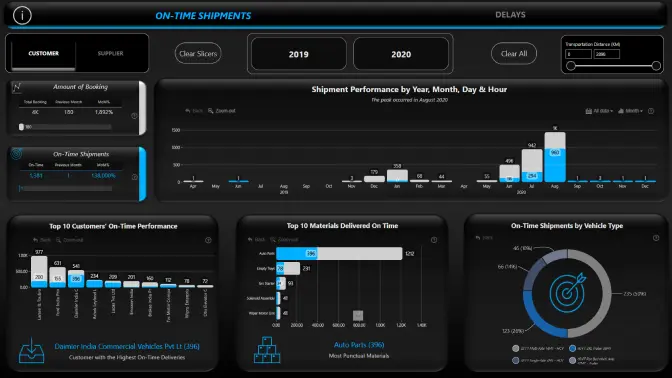
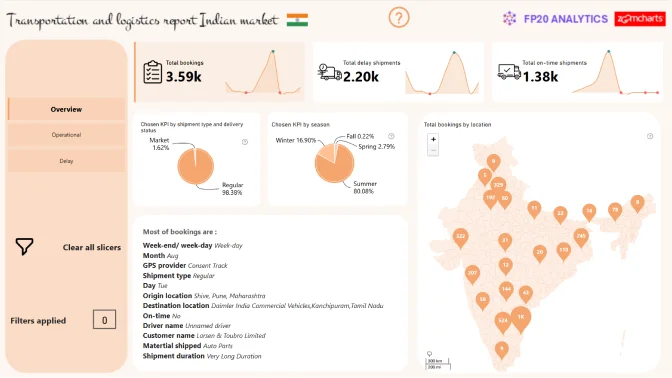
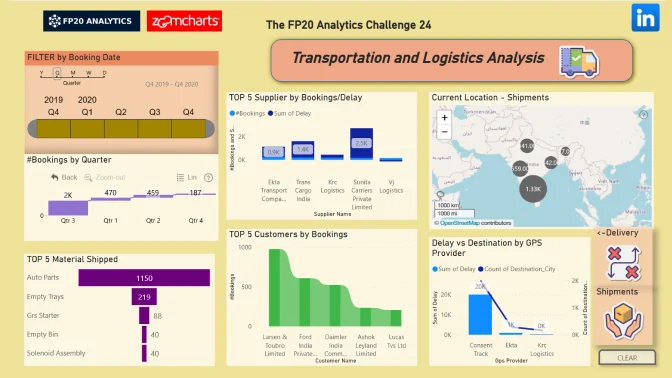
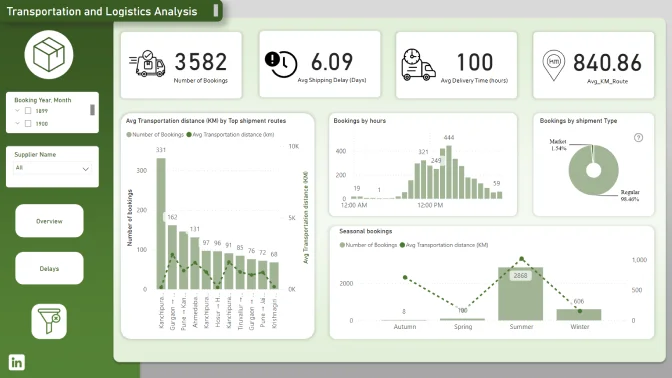
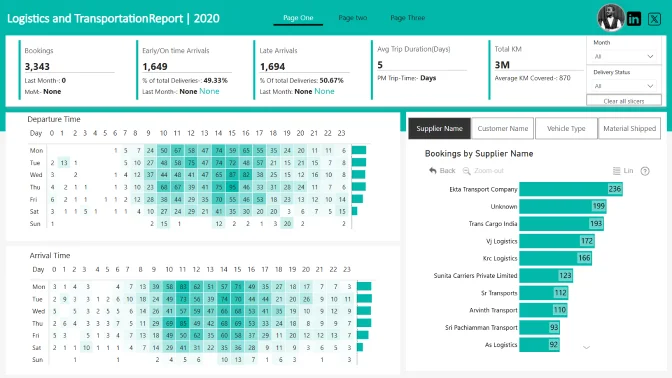
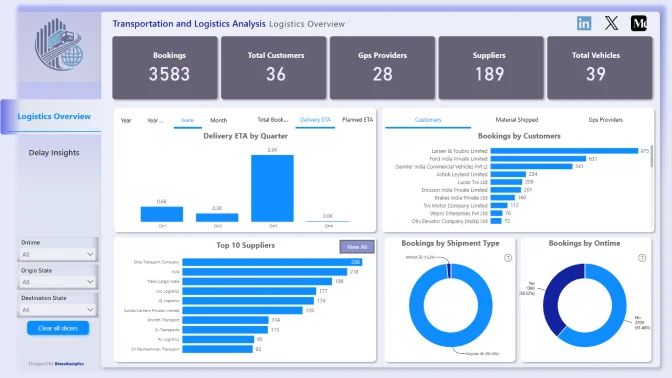
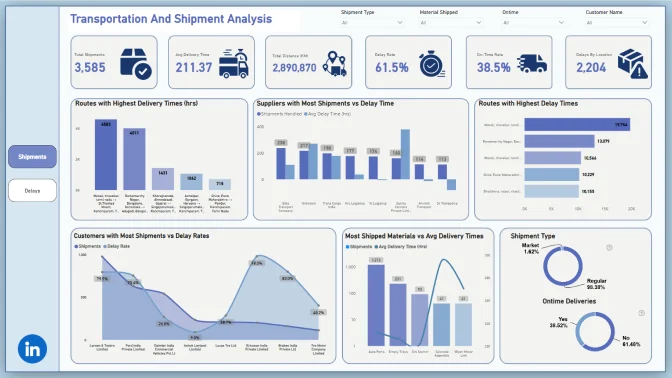
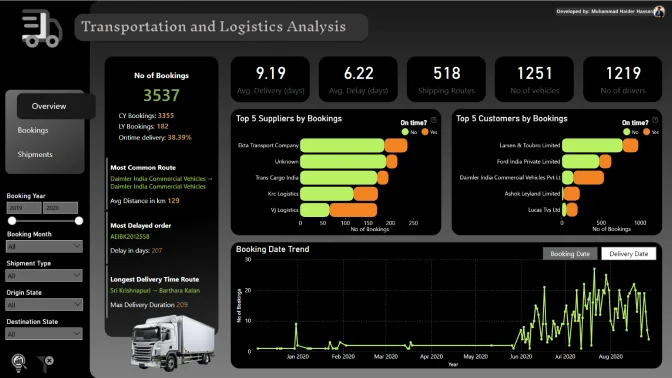
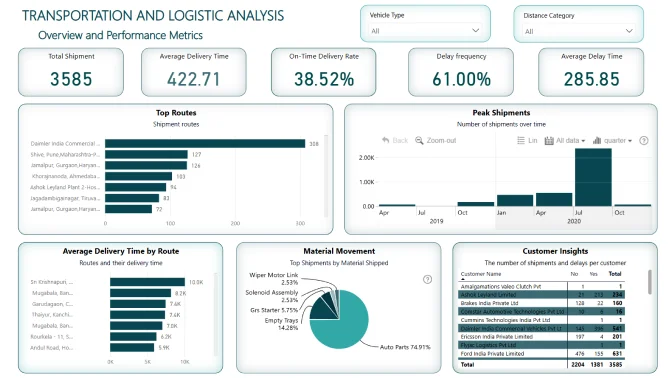
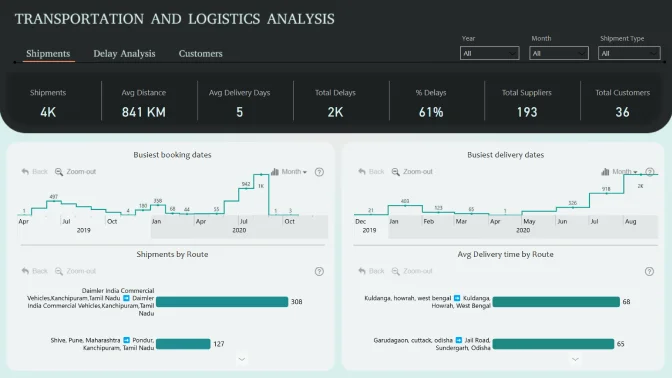
Join Challenge 24 and create a Power BI report for transportation and logistics!
Submission deadline
00
DAYS
00
HOURS
00
MINUTES
00
SECONDS
Sign in or sign up to continue
Already have an account? Sign in!
Register for the FP20 Analytics ZoomCharts Challenge!
Activate your Drill Down visuals Developer License!
Use these credentials to access ZoomCharts visuals and create your report for the ZoomCharts Challenge or for your personal training.
Ready to submit your report for review?
Thank you! Your report has been submitted!
Submitted:
Your report will undergo validation. Once the validation of your report is complete, we will send you a Power BI Publish to Web link that you can share publicly.
Confirmed your submission fits the criteria:
Reviewed:
Rejection reason:
Sorry, we are no longer accepting entries for this competition. Stay tuned for future events!
Want to learn to build PRO reports? With personalized feedback and informative workshops, this is your opportunity to take your report-building skills to the next level, build your professional portfolio, and network with like-minded people.
The ZoomCharts challenge is hosted in partnership with FP20 Analytics – a group that unites passionate and inspiring data enthusiasts, and helps new data analysts improve their skills and build a competitive portfolio. Join in and sharpen your skills together with this open and friendly data community. Read more about the challenges on the FP20 Analytics website. Join the community on LinkedIn.
Participate in FP20 Analytics ZoomCharts Challenge to enrich your skill in creating PRO reports that help business users explore data quickly and intuitively.
Free License: All participants receive a free ZoomCharts Developer License that gives access to the full Drill Down PRO visuals library. License will remain active for 1 year after the challenge.
Learn from Experienced Professionals: As part of the challenge, we host live workshops on report building and visualizing the challenge’s dataset in Power BI. Challenge participants can also book an individual consultation with an experienced Power BI mentor to ask questions and get personalized tips.
Tailored Feedback: Every challenge submission will receive personalized feedback, giving participants the chance to hone their skills and improve their reports.
Prizes
The best report’s creator will receive a $300 Amazon gift card from ZoomCharts. The ZoomCharts winner will be announced in a special live webinar session on March 25th, where we will review the Top 5 entries from the challenge.
Webinars
Learn more about ZoomCharts visuals & gain a knowledge advantage in the contest by joining the upcoming webinars! You'll also get the chance to your ask questions and get expert answers in the Q&A section.
Read the challenge brief (see "The Brief" section)for additional info about the dataset and to see what questions your report should answer.
2. Build your report in Power BI:
Set up an account in Power BI using the assigned license details (if you have participated in ZoomCharts Challenges in the past, you can use the same account you set up before).
Use the account to access the full library of custom ZoomCharts Drill Down visuals.
Use the dataset to build a Power BI report including at least 2 ZoomCharts Drill Down Visuals in one report page.
The recommended number of pages in the report is up to 3 pages, including drill-through pages.
3. Improve your report and learn new skills:
To learn more about applying ZoomCharts visuals in your reports, participate in the challenge workshop.
If you have any questions or need advice, you can book a free individual consultation.
Check out the submissions from past challenges for inspiration.
4. Submit your challenge entry:
Submit your report in .pbix format for validation.
If your submission doesn’t match the challenge criteria, you will be notified by email indicating the reason. Don't worry if this happens! You can fix the issue and resubmit your report.
Together with validation confirmation, you will receive a publish to web link that you can use to add the report to your portfolio or publicly share online.
All validated entries will receive personalized feedback from the evaluation team. You can use this feedback to revise your report and resubmit it before the deadline. Feel free to resubmit your entry as many times as necessary before the deadline.
5. Finalize your participation to compete for the ZoomCharts grand prize:
Post the final version of your submission in PDF format on your LinkedIn profile.
Use the caption "I am participating in FP20 Analytics Challenge 24".
Include a summary of your report's key insights and add the ZoomCharts publish to web link.
Use #FP20Analytics, #FP20TransportationAndLogisticsAnalysis, #builtwithzoomcharts, tag @FP20 analytics challenges group, @Federico Pastor, @Zoomcharts and @Enterprise DNA.
Additionally, post your report in the FP20 Analytics LinkedIn Community group.
Follow ZoomCharts on LinkedIn
6. Attend challenge closing webinar to hear the results:
The submissions are evaluated by ZoomCharts team (see "Judging criteria" for more info). The submissions of Top 5 ZoomCharts Challenge finalists are analyzed live during the challenge closing webinar to share the best practices and learning opportunities with the community.
The author of the best report is awarded with a $300 Amazon gift card.
Technical requirements
Build your report using only Power BI
The recommended number of pages in the report is up to 3 pages, including drill-through pages.
Canvas size is 16:9 (Default Power BI size) or Full HD size = w:1920 - h:1080
The report should contain at least 2 ZoomCharts Drill Down visuals within a single page. See a practical guide for using Drill Down visuals here
About the Dataset
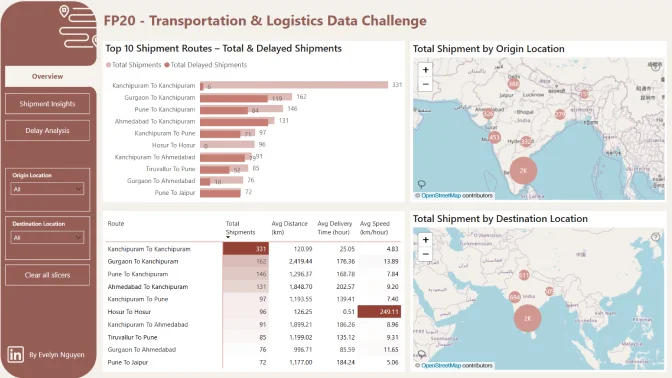
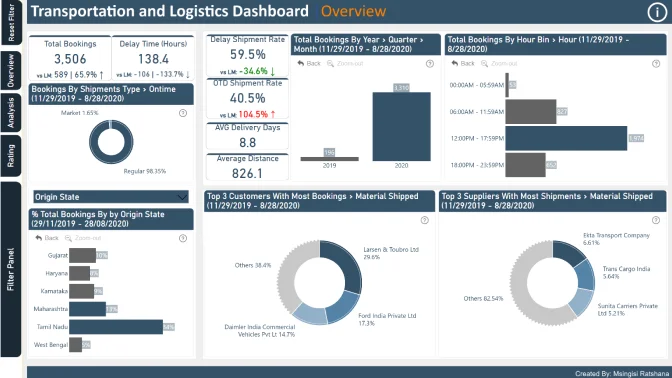
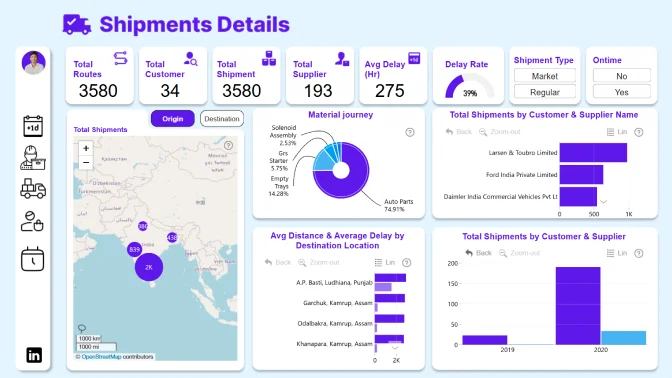
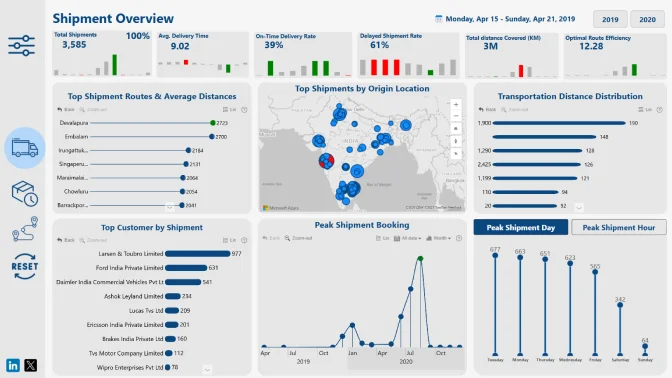
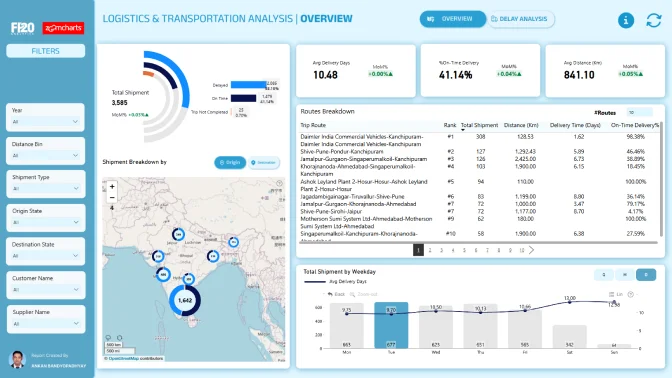
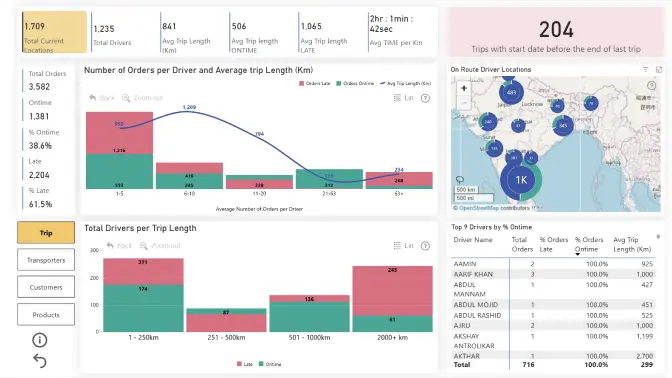
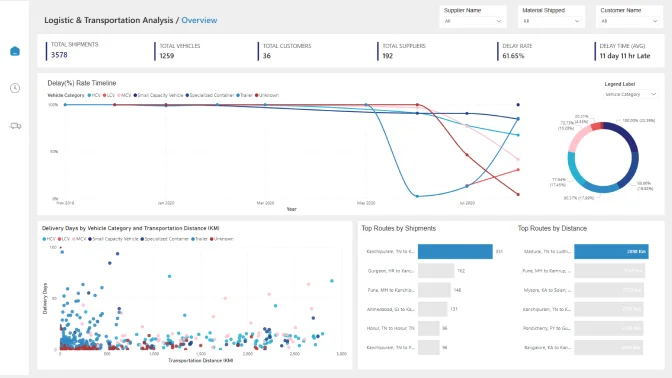
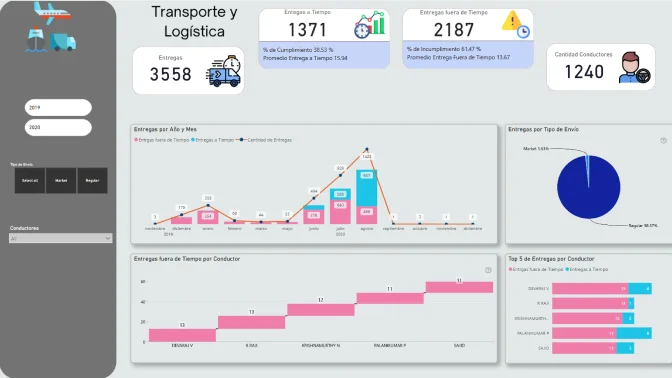
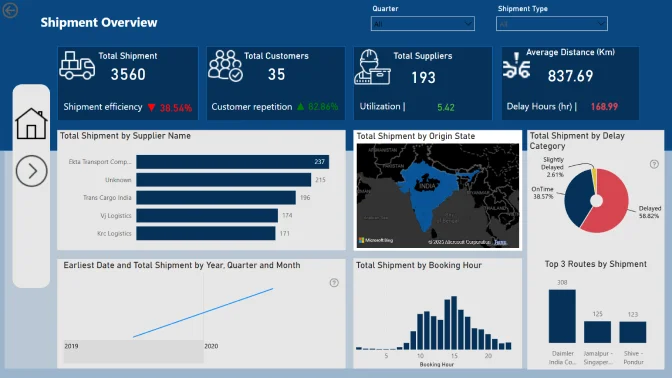
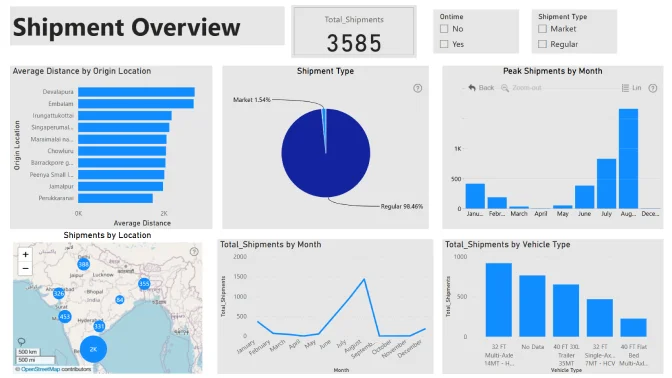
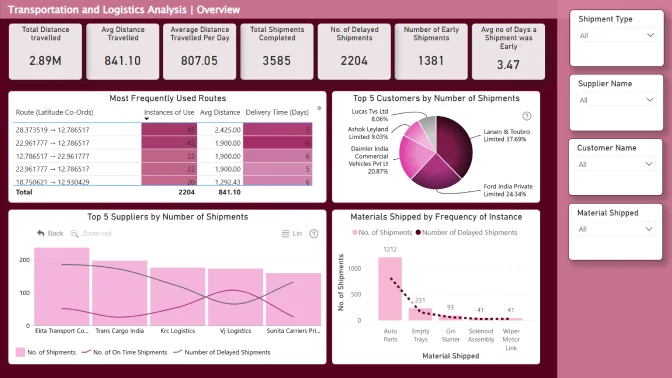
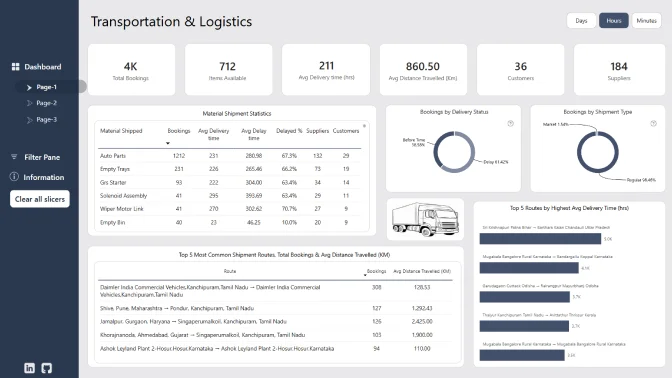
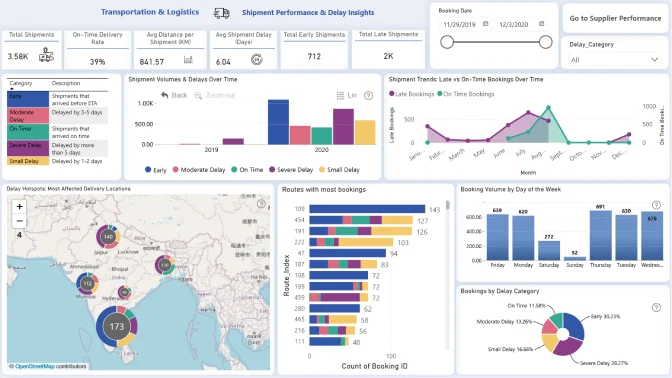
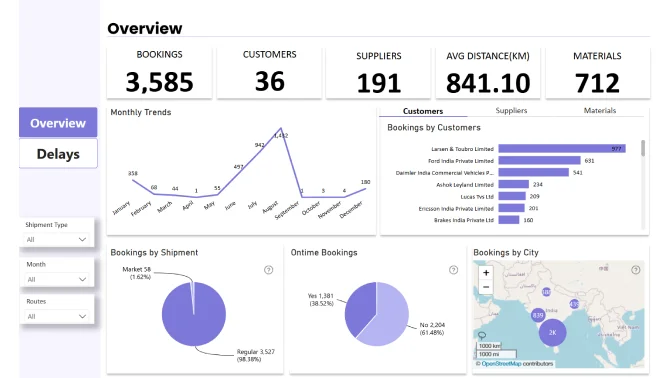
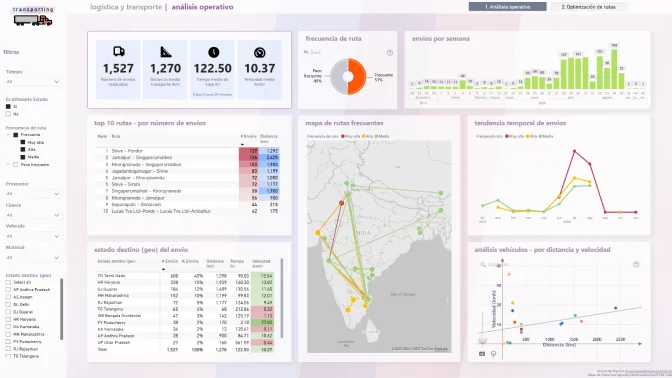
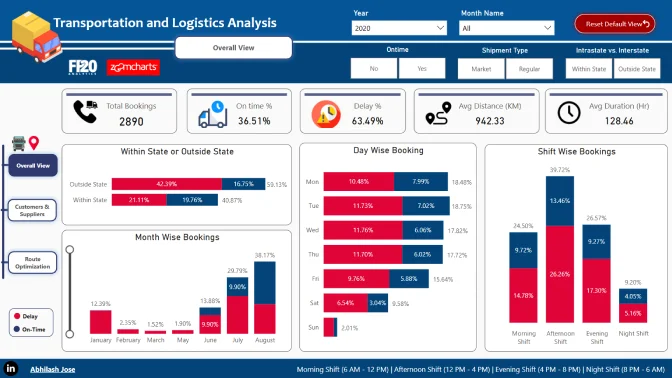
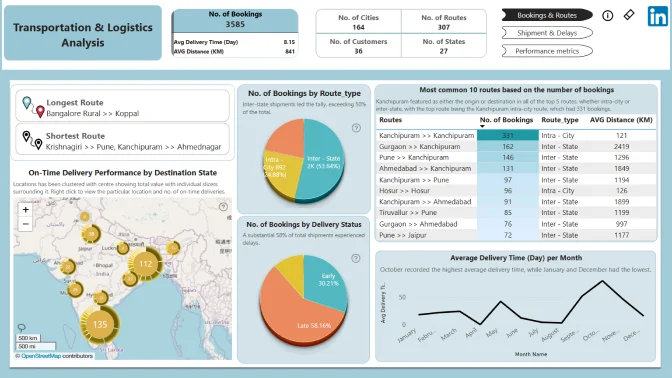
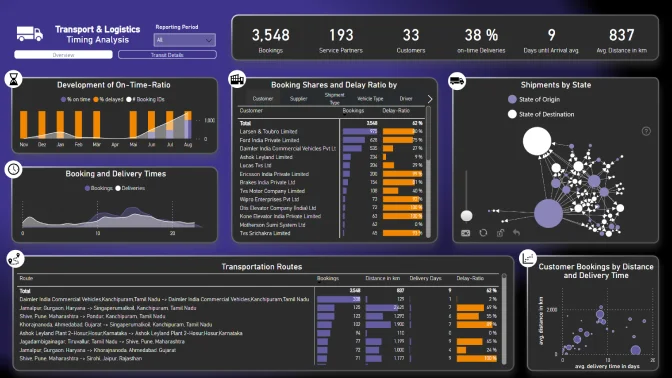
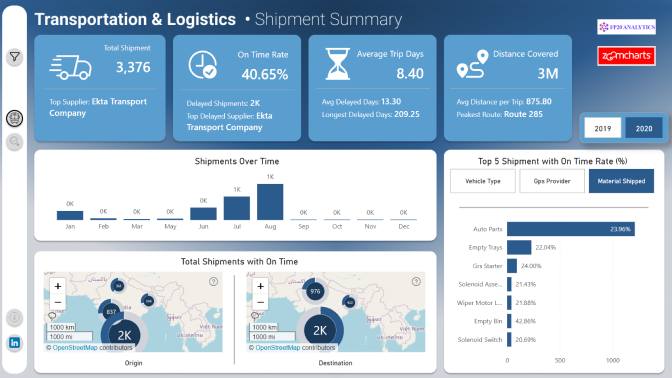
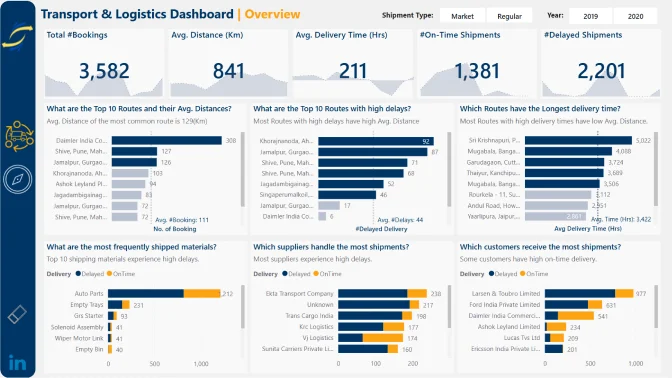
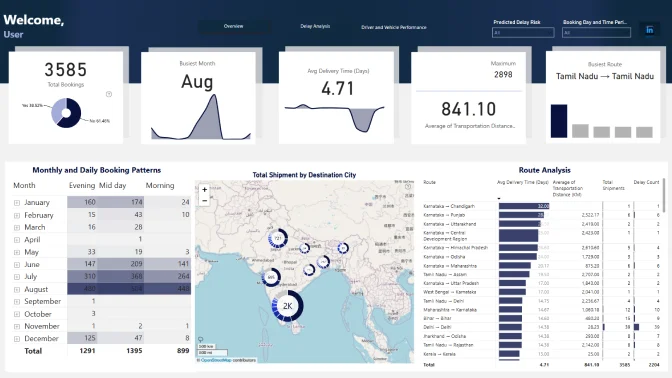
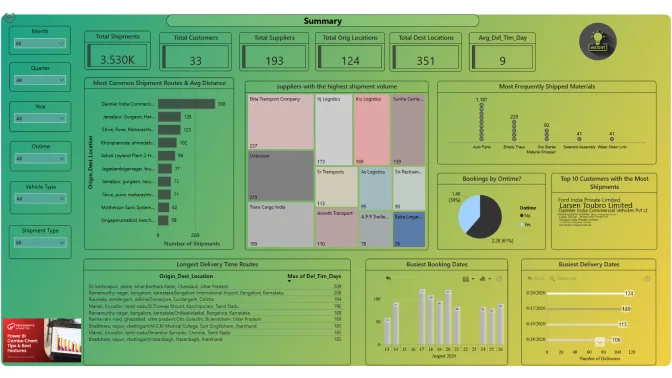
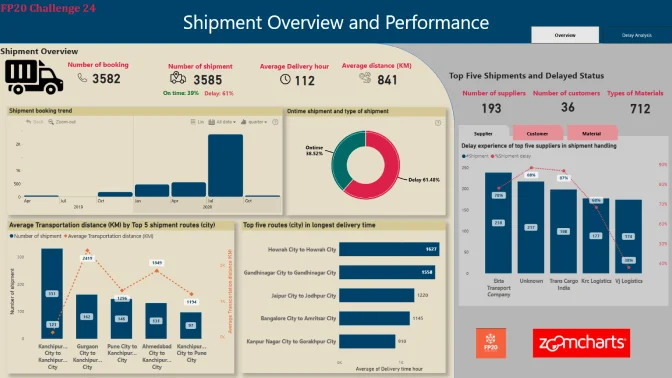
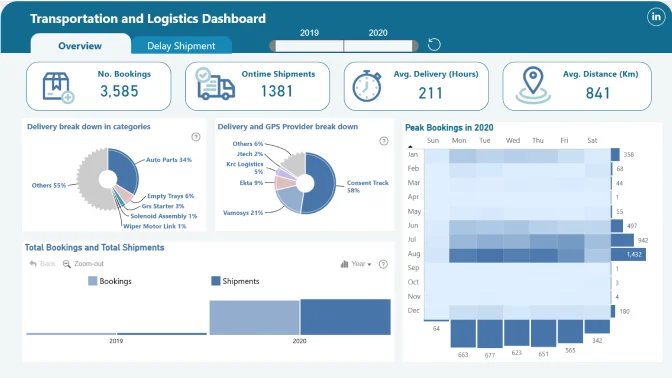
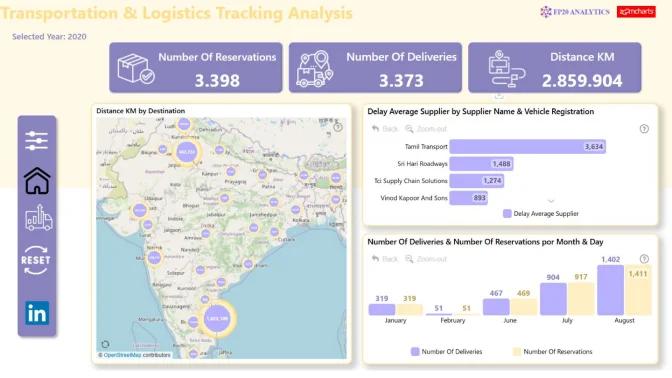
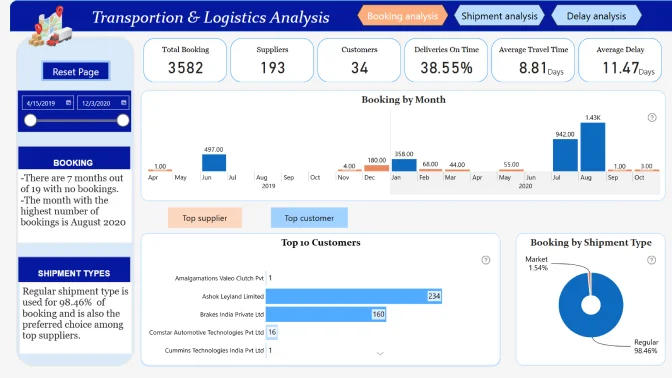
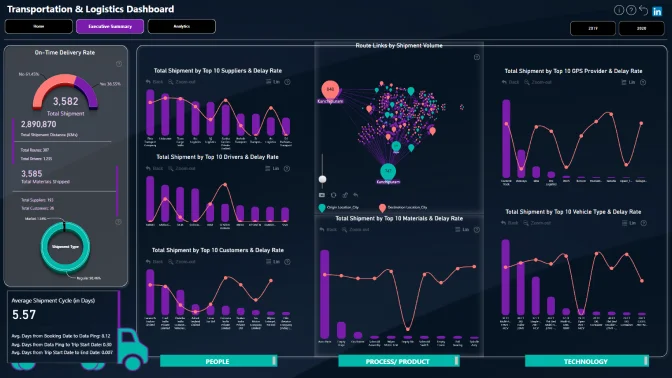
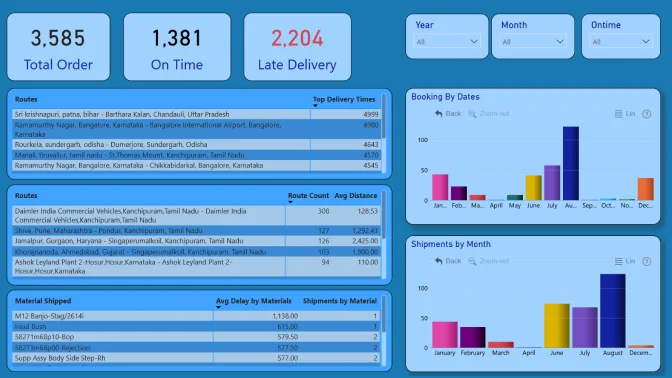
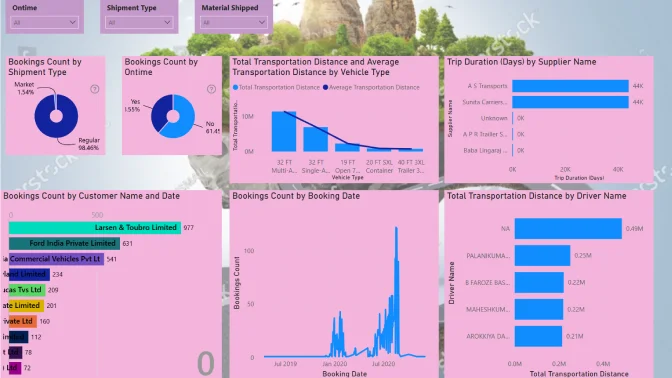
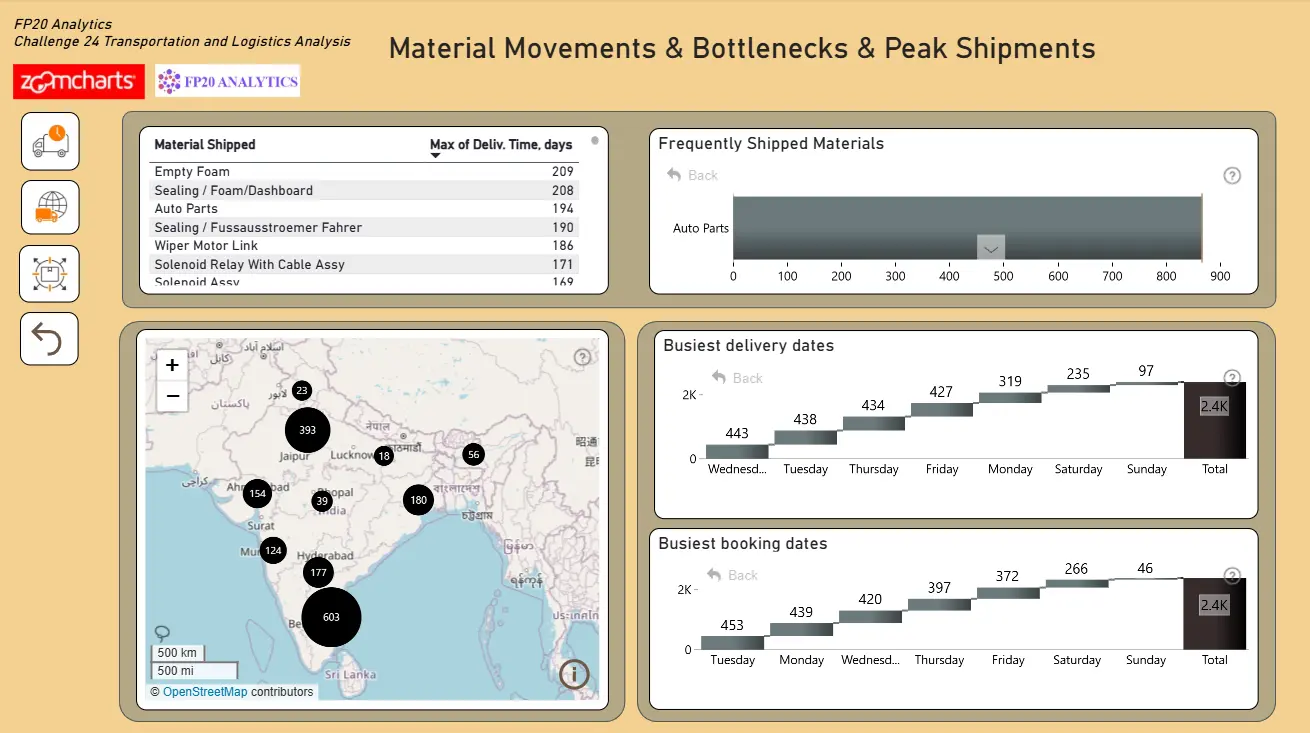
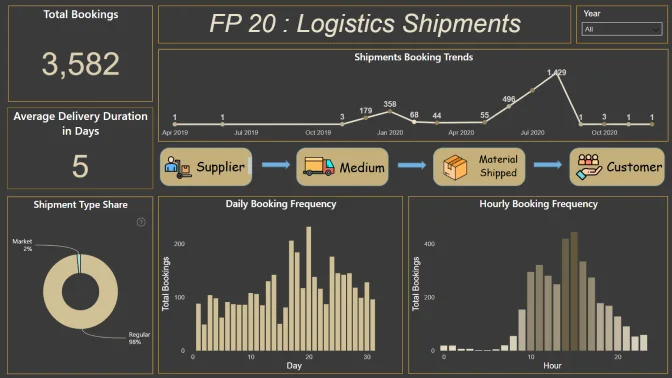
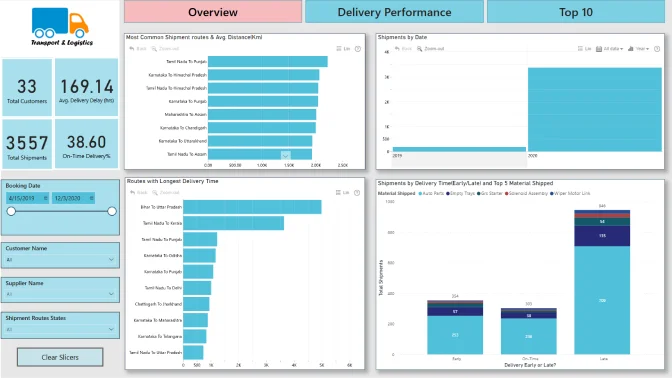
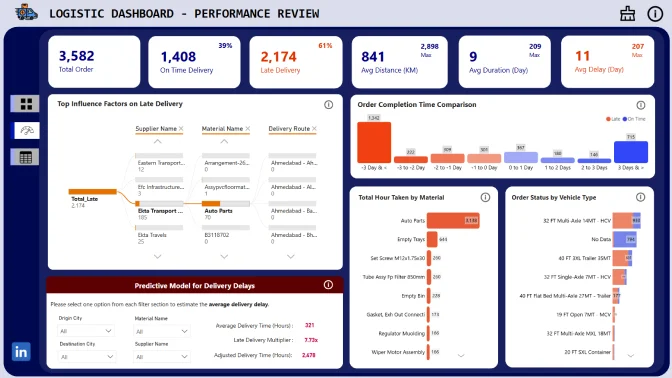
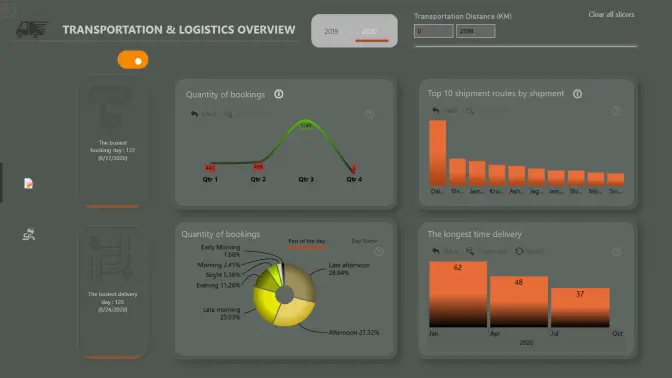
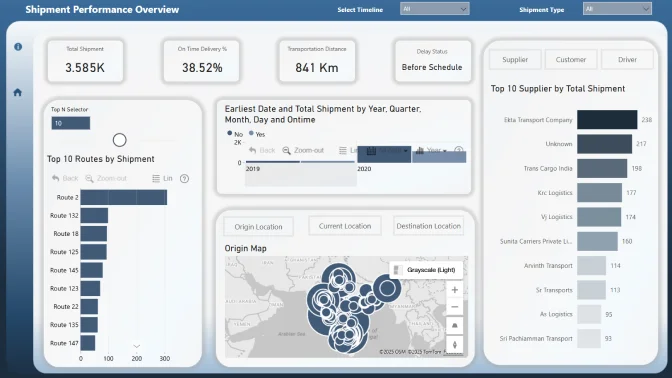
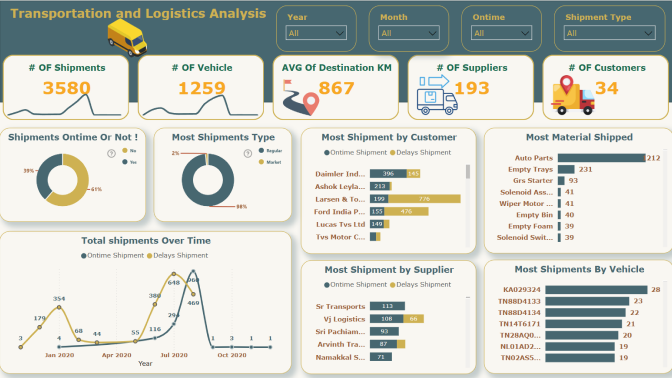
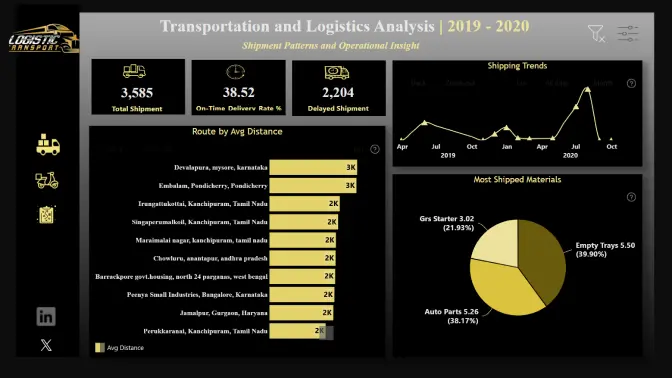
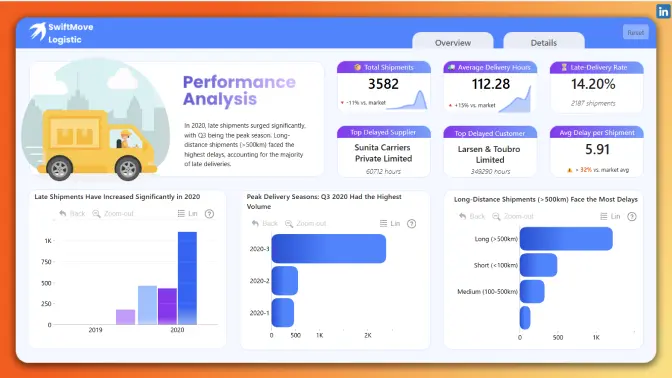
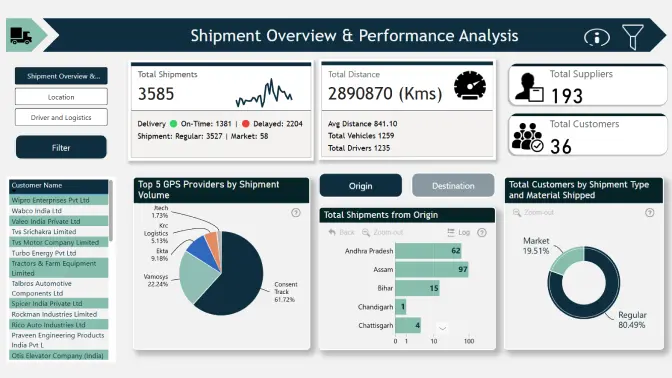
Welcome to the Transportation & Logistics Data Challenge! In today's fast-paced supply chain industry, optimizing shipment efficiency, reducing delivery times, and enhancing operational visibility are critical for success. This challenge invites data enthusiasts to explore and derive actionable insights from a real-world logistics tracking dataset, featuring shipment records, GPS tracking, vehicle information, and transportation distances
Top Routes: What are the most common shipment routes and their average distances?
Delivery Times: Which routes have the longest delivery times?
Peak Shipments: When are the busiest booking and delivery dates?
Delays Analysis: What factors contribute to shipment delays?
Supplier Trends: Which suppliers handle the most shipments, and do some have higher delays?
Customer Insights: Which customers receive the most shipments, and do they experience delays?
Material Movement: What are the most frequently shipped materials, and do certain materials have longer delivery times?
Bottlenecks: Where are the most common shipment delays based on GPS data?
Predicting Delays: Can you build a model to predict shipment delays?
Route Optimization: What strategies can improve transportation efficiency?
Judging criteria
Business users use reports to make data-driven decisions. That’s why reports are called effective if they enable users to drill down and filter data quickly and intuitively to find answers to any question they might have and analyse data in all possible directions and dimensions.
Each report is evaluated based on three main criteria: intuitiveness, insightfulness, and interactivity. These factors ensure that the reports are not only accurate and functional, but also meet the target audience's needs and are ready to be presented to the end-users.
Intuitive: How clear and easy it is to understand the report at a glance? (max 15 points)
Is the report visually appealing?
Choice of charts and visual elements
Does the report tell a story?
Is it not overwhelming to the user?
Choice of tooltips, titles, and legends
Interactive: How engaging and seamless is the report exploration and interaction with data? (max 15 points)
Clear navigation that allows user to explore the report
Use of slicers and other interactive elements
Smooth cross-chart integration
Is report optimized for touch devices?
Are tutorials and guiding elements helpful to the user?
Insightful: How accurate, complete, and meaningful is the data in driving decisions? (max 15 points)
Depth of analysis
Data cleaning and preparation
Does data show up accurately in the report?
Is report optimized for quicker loading time?
Does the report provide deeper exploration of data (drill-down)?
You can book a personal session with Senior Product Expert at ZoomCharts, Aivis Pavlovs, to gain practical knowledge about Drill Down Visuals and how they can be used to enhance data storytelling in a report.
Use the email and password provided below to log in Power BI Desktop and access an account with a license to use all ZoomCharts Drill Down Visuals.
*This Developer License can be used to create a report for this ZoomCharts Mini Challenge or for your personal training purposes. Commercial use of this license is prohibited.
Submit your report to the FP20 Analytics ZoomCharts Challenge!
Enter your submission by attaching the Power BI report file. Your report will be published on the web, and we will e-mail you a link to your report that you can share publicly.
Activate your Drill Down visuals Developer License!
You can use these credential to access ZoomCharts visuals and create your report for this ZoomCharts Mini Challenge, or for your personal training purposes.
Invalid email address
Unfortunately, we couldn't reach the email address linked to this profile "". If you wish to receive news, feedback, and the Publish to Web link for your contest submissions, you'll need to create a new ZoomCharts account with a valid email address, or log into an existing account.
For the best experience, we recommend upgrading to ensure that all website features display correctly.
Cookie settings
We use necessary cookies for site functionality, as well as statistic, marketing, and preference cookies to enhance your experience. For more information and to manage your preferences, please visit our Cookie policy