Feel free to leave your vote:
3
Share template with others
Summary
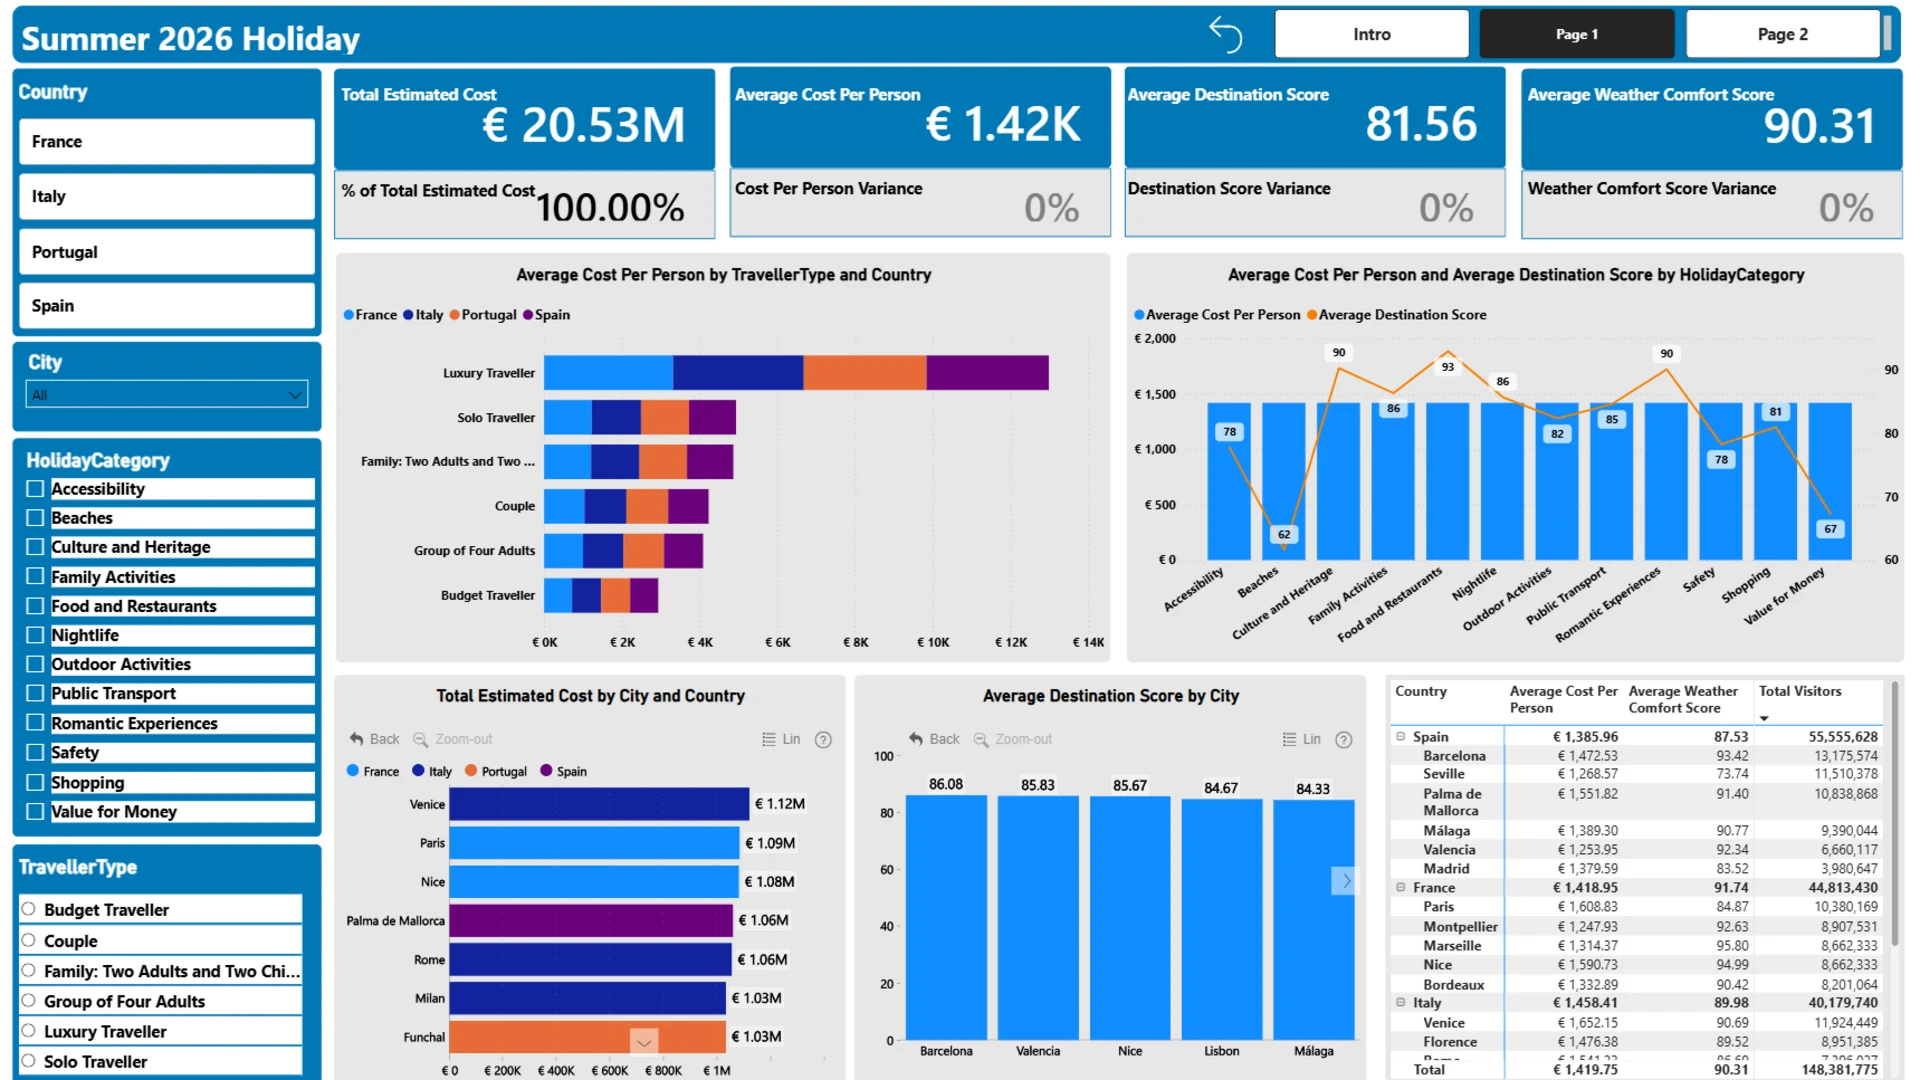
Designed an interactive 2-page Power BI dashboard to analyze destination costs, tourism pressure, weather comfort scores, and traveler preferences across European countries (France, Italy, Portugal, Spain).
This interactive Power BI report was prepared for the FP20 Analytics Challenge in September 2026.


Mobile view allows you to interact with the report. To Download the template please switch to desktop view.
