Feel free to leave your vote:
7
Share template with others
Summary
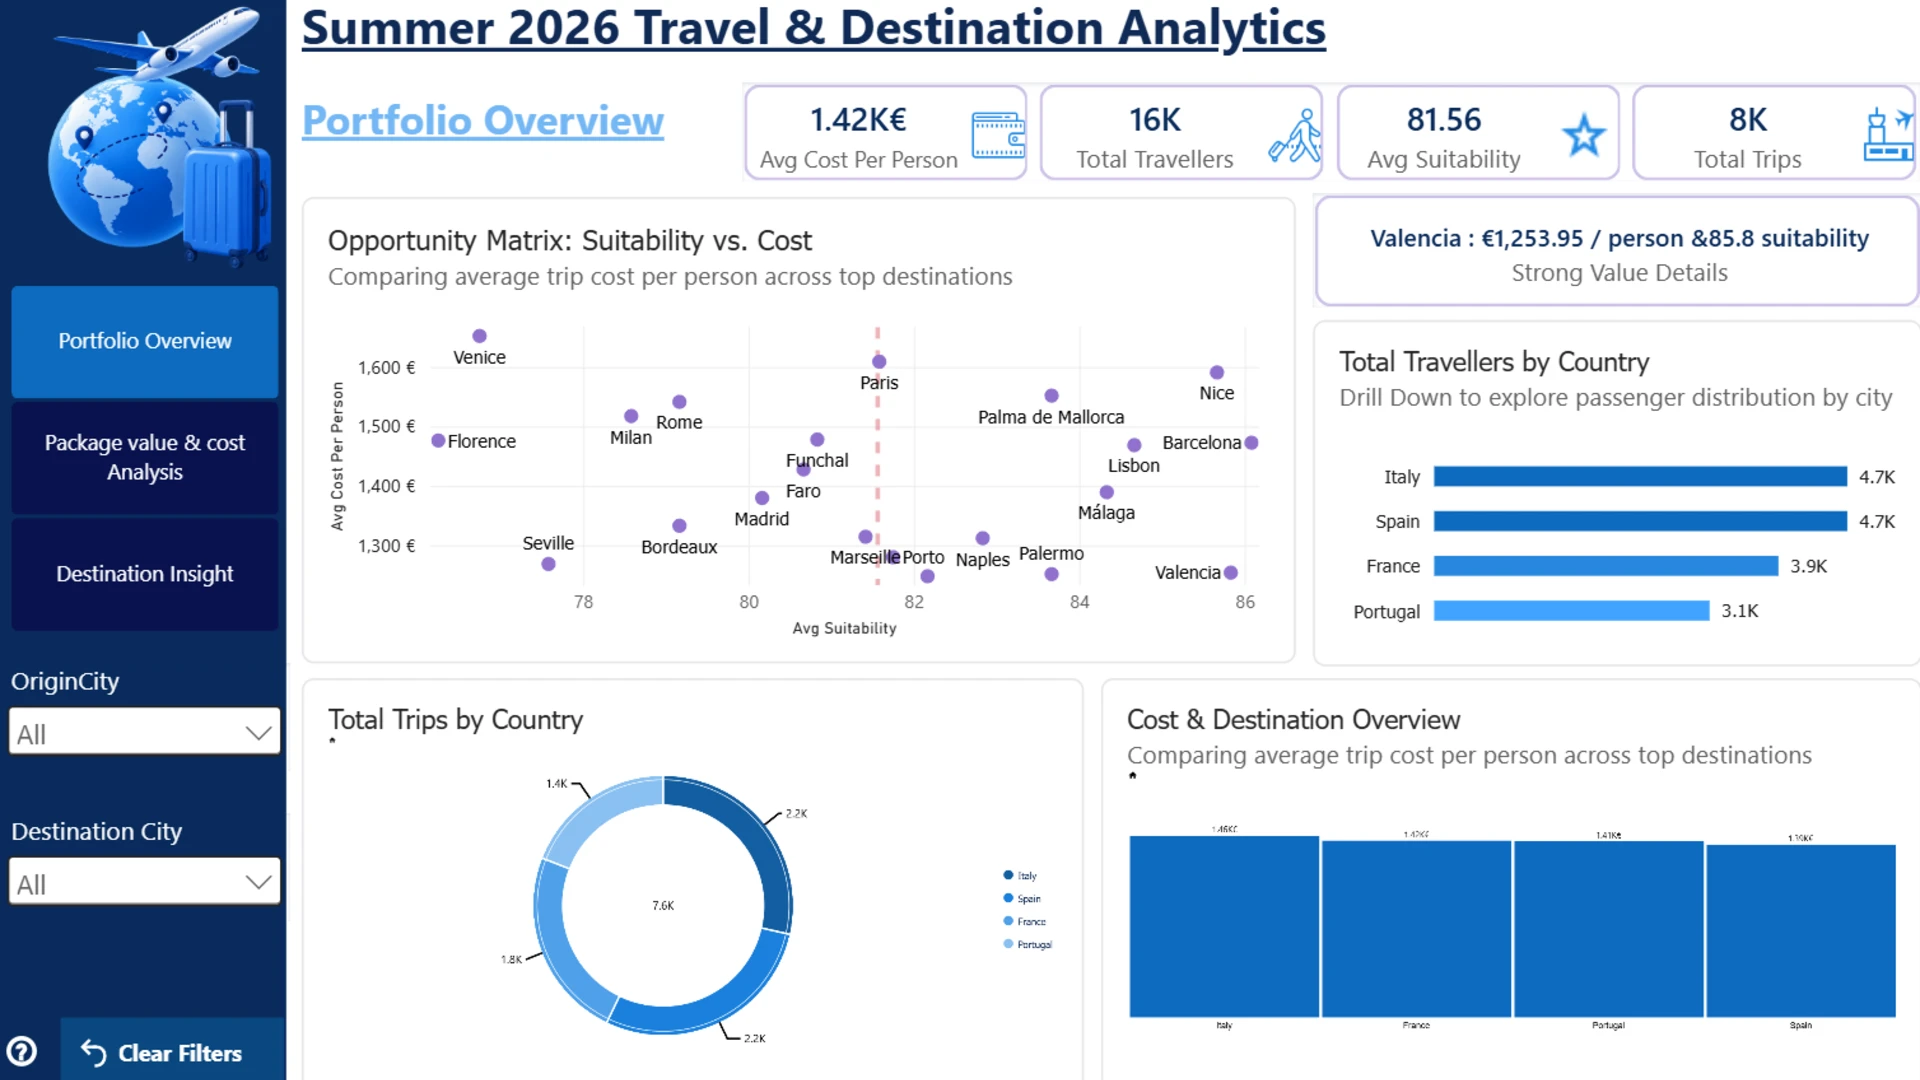
An interactive Power BI report created for the FP20 Analytics Challenge 40, analyzing Summer 2026 holiday travel data to compare destinations, weather conditions, and travel patterns.
Key Features & Insights
Interactive Navigation: ZoomCharts Drill Down Visuals make it easy to explore the data and cross-filter between visuals.
In-Report Guidance: Each page includes an Info (?) icon explaining the page objective, key metrics, and how to interact with the visuals.
Destination Suitability: Compare destinations across different holiday categories and identify the cities that best match specific travel preferences.
Seasonality & Weather: Explore weather comfort scores together with monthly travel trends to understand how destination suitability changes throughout the summer.
Detailed Tooltips: Visual tooltips provide additional metrics and context without overcrowding the main report pages.
Key Features & Insights
Interactive Navigation: ZoomCharts Drill Down Visuals make it easy to explore the data and cross-filter between visuals.
In-Report Guidance: Each page includes an Info (?) icon explaining the page objective, key metrics, and how to interact with the visuals.
Destination Suitability: Compare destinations across different holiday categories and identify the cities that best match specific travel preferences.
Seasonality & Weather: Explore weather comfort scores together with monthly travel trends to understand how destination suitability changes throughout the summer.
Detailed Tooltips: Visual tooltips provide additional metrics and context without overcrowding the main report pages.



Mobile view allows you to interact with the report. To Download the template please switch to desktop view.
