Feel free to leave your vote:
2
Share template with others
Summary
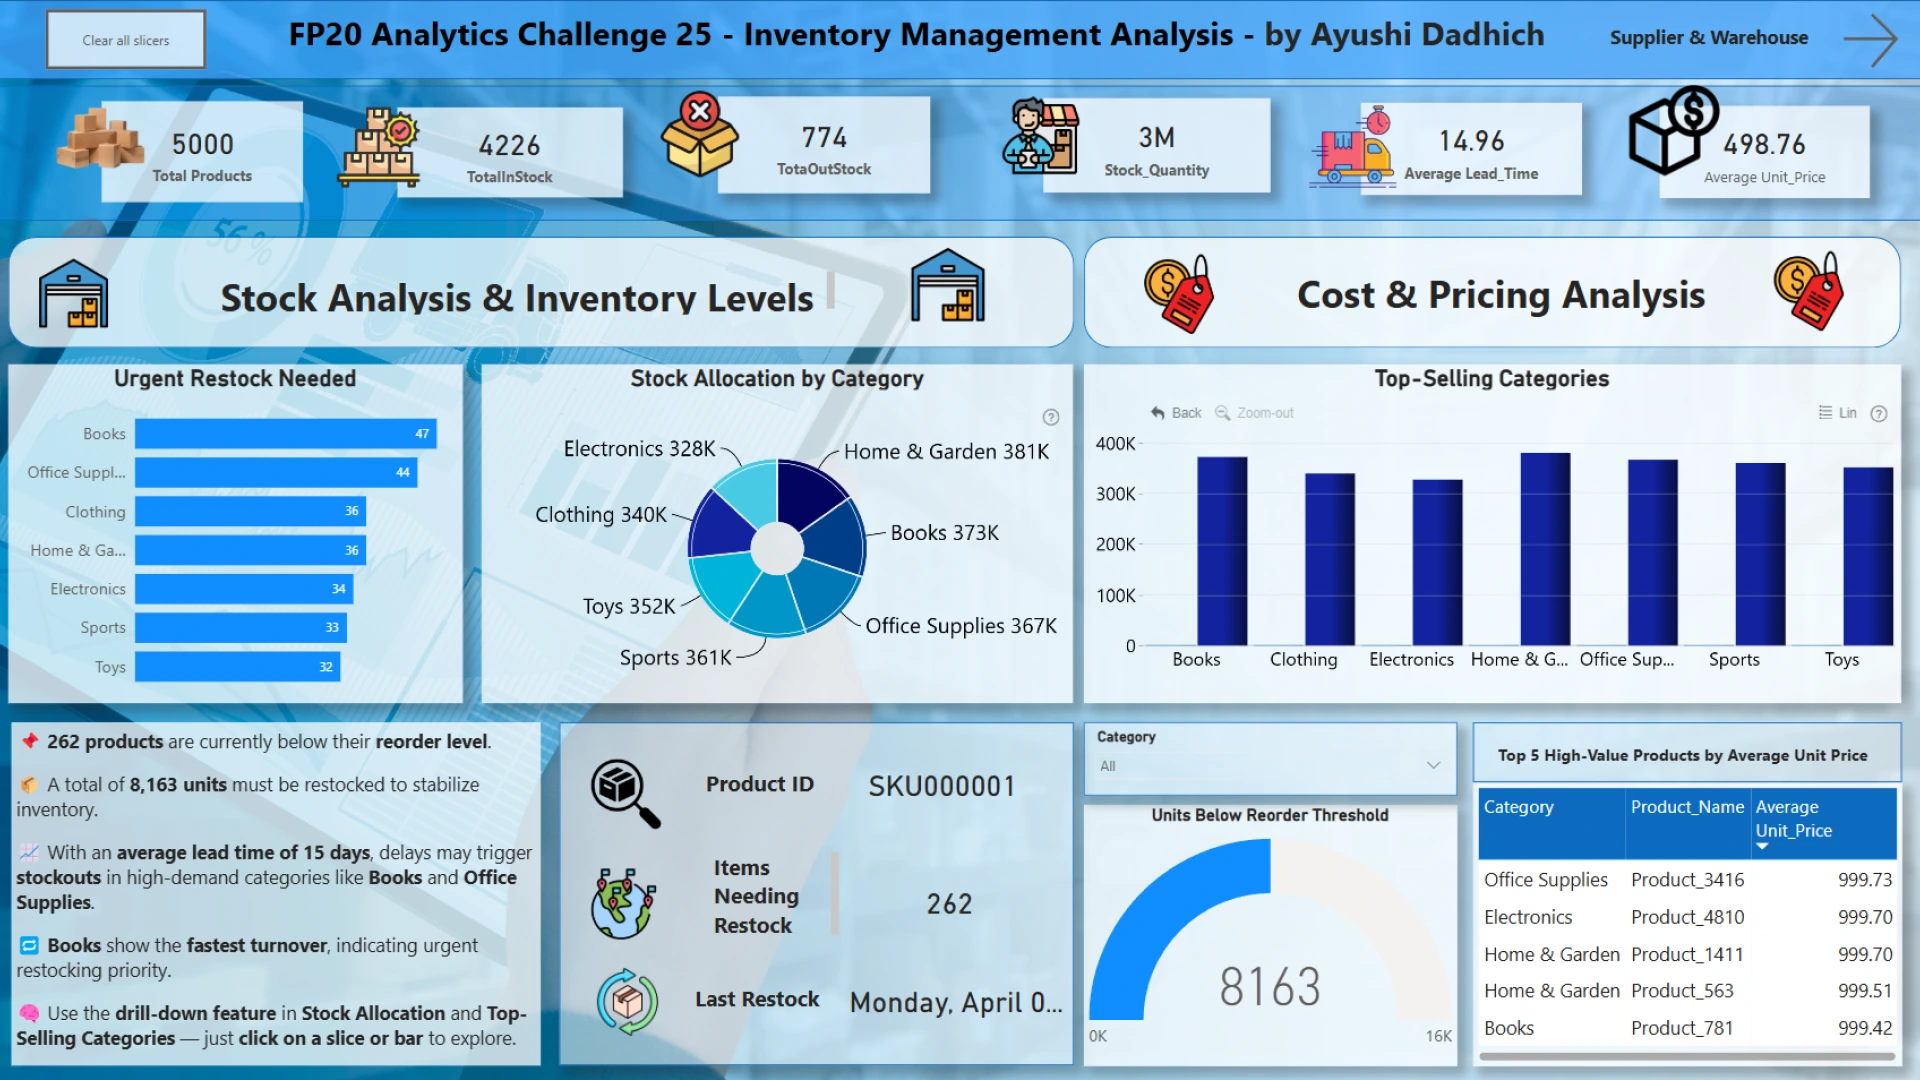
Designed an interactive, insights-driven Power BI dashboard to analyze stock levels, restocking efficiency, supplier performance, and warehouse distribution across 10 countries. Leveraged ZoomCharts visuals for dynamic drill-downs and intuitive data exploration. Key insights include reorder prioritization, average lead times, and category-level stock imbalances, enabling smarter supply chain decisions. Features: Real-time visibility into 5000+ products & 50 suppliers Strategic restocking alerts with reorder threshold tracking Geographic & monthly stock distribution mapping ZoomCharts-powered category & supplier deep dives Clean, consistent UI with guided tooltips and KPIs Outcome: Identified 262 critical products for restock and optimized supplier selection by lead time performance—empowering data-backed operational decisions.
Mobile view allows you to interact with the report. To Download the template please switch to desktop view.