Registration Open
Registration Open
26 March | 11:00
-
Reset your password
We'll email you instructions on how to reset your password
Join Challenge 25 and create a Power BI report for inventory management!
Workshop | Workshop: Mastering Inventory Management Reporting in Power BI
Workshop | Workshop: Mastering Inventory Management Reporting in Power BI
03 April | 09:00
-
Webinar | Top 5 Power BI Reports for Inventory Management: Insights & Best Practices
Webinar | Top 5 Power BI Reports for Inventory Management: Insights & Best Practices
29 April | 09:00
26 March - 23 April
Want to learn to build PRO reports? With personalized feedback and informative workshops, this is your opportunity to take your report-building skills to the next level, build your professional portfolio, and network with like-minded people.
The ZoomCharts challenge is hosted in partnership with FP20 Analytics – a group that unites passionate and inspiring data enthusiasts, and helps new data analysts improve their skills and build a competitive portfolio. Join in and sharpen your skills together with this open and friendly data community. Read more about the challenges on the FP20 Analytics website. Join the community on LinkedIn.
Participate in FP20 Analytics ZoomCharts Challenge to enrich your skill in creating PRO reports that help business users explore data quickly and intuitively.
The best report’s creator will receive a $300 Amazon gift card from ZoomCharts. The ZoomCharts winner will be announced in a special live webinar session on April 29th, where we will review the Top 5 entries from the challenge.
1. Register for the challenge:
2. Build your report in Power BI:
3. Improve your report and learn new skills:
4. Submit your challenge entry:
5. Finalize your participation to compete for the ZoomCharts grand prize:
6. Attend challenge closing webinar to hear the results:
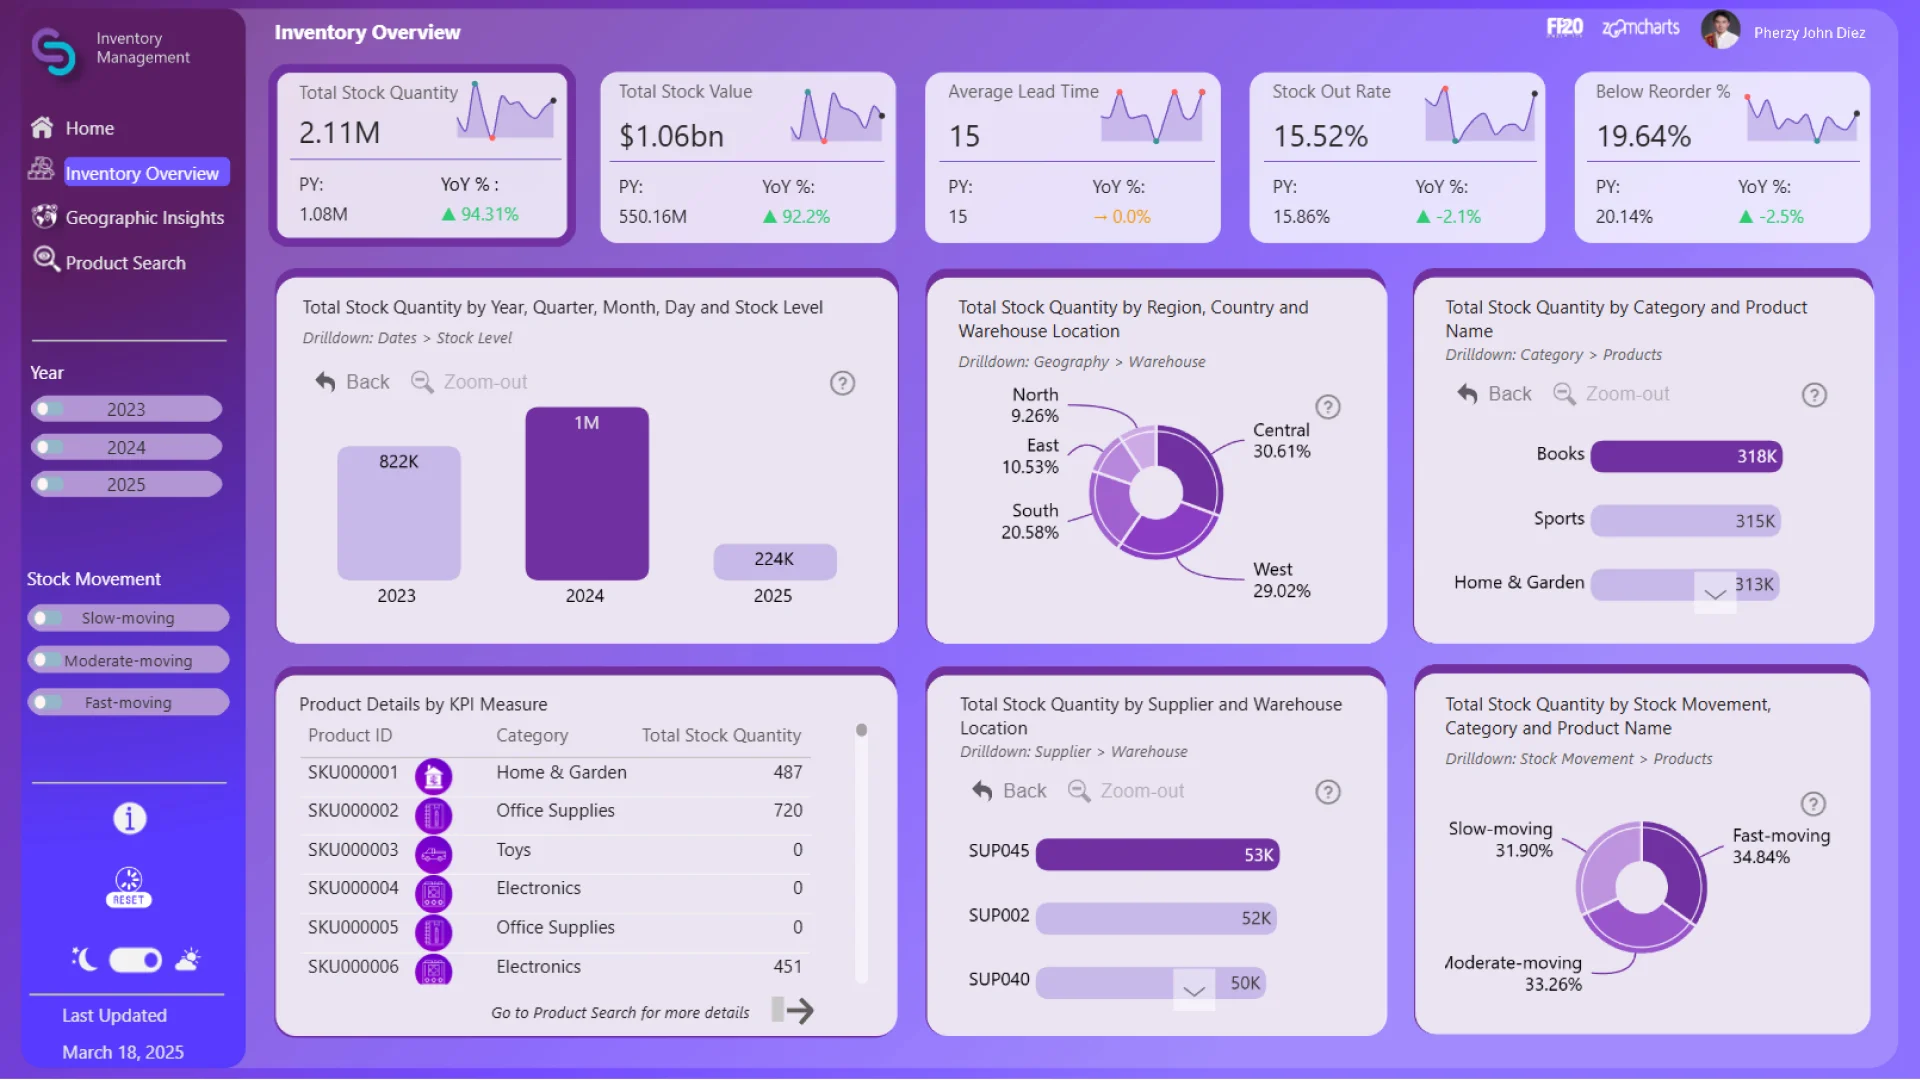
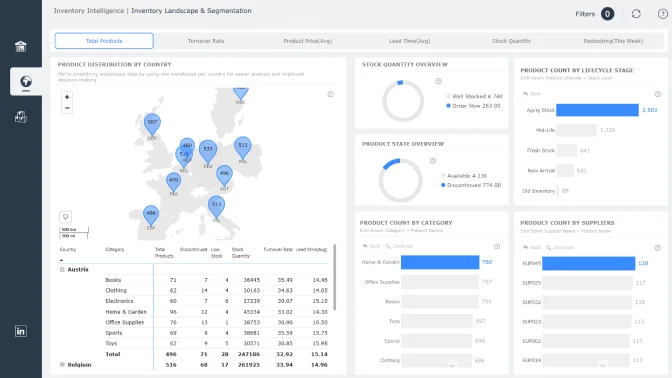
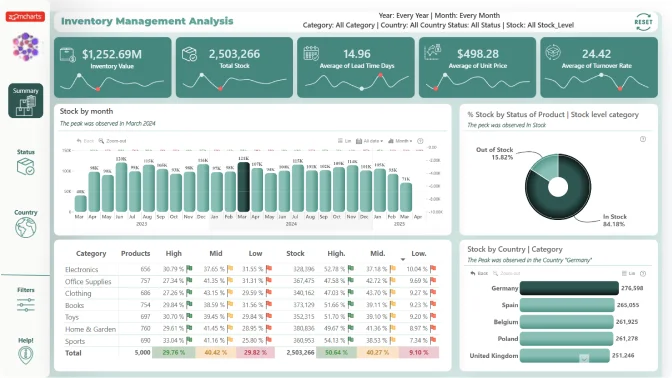
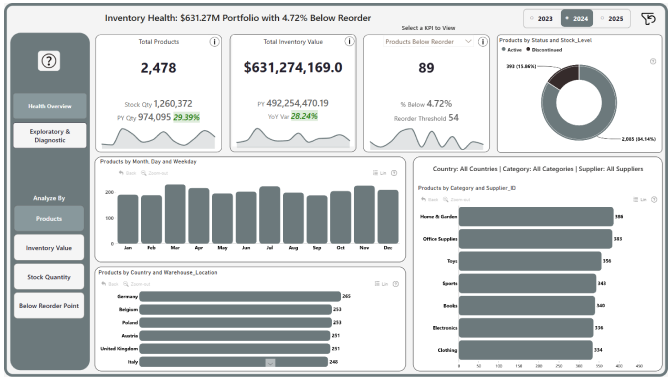
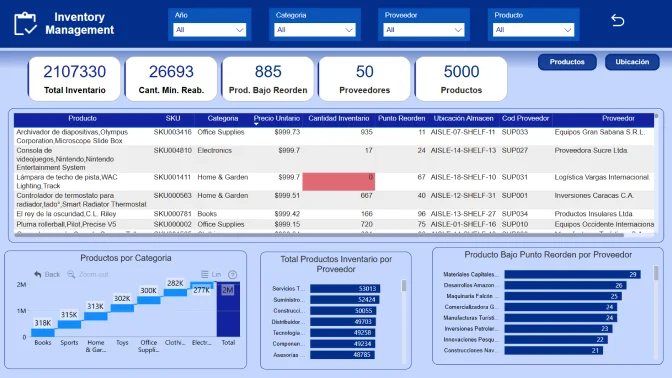
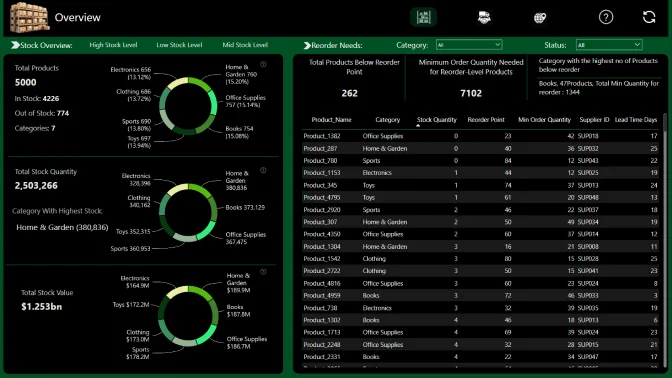
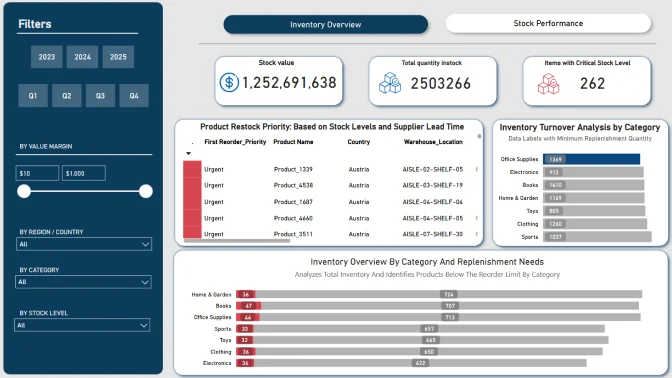
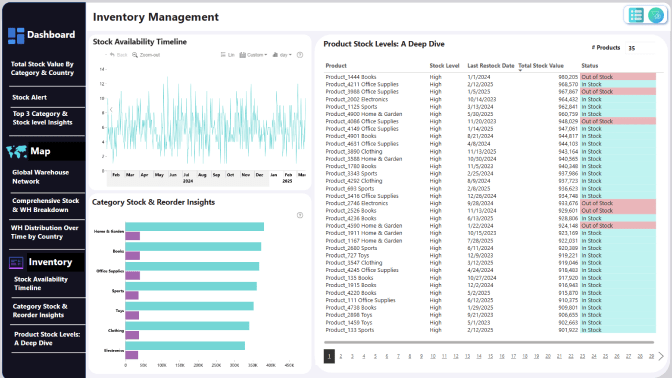
Welcome to the Inventory Management Challenge! Efficient inventory management is crucial for balancing supply and demand while minimising costs. This challenge explores key aspects such as stock levels, supplier performance, warehouse utilisation, and reorder strategies. By analysing this dataset, you will identify trends, optimise restocking, and assess cost efficiency. Your goal is to uncover actionable insights that enhance inventory operations and decision-making. Use statistical techniques, visualisation tools and storytelling to support your findings. Can you optimise inventory performance and improve supply chain efficiency? Let’s dive in and explore the data!
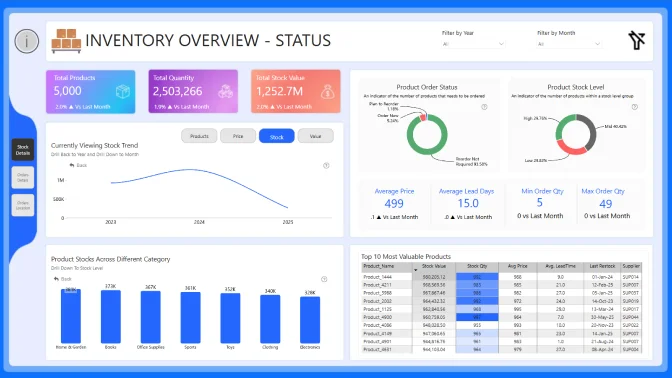
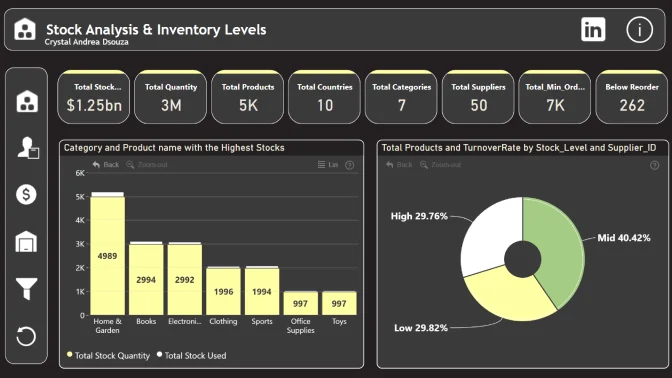
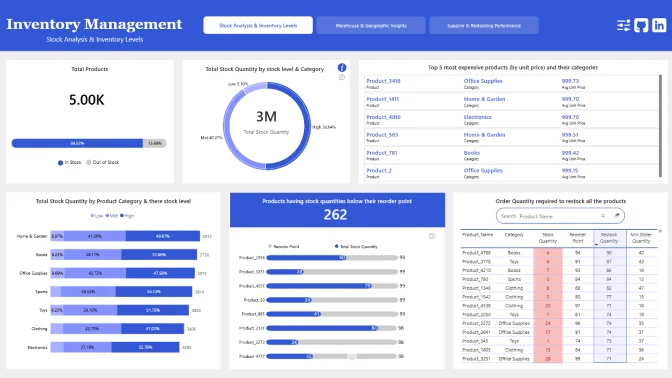
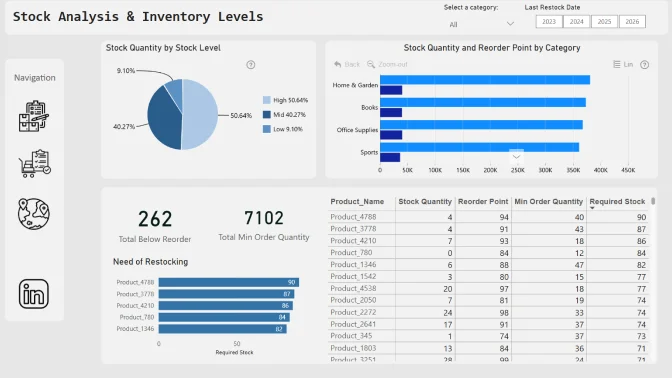
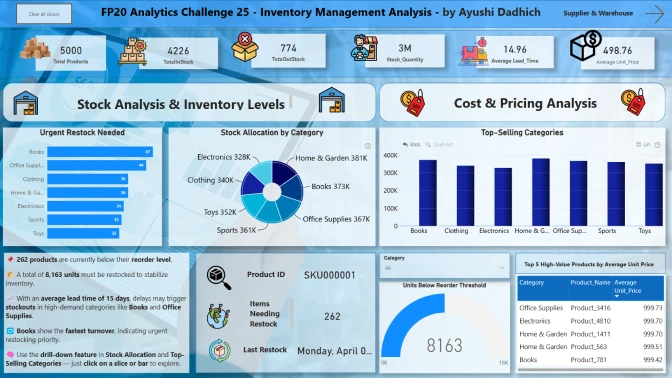
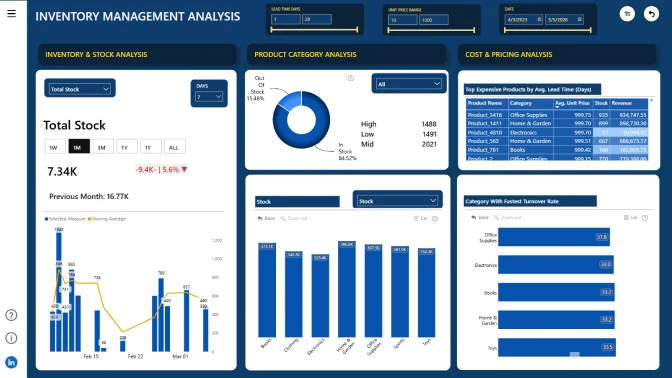
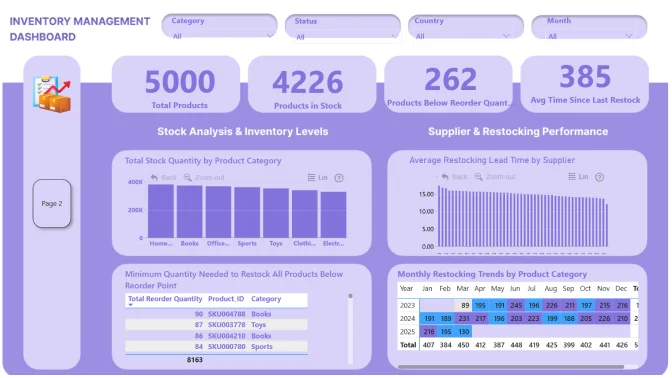
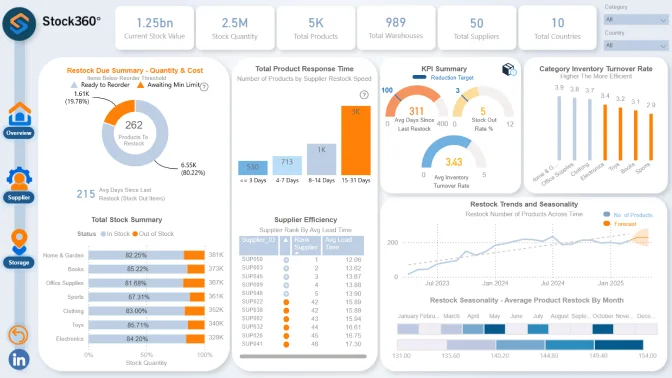
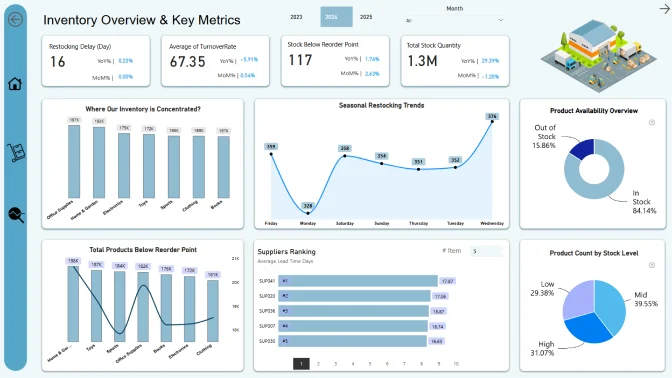
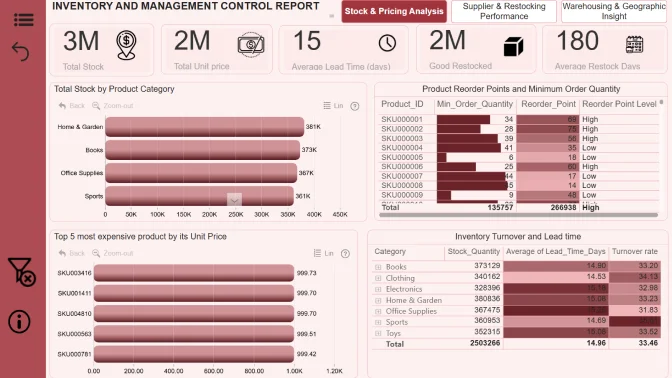
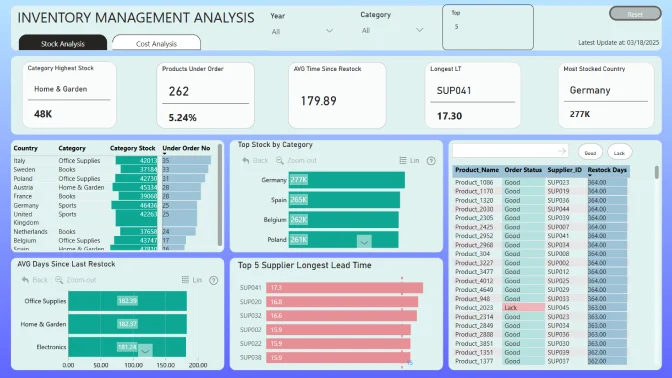
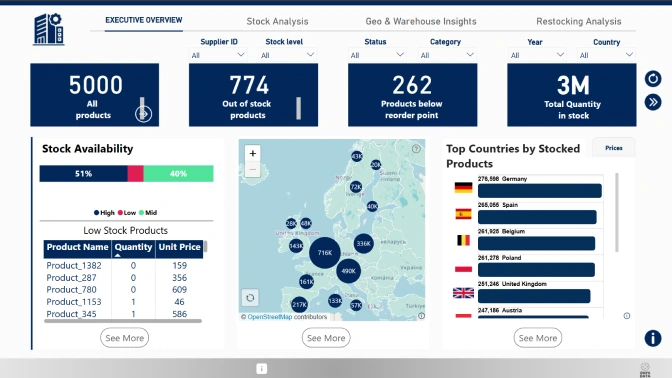
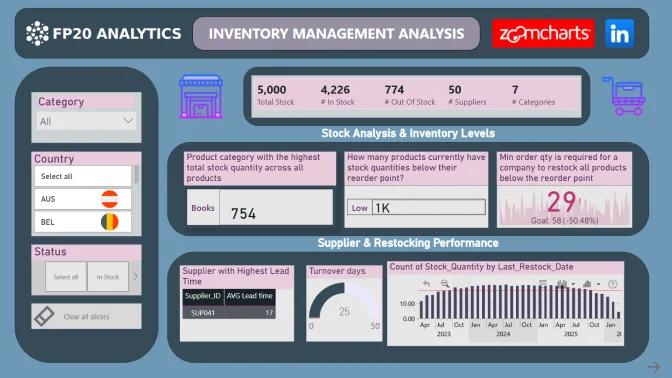
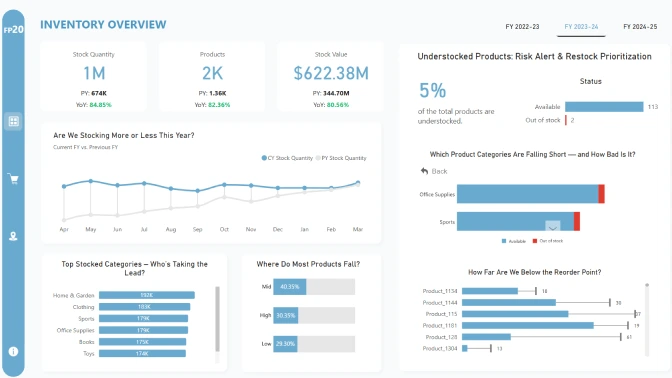
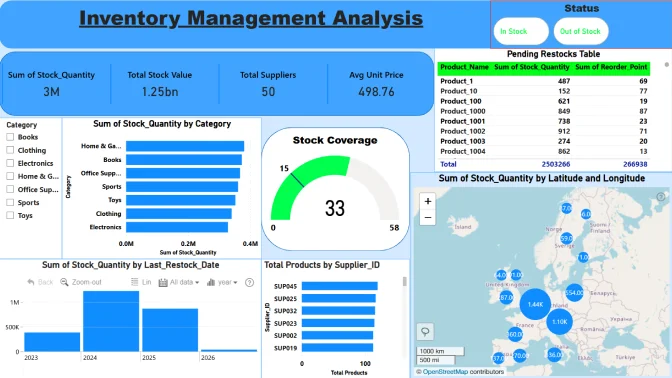
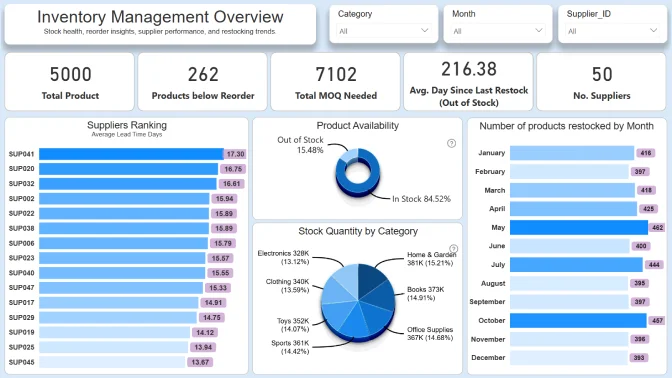
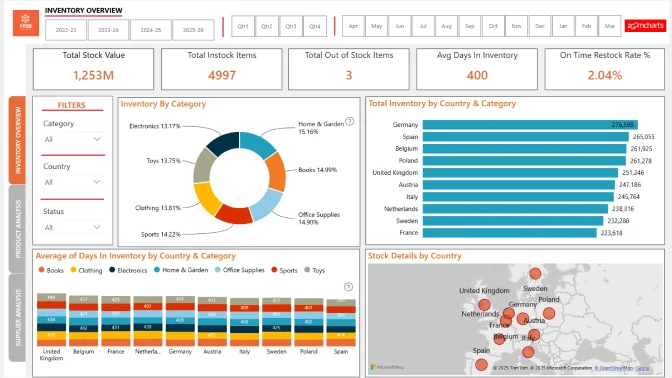
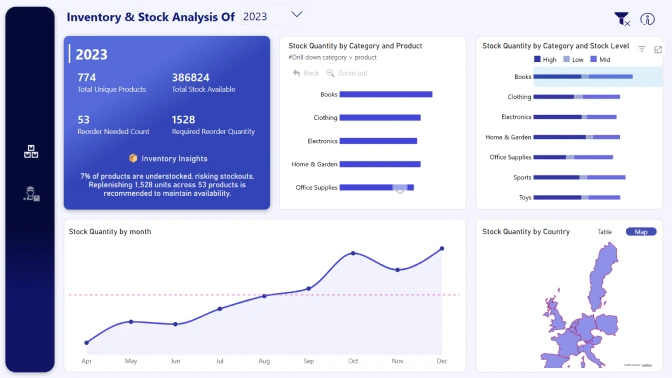
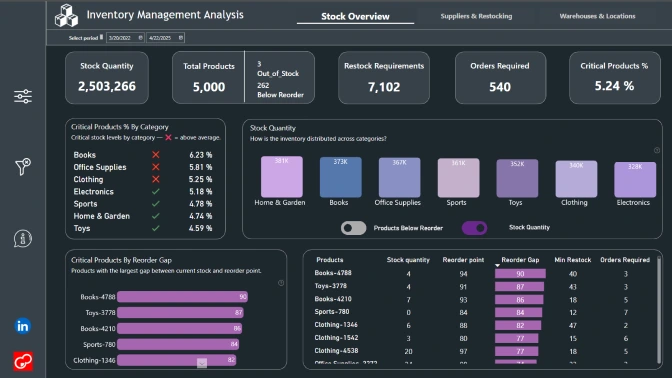
Stock Analysis & Inventory Levels
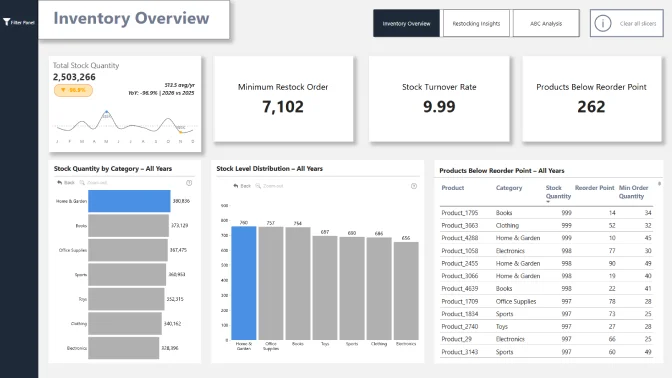
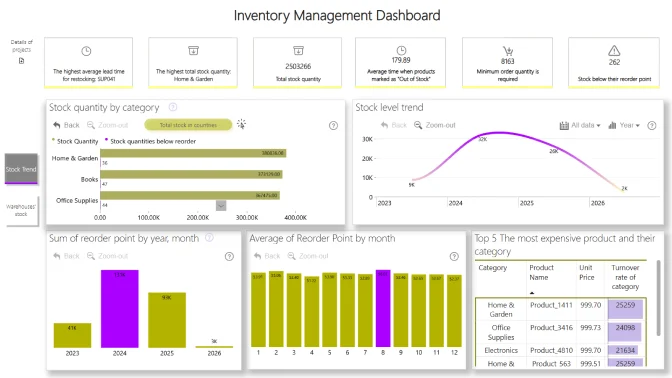
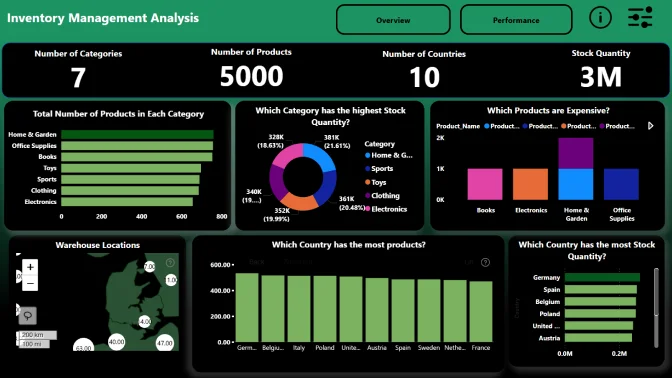
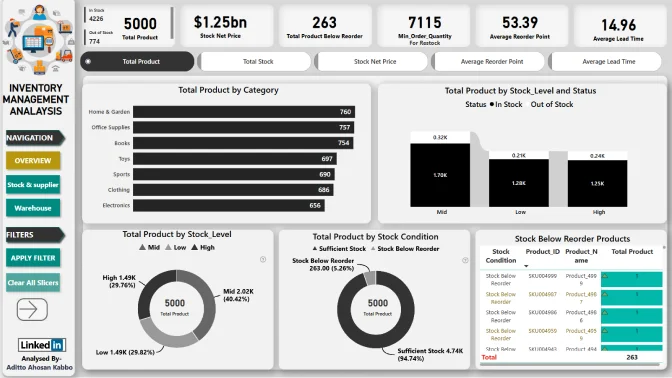
1. Which product category has the highest total stock quantity across all products?
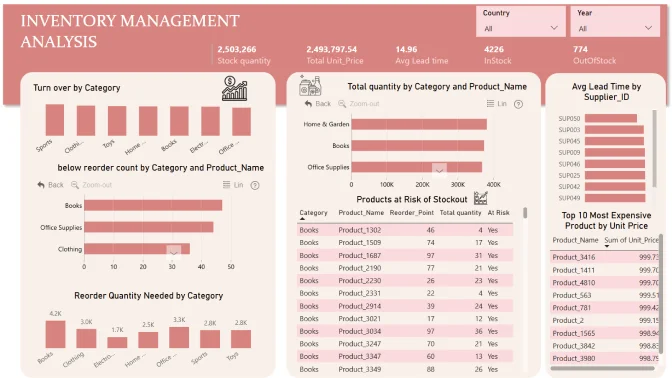
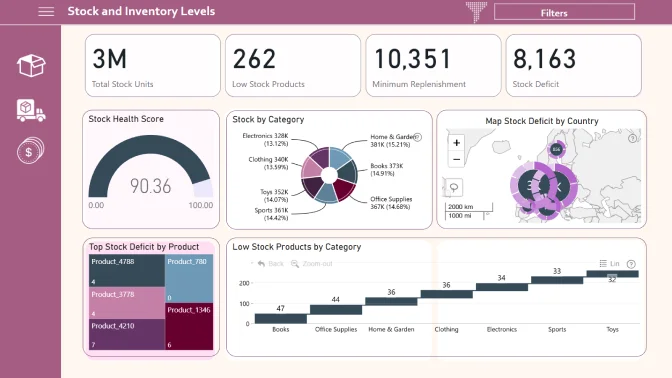
2. How many products currently have stock quantities below their reorder point?
3. What minimum order quantity is required for a company to restock all products below the reorder point?
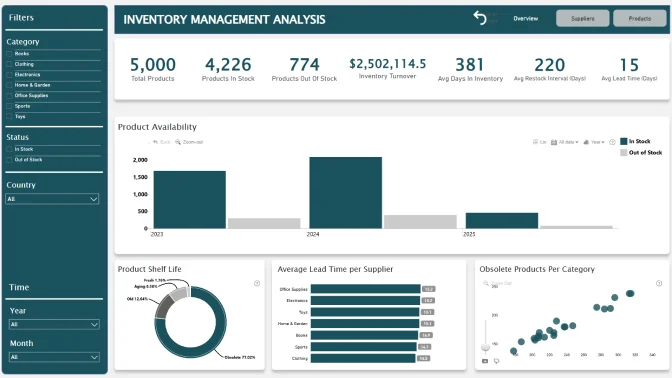
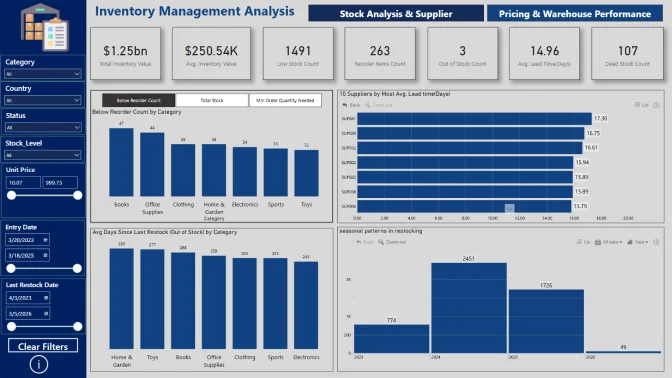
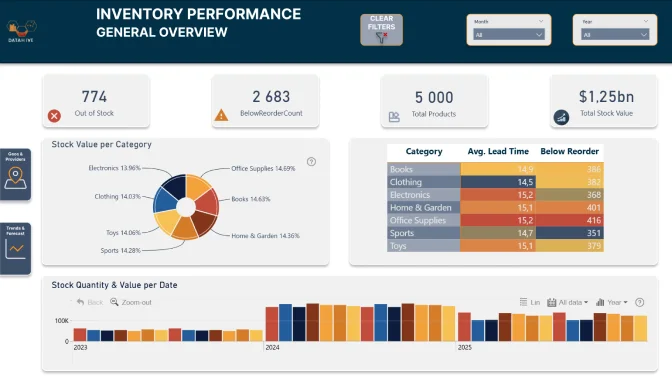
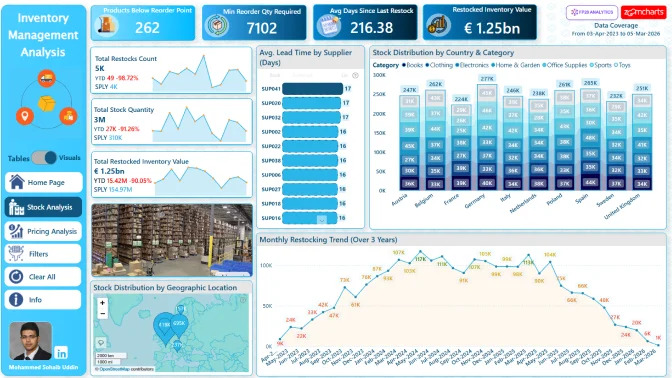
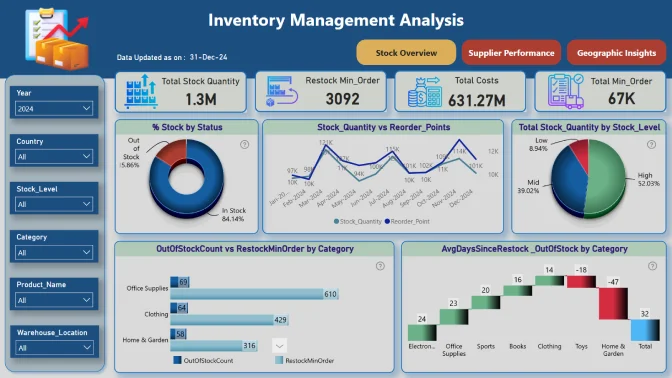
Supplier & Restocking Performance
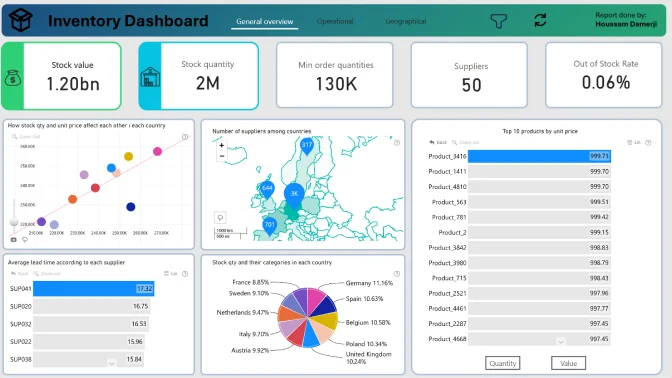
4. Which supplier has the highest average lead time for restocking?
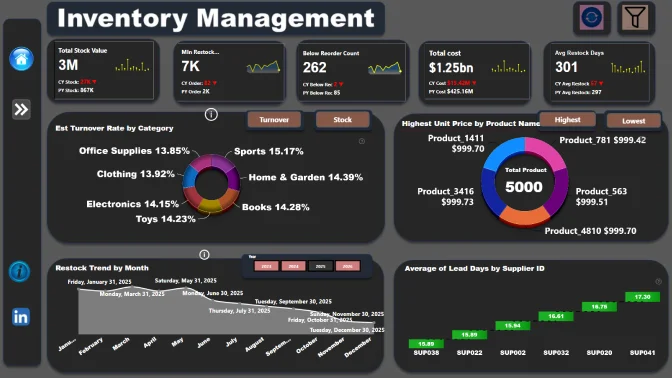
5. What is the average time since the last restock for products marked as "Out of Stock"?
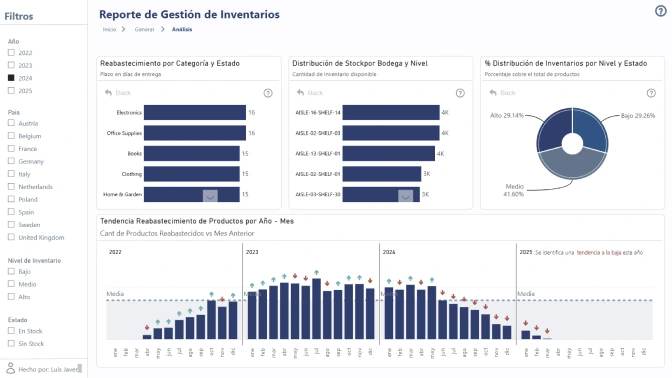
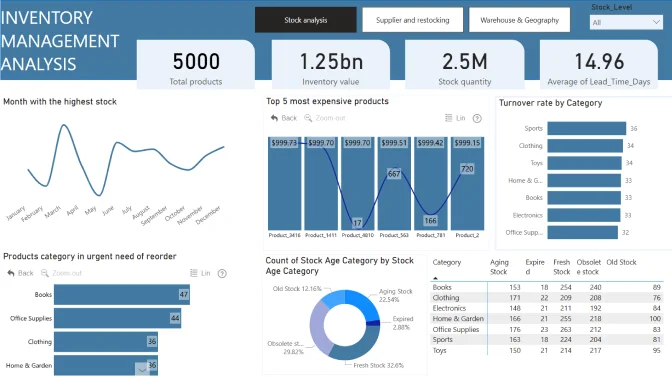
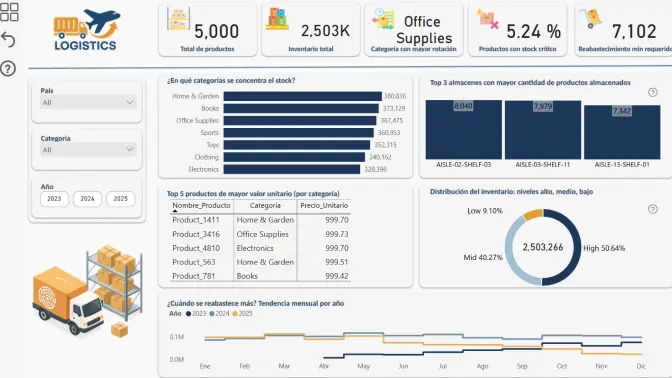
6. Identify the months when the highest number of products were restocked - are there any seasonal trends?
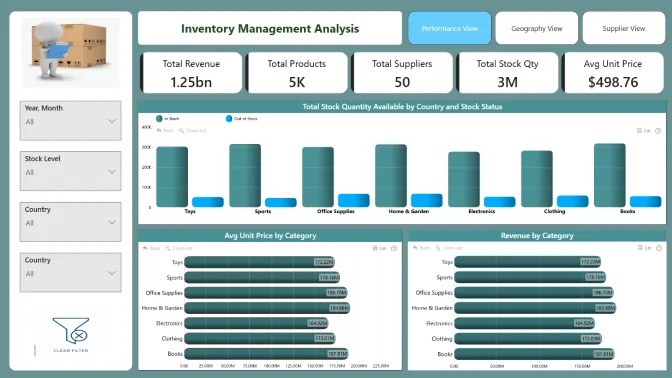
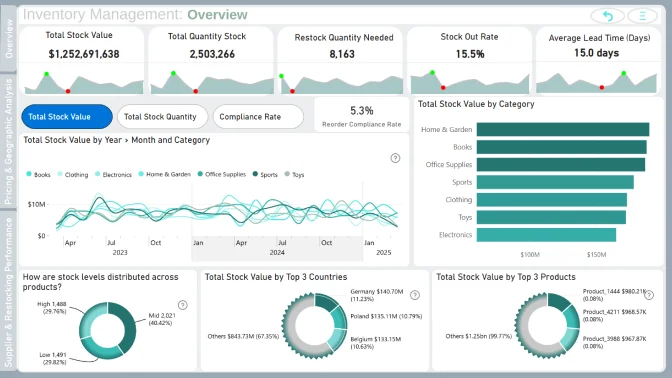
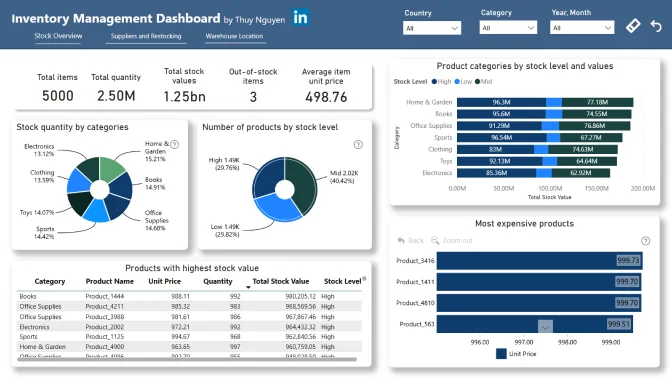
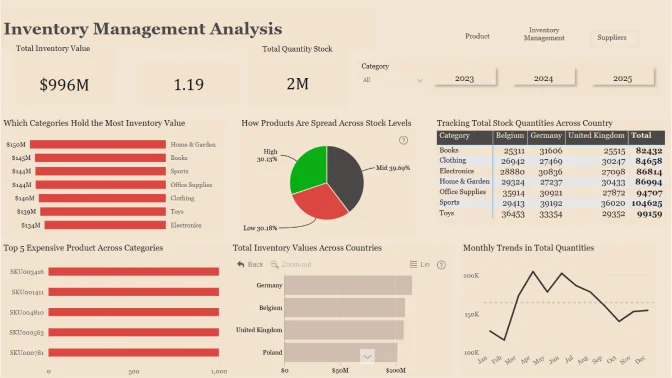
Cost & Pricing Analysis
7. Identify the top 5 most expensive products (by unit price) and their categories.
8. Which product category has the fastest turnover based on stock quantity and lead time?
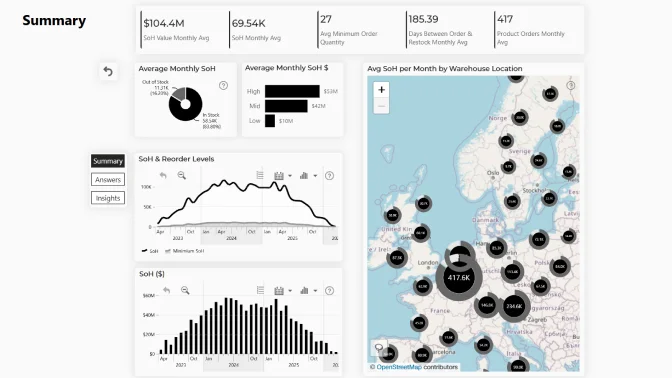
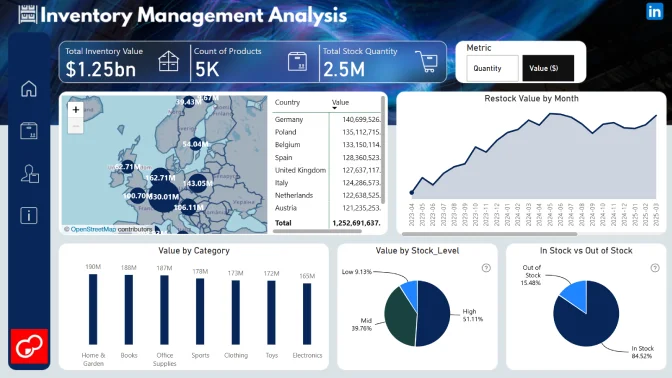
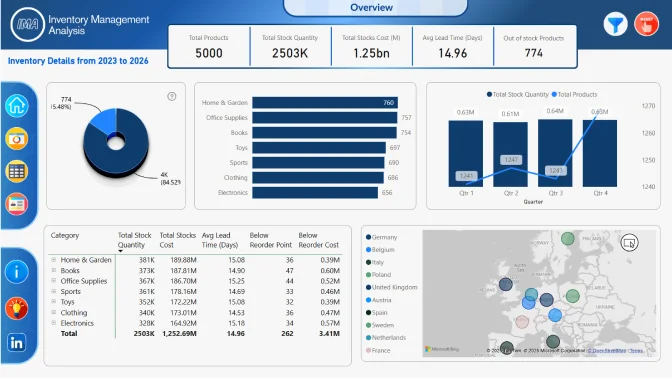
Warehouse & Geographic Insights
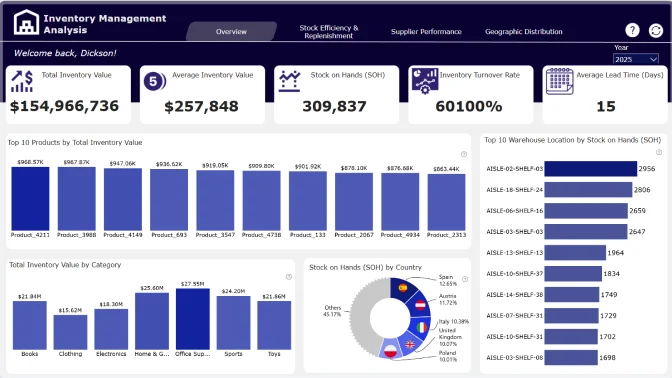
9. Which warehouse location has the highest number of products stored?
10. Which country has the most stocked items, and which top 3 counties have the highest stocked quantities by different product categories?
Business users use reports to make data-driven decisions. That’s why reports are called effective if they enable users to drill down and filter data quickly and intuitively to find answers to any question they might have and analyse data in all possible directions and dimensions.
Each report is evaluated based on three main criteria: intuitiveness, insightfulness, and interactivity. These factors ensure that the reports are not only accurate and functional, but also meet the target audience's needs and are ready to be presented to the end-users.
Workshop | Workshop: Mastering Inventory Management Reporting in Power BI
Workshop | Workshop: Mastering Inventory Management Reporting in Power BI
03 April | 09:00
-
Webinar | Top 5 Power BI Reports for Inventory Management: Insights & Best Practices
Webinar | Top 5 Power BI Reports for Inventory Management: Insights & Best Practices
29 April | 09:00
26 March - 23 April