Feel free to leave your vote:
0
Share template with others
Summary
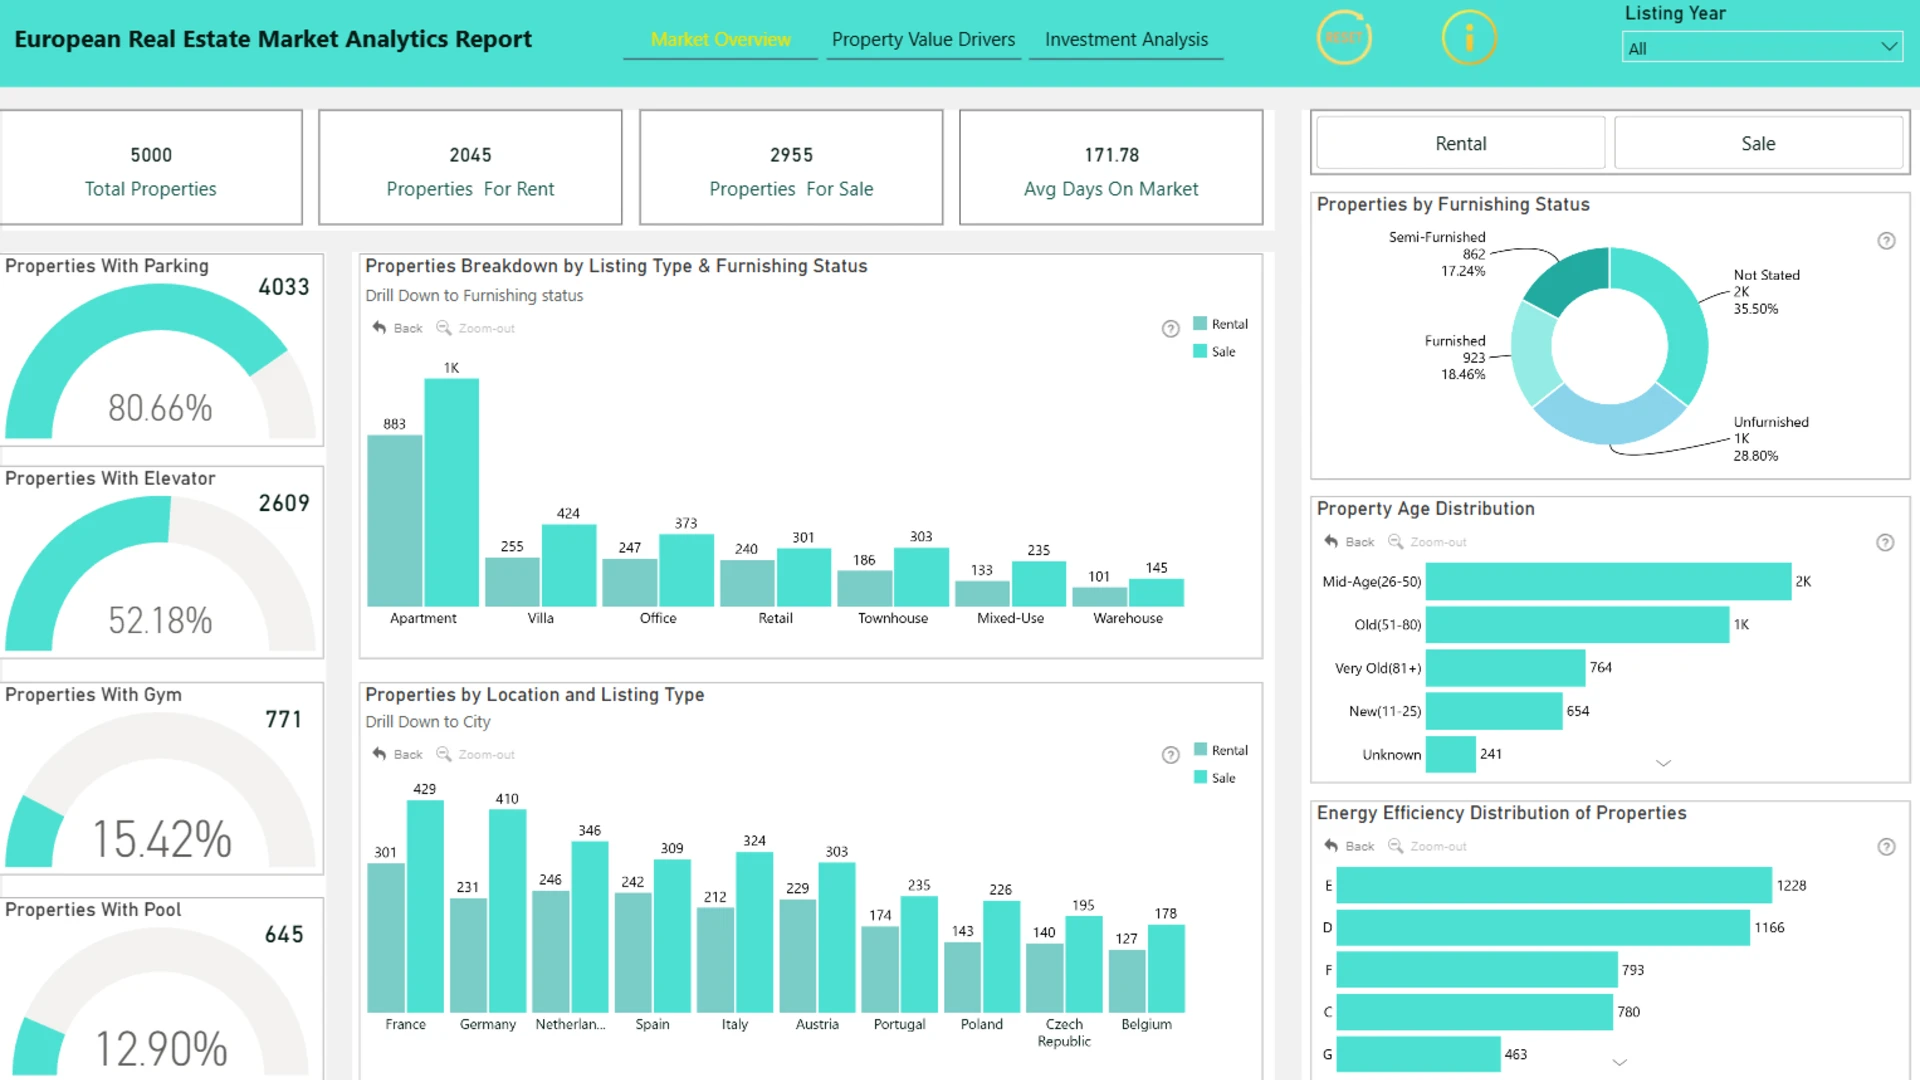
This interactive Power BI report explores the European Real Estate Market Analytics dataset using ZoomCharts Drill Down custom visuals for Power BI. It highlights property prices, price per square meter, listing activity, and property characteristics across countries and cities, helping users identify market trends, compare locations, and evaluate investment opportunities.
The report was submitted to the FP20 Analytics ZoomCharts Data Challenge #36 (March – April 2026).
Author’s Description:
This project analyzes real estate data to uncover key trends in property pricing, rental performance, and market behavior. It explores how factors such as location, property type, size, age, and amenities influence prices and rents. The dashboard highlights relationships like price vs. size and evaluates investment potential using rental yield and market speed. Overall, it helps stakeholders make informed decisions by identifying high-value, high-return property opportunities.
ZoomCharts visuals used
Mobile view allows you to interact with the report. To Download the template please switch to desktop view.