Feel free to leave your vote:
0
Share template with others
Summary
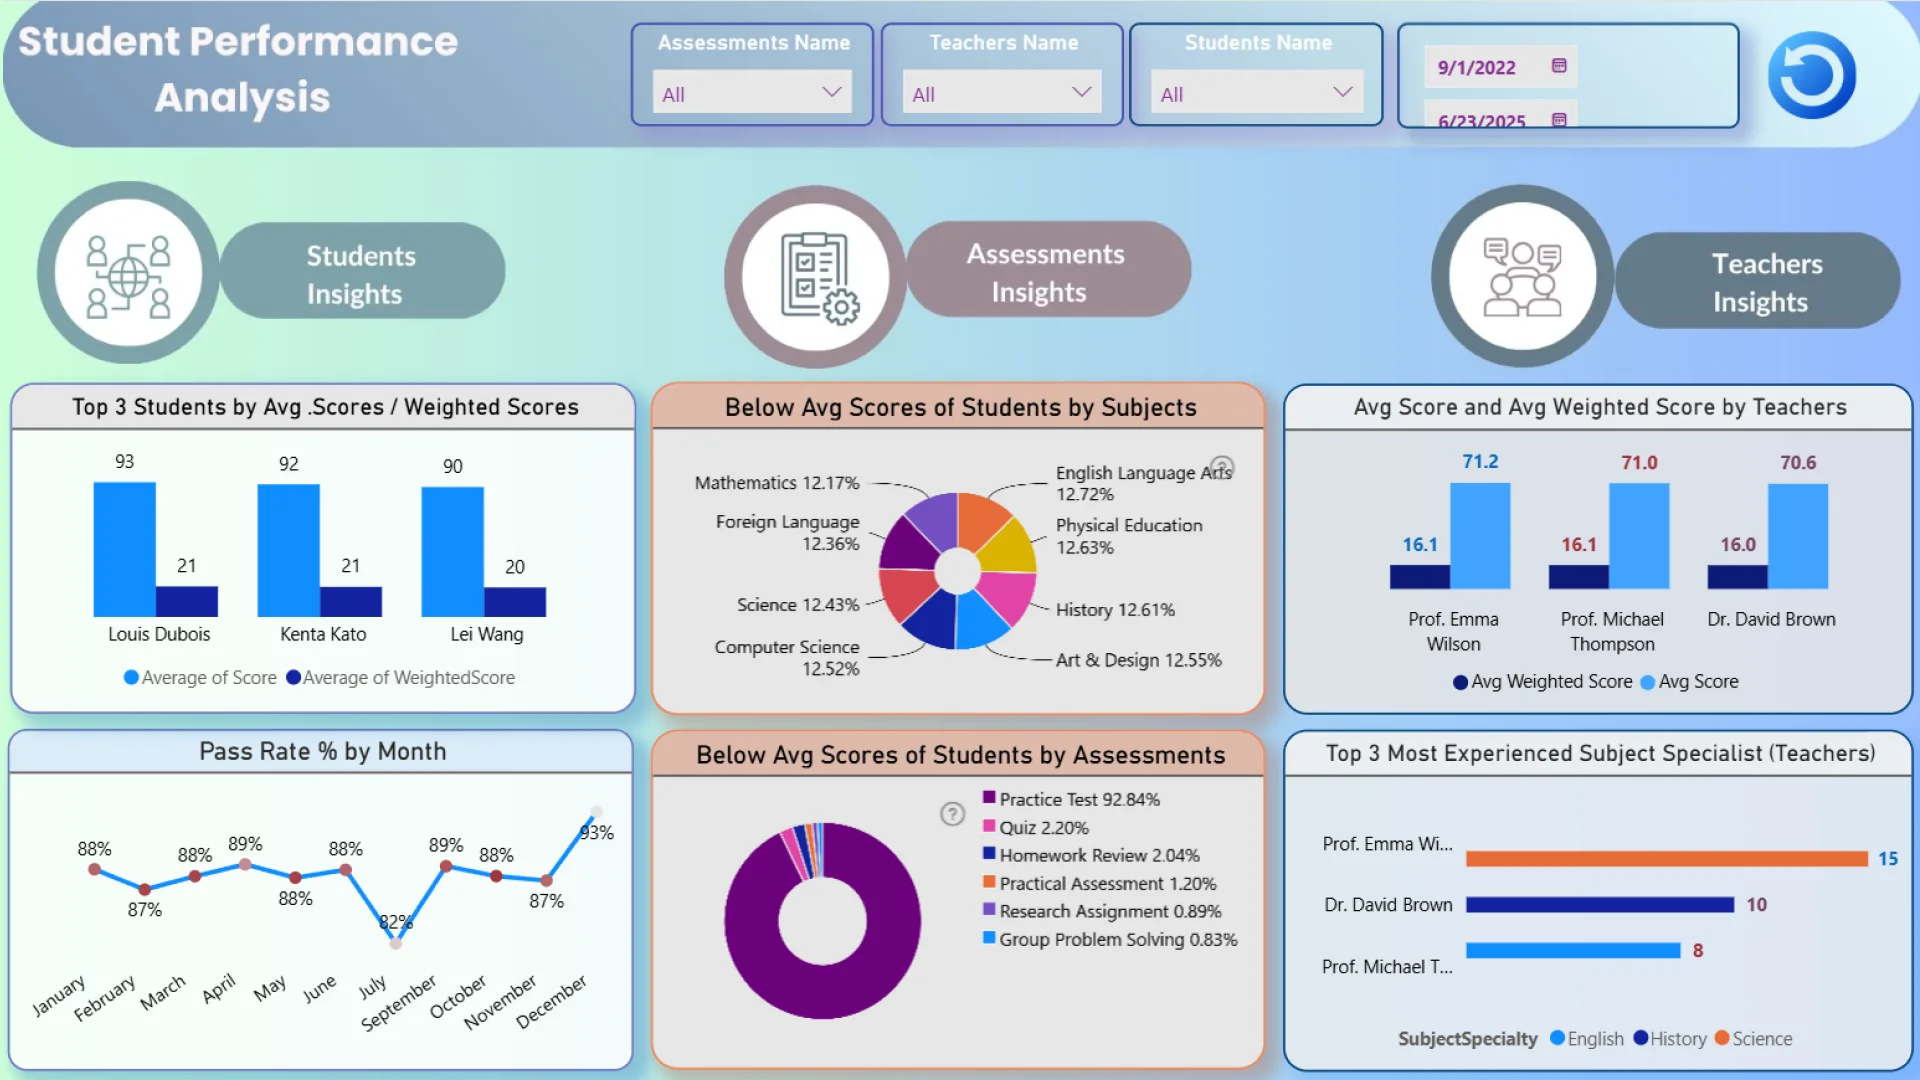
This Power BI report uses the Education/Student Performance dataset and features ZoomCharts Drill Down PRO custom visuals for Power BI. It was submitted to the FP20 Analytics ZoomCharts Data Challenge 31 in October 2025.
Author Description:
An interactive Power BI dashboard to analyze and visualize students’ academic performance across multiple subjects, assessments, and academic years (2022–2025). This project provides data-driven insights into student achievement, teacher effectiveness, and assessment outcomes — helping educators make informed decisions to improve learning outcomes.
Mobile view allows you to interact with the report. To Download the template please switch to desktop view.