Feel free to leave your vote:
0
Share template with others
Summary
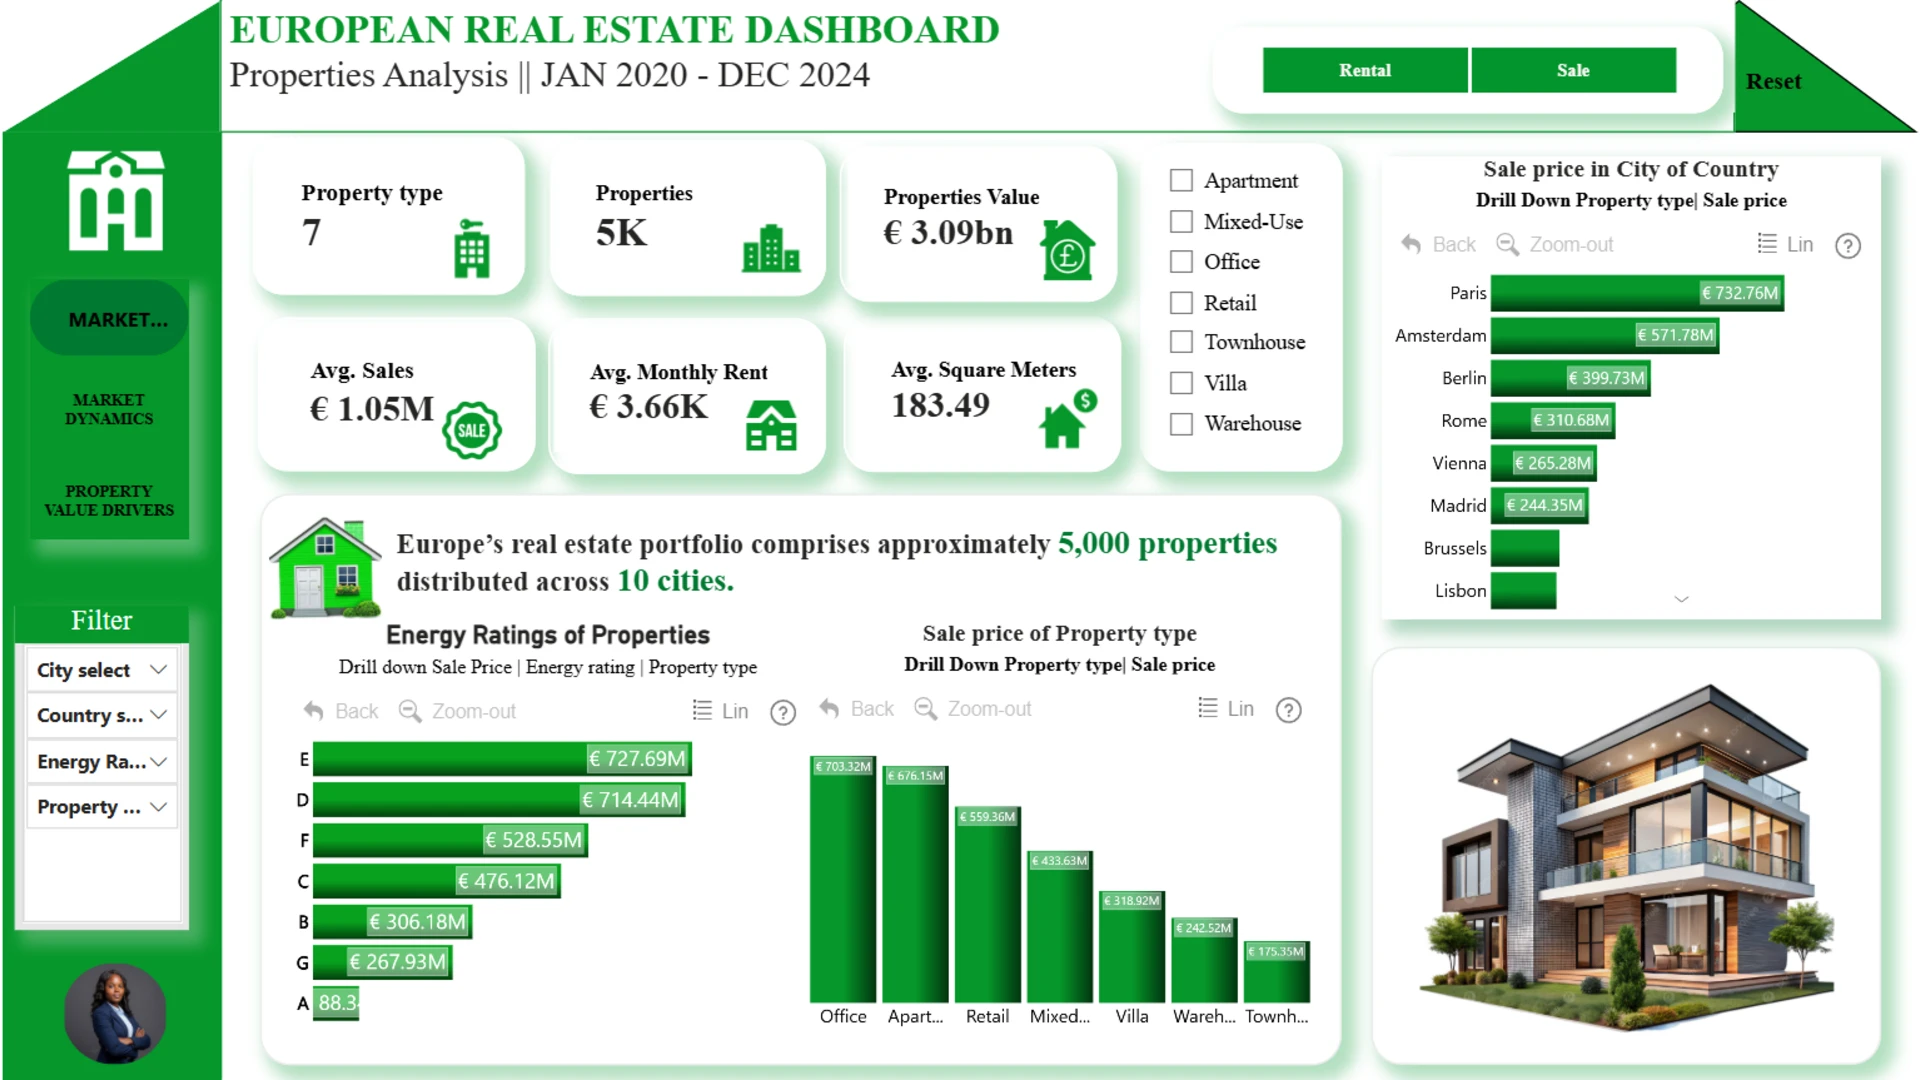
This interactive Power BI report explores the European Real Estate Market Analytics dataset using ZoomCharts Drill Down custom visuals for Power BI. It highlights property prices, price per square meter, listing activity, and property characteristics across countries and cities, helping users identify market trends, compare locations, and evaluate investment opportunities.
The report was submitted to the FP20 Analytics ZoomCharts Data Challenge #36 (March – April 2026).
Author’s Description:
A three dashboard analysis on Real Estate dataset representing a European property listing platform. The dataset contains 5,000 property listings across multiple European countries and cities
ZoomCharts visuals used
Mobile view allows you to interact with the report. To Download the template please switch to desktop view.